
A Method and Digital Oscilloscope Supporting Bode Diagram Variable Amplitude Sweep

A digital oscilloscope and amplitude technology, applied in the field of signal measurement, can solve the problems of poor reference effect, inability to accurately measure the loop response of the power loop, distortion of the Bode plot response curve, etc., to achieve convenient and fast operation, convenient scanning mode, Effects of Overcoming Limitations

Active Publication Date: 2021-04-13
SHENZHEN CITY SIGLENT TECH
View PDF9 Cites 0 Cited by
  • Summary
  • Abstract
  • Description
  • Claims
  • Application Information

AI Technical Summary

Problems solved by technology

[0005] The technical problem mainly solved by the present invention is: the existing digital oscilloscope cannot accurately measure the loop response for the power supply loop with some characteristics, resulting in serious distortion of the response curve and poor reference effect in the drawn Bode diagram

Method used


Image

  • A Method and Digital Oscilloscope Supporting Bode Diagram Variable Amplitude Sweep
  • A Method and Digital Oscilloscope Supporting Bode Diagram Variable Amplitude Sweep
  • A Method and Digital Oscilloscope Supporting Bode Diagram Variable Amplitude Sweep

Examples


Embodiment 1

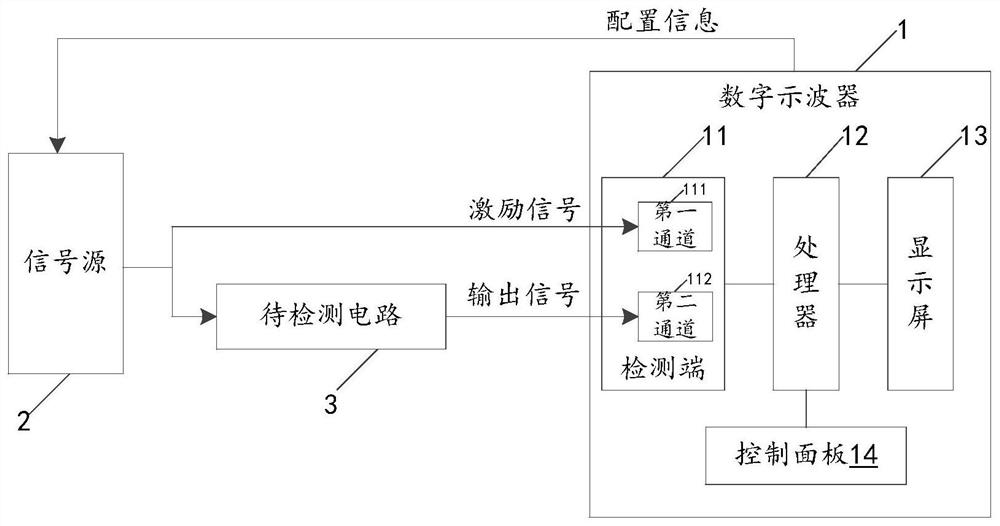
[0040] Please refer to figure 1 , the present application discloses a digital oscilloscope 1, which mainly includes a detection terminal 11, a processor 12, and a display 13, which will be described separately below.

[0041] In this embodiment, in order to enable the digital oscilloscope 1 to measure external signals and draw a Bode diagram, external electronic devices, such as a signal source 2 and a circuit 3 to be detected, are also needed. Wherein, the signal source 2 is connected with the processor 12 in the digital oscilloscope 1, as the generation equipment of detection signal, is used to receive the configuration information that processor 12 produces to produce corresponding excitation signal; The circuit 3 to be detected can be a power supply circuit, amplifying Circuits and other circuits that need to be tested.

[0042] The detection terminal 11 includes a first channel 111 and a second channel 112, the first channel 111 and the second channel 112 are respectivel...

Embodiment 2

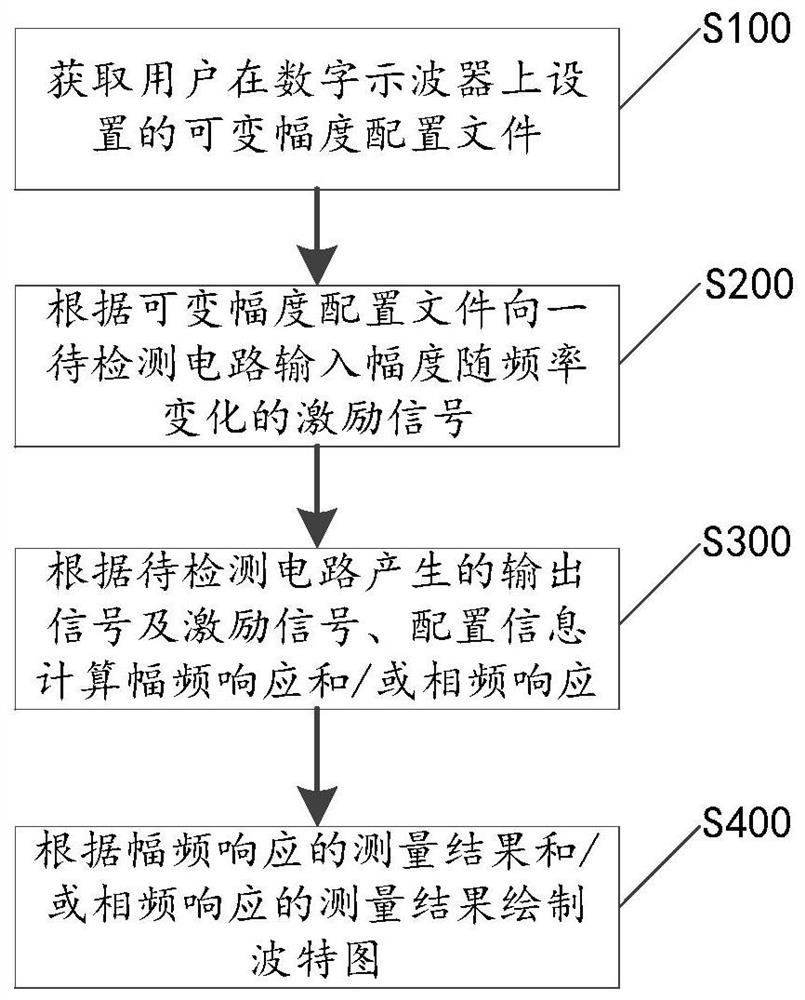
[0050] Please refer to figure 2 , on the basis of the digital oscilloscope disclosed in Embodiment 1, the present application also discloses a method for supporting Bode diagram variable amplitude scanning, which includes steps S100-S400. Instructions are given below.

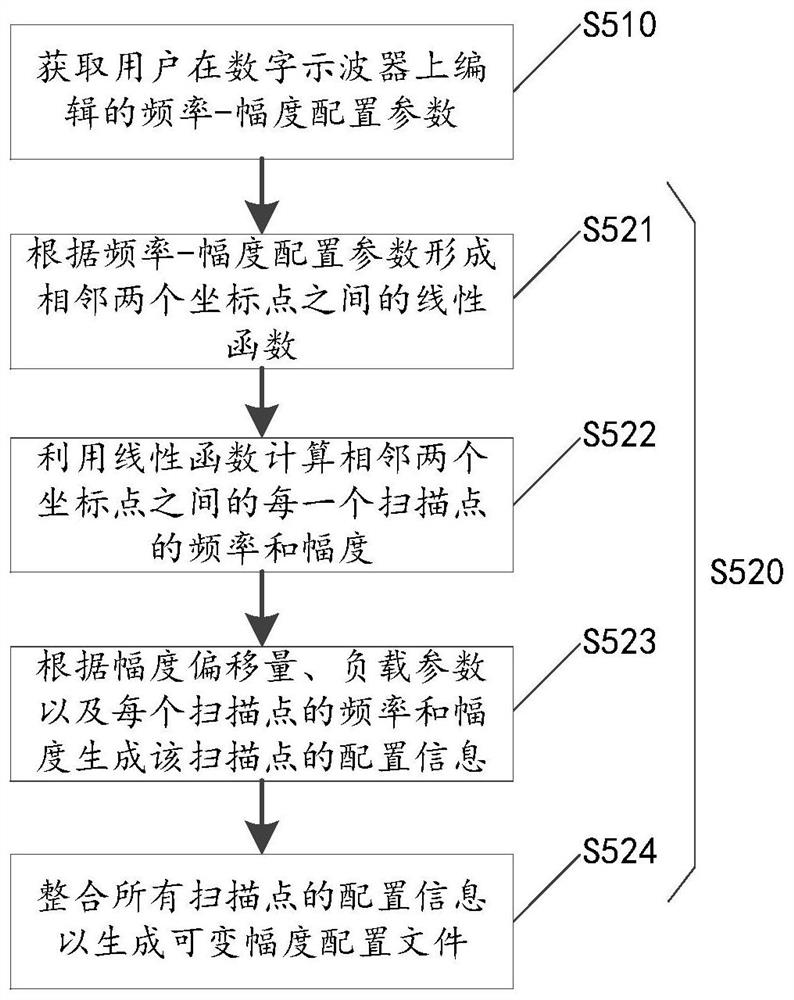
[0051] In step S100, the processor 12 obtains a variable amplitude configuration file set by a user on a digital oscilloscope, and the variable amplitude configuration file includes multiple sets of configuration information. In this example, see image 3 , the setting process of the variable amplitude configuration file may include steps S510-S520, which are respectively described as follows.

[0052] Step S510, acquiring frequency-amplitude configuration parameters edited by the user on the digital oscilloscope, where the frequency-amplitude configuration parameters include multiple frequencies and amplitudes corresponding to each frequency.

[0053] Step S520, according to the preset scan mode, the numbe...


PUM


Abstract

A method and digital oscilloscope supporting variable-amplitude scanning of Bode plots, comprising: acquiring a variable-amplitude configuration file set by a user on the digital oscilloscope; controlling a signal source to sequentially generate each group of Configure a section of excitation signal corresponding to the information to input an excitation signal whose amplitude varies with frequency to a circuit to be detected; obtain an output signal generated by the circuit to be detected in response to the excitation signal, and calculate the amplitude according to the output signal, excitation signal and configuration information The measurement results of the frequency response and / or the measurement results of the phase-frequency response; draw a Bode plot based on the measurement results of the magnitude-frequency response and / or the measurement results of the phase-frequency response. This application not only provides the setting method of the variable amplitude configuration file, but also provides the method of generating the scanning amplitude of different frequency points, and uses the variable amplitude scanning form to measure the circuit to be detected, which can meet the needs of technicians for the measurement of special circuits and the Bode Analysis of graph properties.

Description

technical field [0001] The invention relates to the technical field of signal measurement, in particular to a method and a digital oscilloscope supporting variable-amplitude scanning of Bode plots. Background technique [0002] In the field of signal measurement technology, the oscilloscope has been widely used. It can convert invisible electrical signals into visible images, which is convenient for people to study the changing process of various electrical phenomena. The Bode diagram is a commonly used diagram in electronic engineering to describe the frequency response of the system, which expresses the relationship between the input and output gain, phase and frequency of the system. There are many ways to draw a Bode plot, and the commonly used method is to complete the drawing with the help of an oscilloscope and a signal source. [0003] Old-fashioned analog oscilloscopes do not have an automatic measurement function, and drawing a Bode diagram can only be read point ...

Claims


Application Information

Patent Timeline
Patent Type & Authority Patents(China)
IPC IPC(8): G01R13/02
CPCG01R13/02G01R13/0218G01R13/029
Inventor 李富伟蒋宇辰宋民
Owner SHENZHEN CITY SIGLENT TECH
Learn More