A kind of soil testing formula fertilization method for vegetables
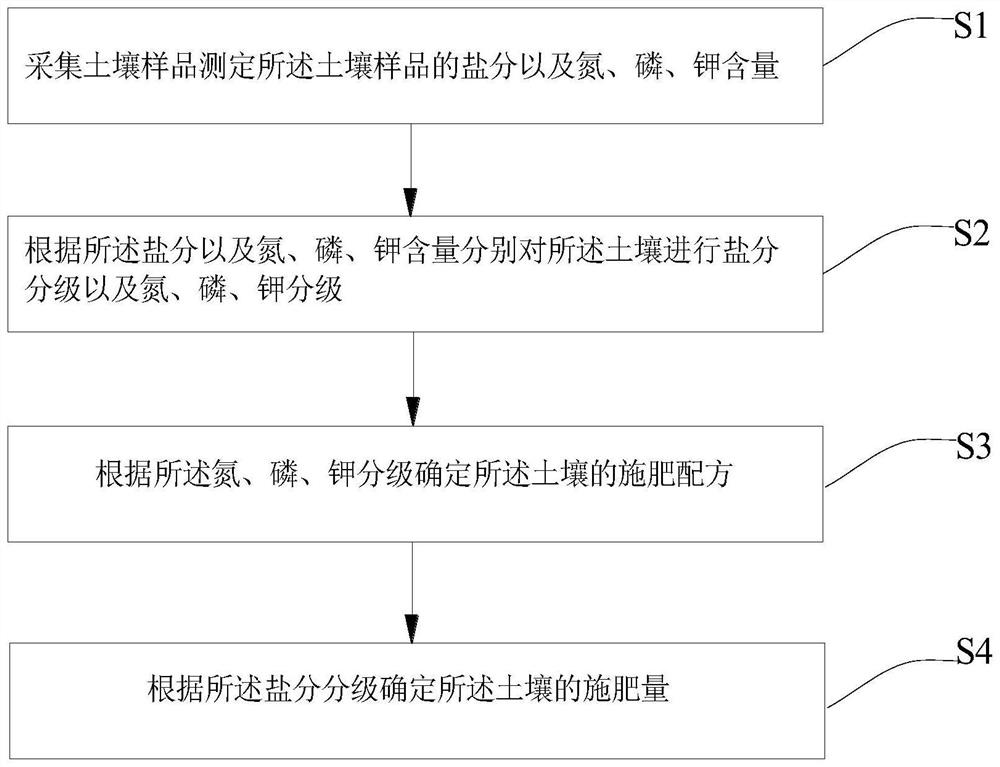
A soil-testing formula fertilization and vegetable technology, applied in the field of vegetable cultivation, can solve the problems of complicated operation, inconvenient operation for farmers, weak pertinence, etc., and achieve the effects of promoting balanced absorption, avoiding blind fertilization, and reducing dosage.
- Summary
- Abstract
- Description
- Claims
- Application Information
AI Technical Summary
Problems solved by technology
Method used
Image
Examples
Embodiment 1
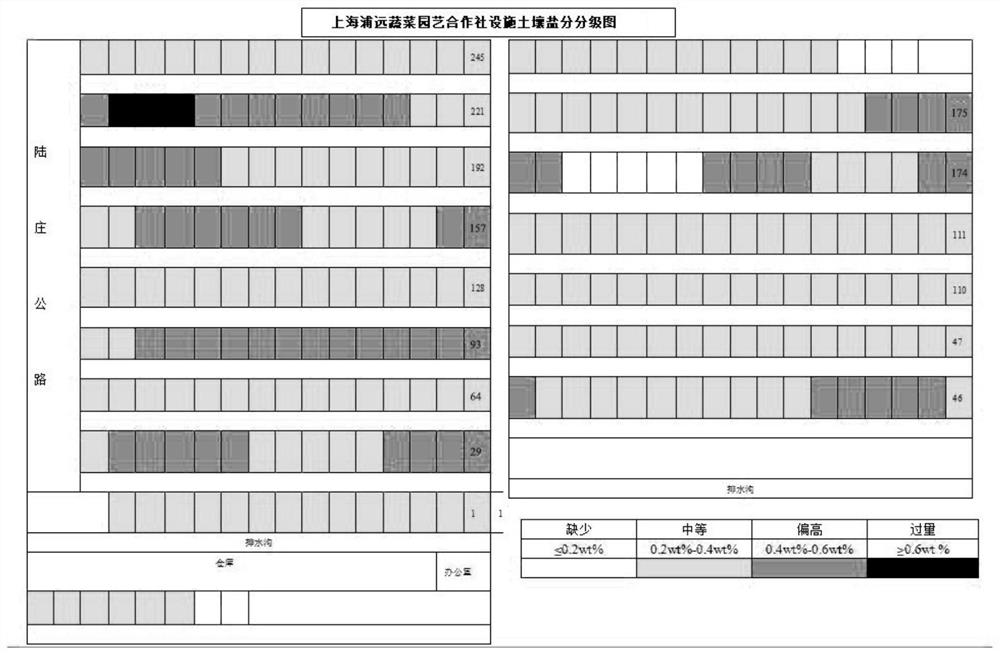
[0050] The sampling location in this example is Puyuan Vegetable Gardening Cooperative (Huangqiao Base), Songjiang District, Shanghai. There are 300 greenhouses in the base, and the vegetables grown are mainly green vegetables such as green cabbage, chrysanthemum and lettuce. Divide the sampling units according to the crop and the age of the shed, and collect 60 soil samples in total, and measure and classify the salinity (main index), alkaline hydrolyzable nitrogen, available phosphorus, and available potassium (auxiliary index) of the soil samples. The classification results are shown in the table. 2, and draw a soil salinity grading map according to the salt content in the soil samples. On the cooperative plan, yellow, green, orange, and red are used to represent the lack, medium, high, and excess field units. In this example, the soil The schematic diagram of the salt classification diagram is as follows: figure 2 shown.
[0051] It can be seen from Table 2 that accordin...
Embodiment 2
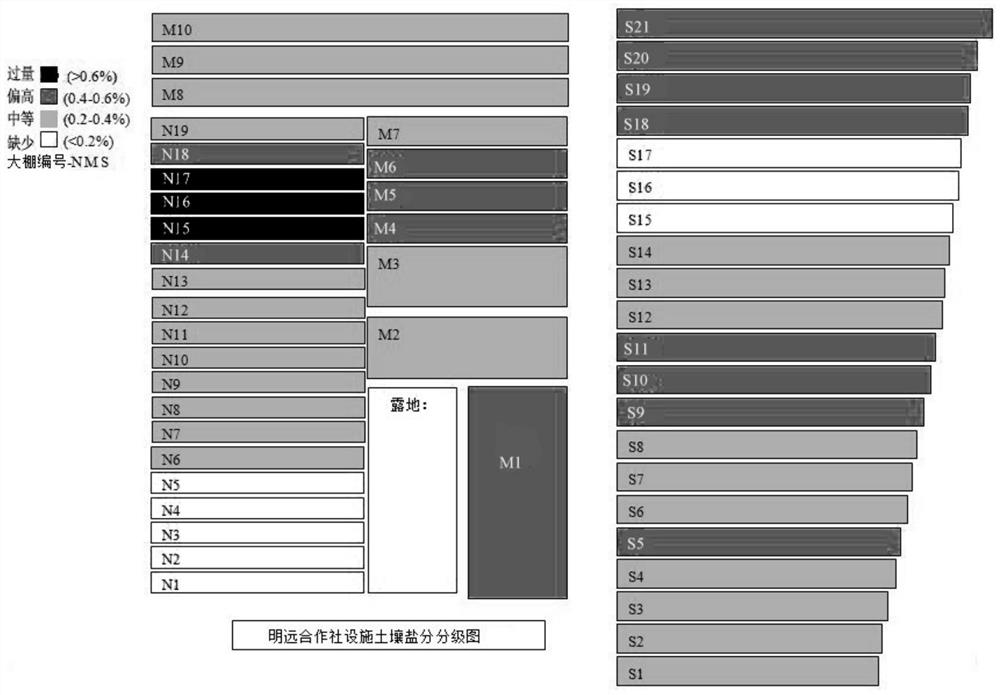
[0059] The sampling location in this example is the vegetable area of Shanghai Mingyuan Cooperative. There are more than 50 greenhouses in the area, and the vegetables grown are mainly tomato, cucumber and other solanaceous vegetables. Divide the sampling units according to the crop and the age of the shed, and collect 30 soil samples in total. The salinity (main index), alkali-hydrolyzed nitrogen, available phosphorus, and available potassium (auxiliary index) of the soil samples are measured and graded. The classification results are shown in Table 5. The soil salinity grading map is drawn according to the measured salinity content in the soil samples. On the cooperative plan, yellow, green, orange, and red are used to represent the lack, medium, high, and excess field units, respectively. This example The schematic diagram of the soil salinity grading map is as follows image 3 shown.
[0060] As can be seen from Table 5, according to the survey results of the background...
PUM
 Abstract
Description
Claims
Application Information
 - R&D
- Intellectual Property
- Life Sciences
- Materials
- Tech Scout
- Unparalleled Data Quality
- Higher Quality Content
- 60% Fewer Hallucinations
Browse by: Latest US Patents, China's latest patents, Technical Efficacy Thesaurus, Application Domain, Technology Topic, Popular Technical Reports.
© 2025 PatSnap. All rights reserved.Legal|Privacy policy|Modern Slavery Act Transparency Statement|Sitemap|About US| Contact US: help@patsnap.com


