Wind generating set wind power curve optimization calculation and abnormal value detection method

A technology for wind turbines and optimization calculation, applied in the directions of calculation, computer-aided design, design optimization/simulation, etc., can solve the problem that the wind power curve deviates from the wind power curve of the unit, the normal data of the wind turbine has a high proportion, and the distribution of abnormal values ​​of the unit is lacking. situation analysis and other issues, to achieve the effect of improving generalization ability and simple calculation of Cp value features

Pending Publication Date: 2021-04-02
徐工汉云技术股份有限公司
View PDF9 Cites 5 Cited by
  • Summary
  • Abstract
  • Description
  • Claims
  • Application Information

AI Technical Summary

Problems solved by technology

[0004] However, the improved method relies on the high proportion of normal data in the fan data, or assumes that the unit is within the design range most of the time, when the abnormal data of the unit has a high proportion, or is in an abnormal state when it is put into operation, this type of method can be fitted. The wind power curve of the wind power curve will deviate from the real wind power curve of the unit, and there is a lack of analysis of the distribution of the abnormal value of the unit

Method used


Image

  • Wind generating set wind power curve optimization calculation and abnormal value detection method
  • Wind generating set wind power curve optimization calculation and abnormal value detection method
  • Wind generating set wind power curve optimization calculation and abnormal value detection method

Examples


Embodiment Construction

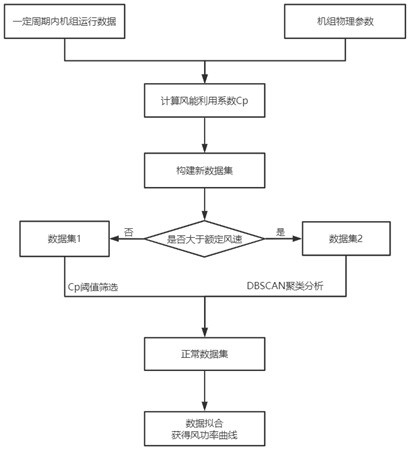
[0034] like figure 1 , figure 2 and image 3 As shown, this example provides a wind power generator wind power curve optimization calculation and abnormal value detection method, including the following steps:

[0035] S1: Collect the operation data of the wind power generation unit within one cycle to obtain the original collection data. The data in this example comes from the real operation data of a wind farm;

[0036] S2: Calculate the wind energy utilization coefficient Cp according to the diameter of the wind rotor and the air density;

[0037] S3: Splicing the Cp value into the original data to construct a new data set A;

[0038] S4: Set the rated wind speed, and classify the data whose wind speed is lower than the rated wind speed in data set A into data set B, and the rest of the data into data set C;

[0039] S5: Set the Cp threshold, perform Cp threshold screening on the data in the data set B, mark the data within the threshold range as normal data, and mark ...


PUM


Abstract

The invention discloses a wind generating set wind power curve calculation method. The method mainly comprises the following steps: acquiring operation data of the wind generating set in a certain period; acquiring wind turbine diameter physical parameters of the wind generating set and air density of an object wind field; calculating a wind energy utilization coefficient Cp of the unit at the corresponding time based on the operation data of the wind generating set, the wind wheel diameter and the air density; splicing the unit operation data and the Cp value to form a new data set; dividingthe new data set based on the wind speed rated value, and performing abnormal value calibration on the divided data by using a CP threshold determination method and a DBSCAN algorithm; and calculatinga data set after category marking to obtain an actual operation wind power curve and an abnormal value distribution condition of the unit.

Description

technical field [0001] The invention relates to the field of wind power generation data analysis, in particular to a wind power curve calculation and abnormal value detection method of a wind power generating set. Background technique [0002] The wind power curve of a wind turbine is one of the important indicators to measure the output performance of a wind turbine. The wind power curve is an approximate curve fitted with wind speed as the abscissa and power as the ordinate. Adopting a suitable fitting method plays an important role in accurately evaluating the output performance of the unit. [0003] At present, the wind power curve fitting method of the wind power generating set is mainly completed based on the SCADA data of the generating set. The fitting method is mainly to divide the SCADA data into intervals according to the wind speed, then calculate the mean value of power in each interval, and finally combine the wind speed and mean value of power to fit the act...

Claims


Application Information

Patent Timeline
Patent Type & Authority Applications(China)
IPC IPC(8): G06Q50/06G06F30/20G06F113/06
CPCG06Q50/06G06F30/20G06F2113/06Y02E10/72
Inventor 李家伟张启亮姜丽萍曹洁生
Owner 徐工汉云技术股份有限公司
Why Eureka
Try Eureka