Eureka AIR delivers breakthrough ideas for toughest innovation challenges, trusted by R&D personnel around the world.

Laser-induced breakdown spectroscopy concentration extraction method for online monitoring of trace gas impurities

A technology of laser-induced breakdown and trace gas, which is applied in the field of atomic emission spectrometry, can solve the problems of reducing real-time analysis characteristics, large data volume, and high calculation cost, and achieves benefits for real-time output, reduced calculation cost, and avoids complex calculations Effect

Pending Publication Date: 2021-04-23
SOUTHWEST JIAOTONG UNIV
View PDF10 Cites 1 Cited by
  • Summary
  • Abstract
  • Description
  • Claims
  • Application Information

AI Technical Summary

Problems solved by technology

Affected by factors such as the matrix characteristics of solid samples, the element calibration using LIBS technology is mainly based on the comprehensive application of multivariate statistical regression technology. Therefore, a large amount of data is required, and the calculation cost is high, which reduces its real-time analysis characteristics to a certain extent.

Method used

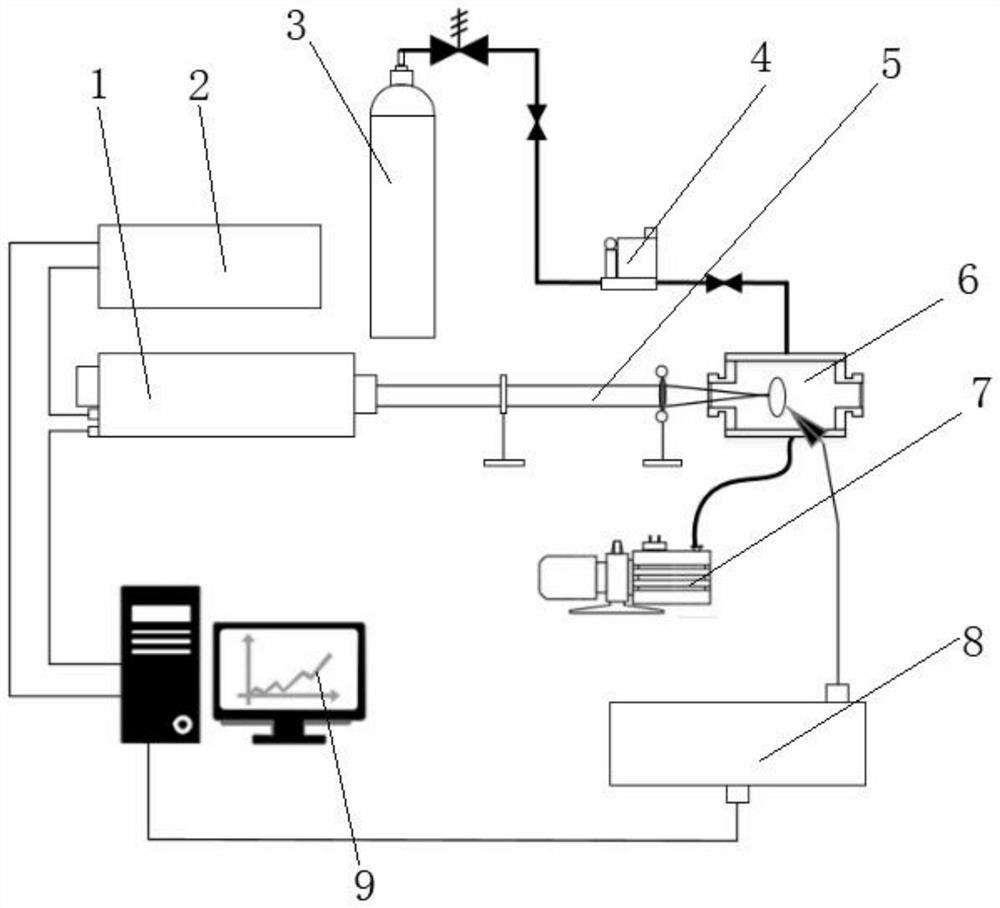
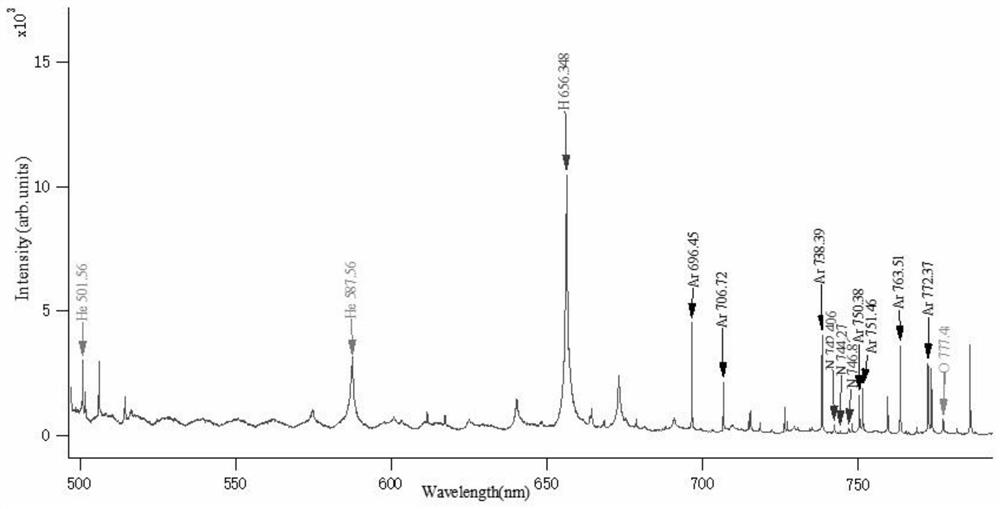
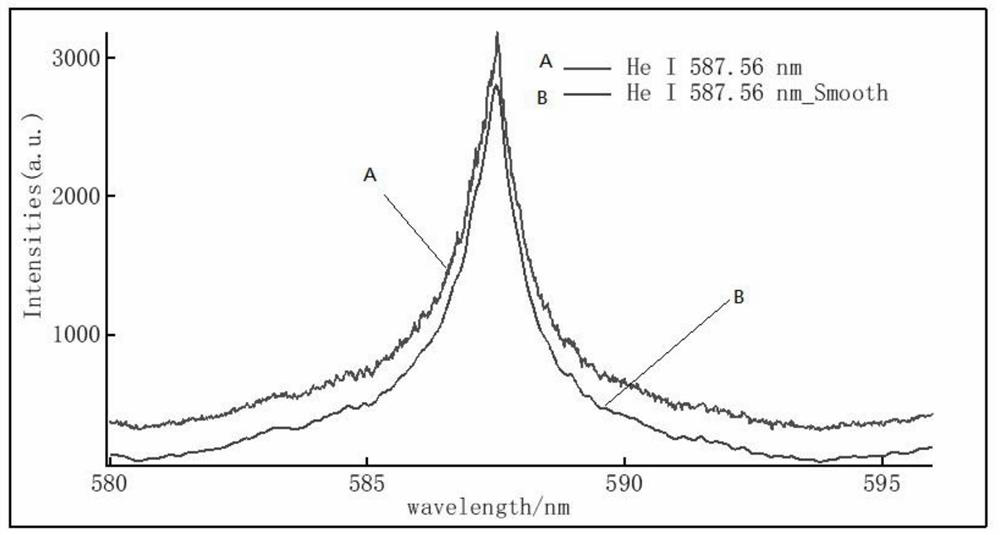

Image

  • Laser-induced breakdown spectroscopy concentration extraction method for online monitoring of trace gas impurities
  • Laser-induced breakdown spectroscopy concentration extraction method for online monitoring of trace gas impurities
  • Laser-induced breakdown spectroscopy concentration extraction method for online monitoring of trace gas impurities

Examples


Embodiment 1

[0078] A laser-induced breakdown spectrum concentration extraction method for online monitoring of trace gas impurities, including laser-induced breakdown spectrum data collection, spectral preprocessing and characteristic peak intensity extraction, establishment of a special database for element characteristic lines, and element assignment of characteristic lines Identification, single-line calibration modeling and optimization, and rapid extraction and real-time output of concentration information for online monitoring of trace gas impurities involve the following steps:

[0079] 1) Collect spectral data to form a spectral data set;

[0080] 2) Preprocessing the spectral data set to extract element characteristic peak wavelengths and peak intensities;

[0081] 3) Establish a special database for elemental spectral lines;

[0082] 4) Match and calculate the wavelength information of the characteristic spectral lines with the special database of element spectral lines to confir...

Embodiment 2

[0086] This embodiment is further optimized on the basis of Embodiment 1. For better realization of the present invention, the following setting methods are especially adopted: said step 1) specifically includes the following steps:

[0087] 1.1) Use the laser-induced breakdown spectroscopy analysis system to continuously excite the gas component samples in the pipeline with pulsed laser, and collect the accumulated data of the plasma spectrum under the action of continuous pulsed laser;

[0088] 1.2) The collected spectral data are randomly and evenly divided into three groups, one group is used as a training set, the other group is used as a verification set, and the third group is a test set; wherein the training set data contains the spectral data of the target element in the maximum concentration range ; The validation set data and test set data are independent of the training set data.

Embodiment 3

[0090] This embodiment is further optimized on the basis of any of the above-mentioned embodiments. In order to better realize the present invention, the following setting methods are adopted in particular: the step 2) includes the following specific steps:

[0091] 2.1) Perform noise preprocessing on the training set, verification set and test set spectral data respectively;

[0092] 2.2) The noise filtering process adopts the BOX_ave function of the piecewise quasi-Gaussian fitting function, and the formula (1) is the BOX_ave function:

[0093] in:

[0094] 2.3) After step 2.2), further derivation preprocessing is performed on the data after the noise filtering of the training set, verification set and test set;

[0095] 2.4) Derivation preprocessing includes primary derivation and secondary derivation in turn, the functions used are formula (2-1) and formula (2-2), and formula (2) is the dev function;

[0096] 2.5) extraction step 2.4) after derivation element characteris...


PUM


Abstract

A laser-induced breakdown spectral concentration extraction method for online monitoring of trace gas impurities comprises the following steps: 1) collecting spectral data to form a spectral data set; 2) carrying out data preprocessing to obtain a characteristic spectral line wavelength and a peak intensity value of a target element; 3) establishing a target element characteristic spectral line special database; 4) carrying out matching calculation on the element characteristic spectral line wavelength and a database, and confirming element attribution information of the characteristic spectral line; 5) establishing an element calibration model; and 6) applying the characteristic peak intensity value as an input set to the element calibration model to realize rapid calibration and real-time output of the concentration of the target element, which is different from a multivariable statistical regression technical means, and jointly applying two advantageous technologies of segmented average smooth spectrum noise filtering and derivation peak searching. The spectral background can be fully corrected while the original spectral characteristic variable information is reserved to the maximum extent, and the wavelength and the net peak high-intensity value of the element characteristic peak can be quickly calculated and obtained.

Description

technical field [0001] The invention relates to the technical field of atomic emission spectroscopic analysis, in particular to a laser-induced breakdown spectral concentration extraction method for on-line monitoring of trace gas impurities. Background technique [0002] Hydrogen production by electrolysis of water is an important way to produce hydrogen in the development and utilization of new energy. As the main fuel for fuel engines and fuel cells, the purity of hydrogen is crucial to the operating performance of fuel engines, the efficiency of fuel cells, and the long-term maintenance of electrode activity. The stored hydrogen will be polluted by trace impurity components such as N2, O2 and Ar introduced from air leakage or hydrogen production process before use. Timely and accurate monitoring of the purity of hydrogen in storage tanks and pipelines is a necessary prerequisite to ensure the efficient use of hydrogen energy. [0003] In the development and utilization...

Claims


Application Information

Patent Timeline
Patent Type & Authority Applications(China)
IPC IPC(8): G16C20/20G16C20/90G01N21/71
CPCG16C20/20G16C20/90G01N21/718
Inventor 柯川赵勇
Owner SOUTHWEST JIAOTONG UNIV
Why Eureka
Eureka Blog
Learn More