Device and method for diagnostic testing of COVID-19, viruses, antibodies and markers
A biodetector, bioassay technology, applied in biochemical equipment and methods, chemical instruments and methods, and microbial determination/inspection, etc., can solve the problems of analysis delay, low sensitivity, etc.
- Summary
- Abstract
- Description
- Claims
- Application Information
AI Technical Summary
Problems solved by technology
Method used
Image

Examples
Embodiment Construction
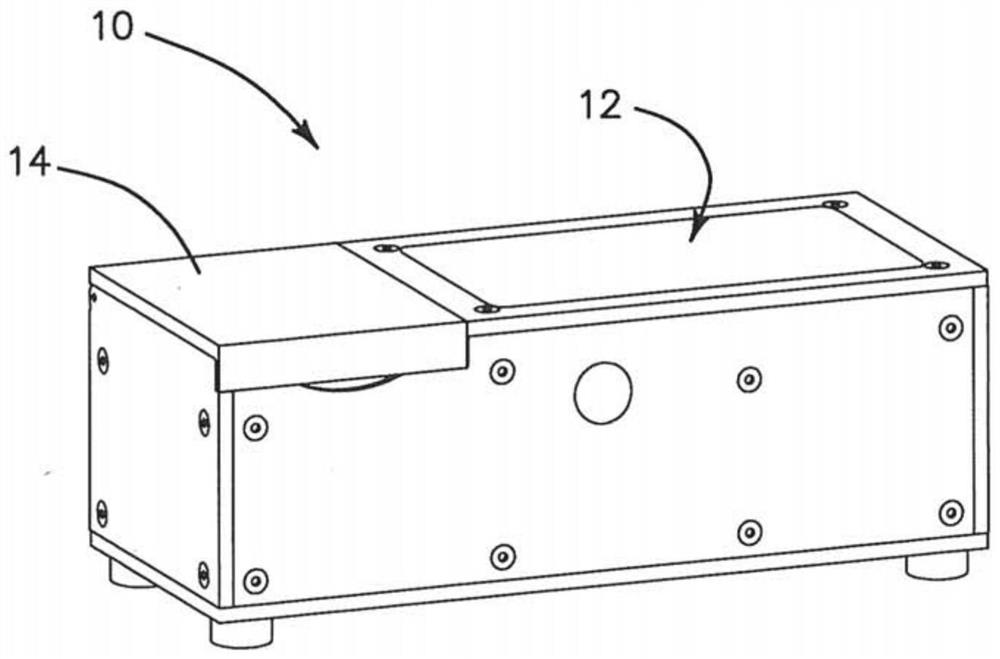
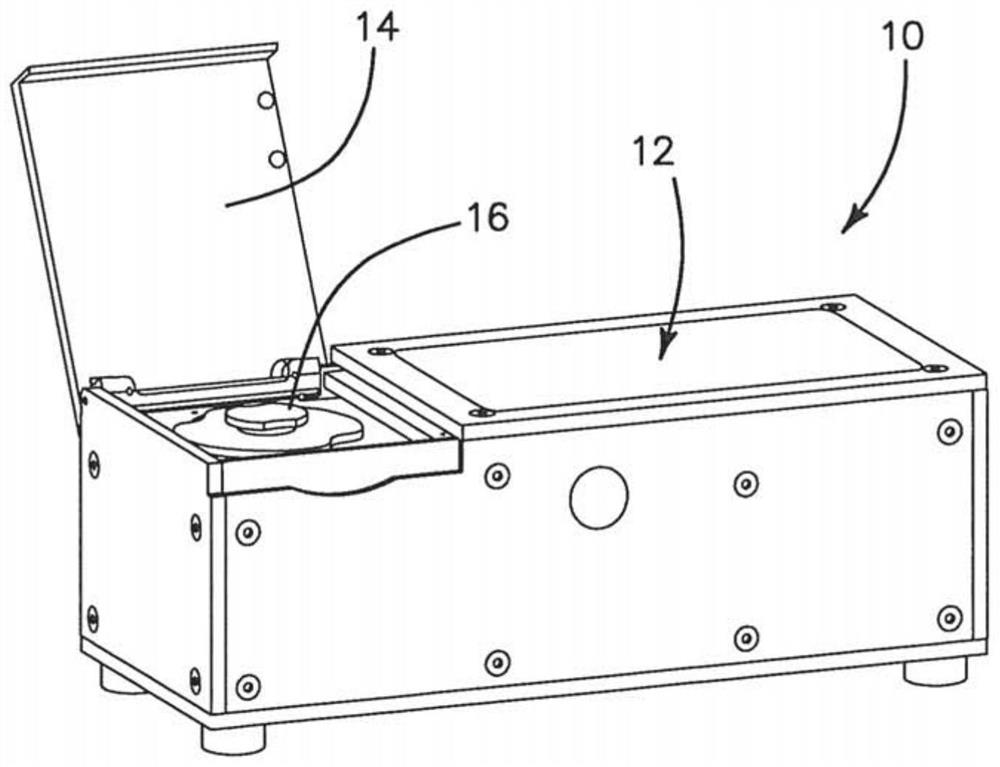
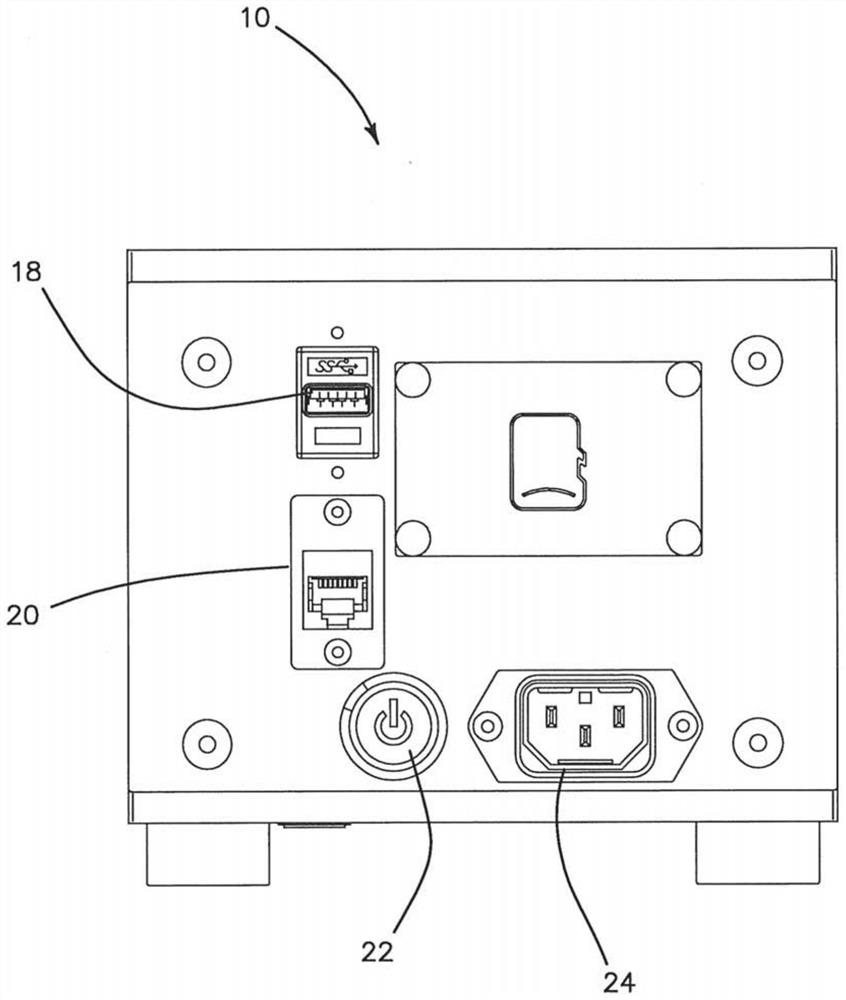
[0106] The device of the illustrated embodiment includes a central unit that includes electronic components, cameras, optical components, digital data collection components, and communication components to communicate with a cloud-based expert diagnostic server via the Internet, and to provide information on Covid-19 and other viruses or Electromechanical components required for on-site portable diagnostic testing of bacterial infections. The same hub unit supports at least three different microfluidic discs 68 (CD) for diagnostic assays or detection, i.e., microarrays for antibodies such as IgG and IgM for virological detection using surface acoustic wave (SAW) detectors Serological detectors, as well as RT-PCR assays for nucleic acid targets using fluorescent detectors, are designated by Autonomous Medical Devices Inc. as detectors A10, A20, and A30 CD, respectively. The unit and its corresponding CD are measuring or assaying devices that do not perform high-level diagnostic...
PUM
 Abstract
Description
Claims
Application Information