Analysis method for quantifying physiological state of human body and equipment thereof
An analysis method, a technology of human physiology, applied in the directions of diagnostic recording/measurement, medical science, diagnosis, etc., can solve the problems of complex pathological guardians, large individual differences between people, etc., and achieve the effect of avoiding large differences
- Summary
- Abstract
- Description
- Claims
- Application Information
AI Technical Summary
Problems solved by technology
Method used
Image
Examples
Embodiment 1
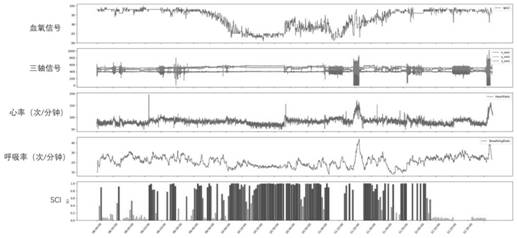
[0143] Figure 5a It is a picture of the simulated plateau hypoxic experiment results of a tester, which implements the first method. The blood oxygen signal added in the picture is to better observe the hypoxic environment in which the tester is located.
[0144] At the beginning of the experiment, the tester is still at a normal altitude, and the current state vector is V in =[73.2602, 25.0000], after similarity comparison, take out 15 vectors from G to form matrix D:
[0145] heart rate respiration rate 73.2602 25 73.7101 25 72.3765 25 74.4417 25 74.4417 25 72.0289 25 71.8572 25 71.8564 25 71.6847 25 71.3445 25 75.2824 25 73.3496 26 70.9220 25 72.9931 24 73.6206 26
[0146] The final calculated optimal estimate V est =[73.9942, 25.0637],
[0147] Difference V re = [0.3160, 0.0637], calculate V re in G re distributed The SCI index in is 0.1584, and the deviation from the state ...
Embodiment 2
[0152] Figure 5b It is a picture of the simulated plateau hypoxia experiment results of a test subject, in which Figure 5b The implementation is the second method. The blood oxygen signal added in the figure is to better observe the hypoxic environment in which the tester is located.
[0153] At the beginning of the experiment, the tester is still at a normal altitude, and the current state vector is V in =[68.1818, 22.0000], after similarity comparison, take out 15 vectors from G to form matrix D:
[0154] heart rate respiration rate 68.3766 22 67.7966 22 68.9655 22 67.2316 22 67.2274 22 69.1648 22 67.0391 22 67.0391 22 68.1818 23 68.1818 21 68.3766 23 65.9341 22 67.7966 21 67.7966 21 65.9341 22
[0155] The final calculated optimal estimate V est =[67.8312, 21.9314],
[0156] Difference V re = [0.3505, 0.0685], calculate V re in G re distributed The SCI index in is 0.0397, a...
Embodiment 3
[0161] Image 6 A case of rescue of a patient with sudden severe atrial fibrillation. Image 6 The implementation of the method is the third method. Select the physiological data of a day when the patient is in a relatively stable state to construct a physiological state vector library G, Image 6 Middle (a) is the data of a certain morning when the vital signs are stable after rescue treatment, such as around 08:52 in the morning, the current state vector is: V in =[51.2820, 22], after similarity comparison, take out 15 vectors from G to form matrix D:
[0162] heart rate Breathing rate 51.3921 22 51.3921 22 51.3921 22 51.0638 22 51.0638 22 50.9556 22 50.8475 22 51.7241 22 50.6329 22 51.2821 21 52.0610 22 50.4202 22 50.4202 22 51.1729 23 52.1739 23
[0163] The final calculated optimal estimated value V est =[51, 2051, 21.9986], the difference vector is: V re =[0.0769, 0.0014], cal...
PUM
 Abstract
Description
Claims
Application Information
 - R&D
- Intellectual Property
- Life Sciences
- Materials
- Tech Scout
- Unparalleled Data Quality
- Higher Quality Content
- 60% Fewer Hallucinations
Browse by: Latest US Patents, China's latest patents, Technical Efficacy Thesaurus, Application Domain, Technology Topic, Popular Technical Reports.
© 2025 PatSnap. All rights reserved.Legal|Privacy policy|Modern Slavery Act Transparency Statement|Sitemap|About US| Contact US: help@patsnap.com


