

Dynamic visualization method and system for regional carbon emission
A carbon emission and regional technology, applied in the field of dynamic visualization method and system of regional carbon emission
- Summary
- Abstract
- Description
- Claims
- Application Information
AI Technical Summary
Problems solved by technology
Method used
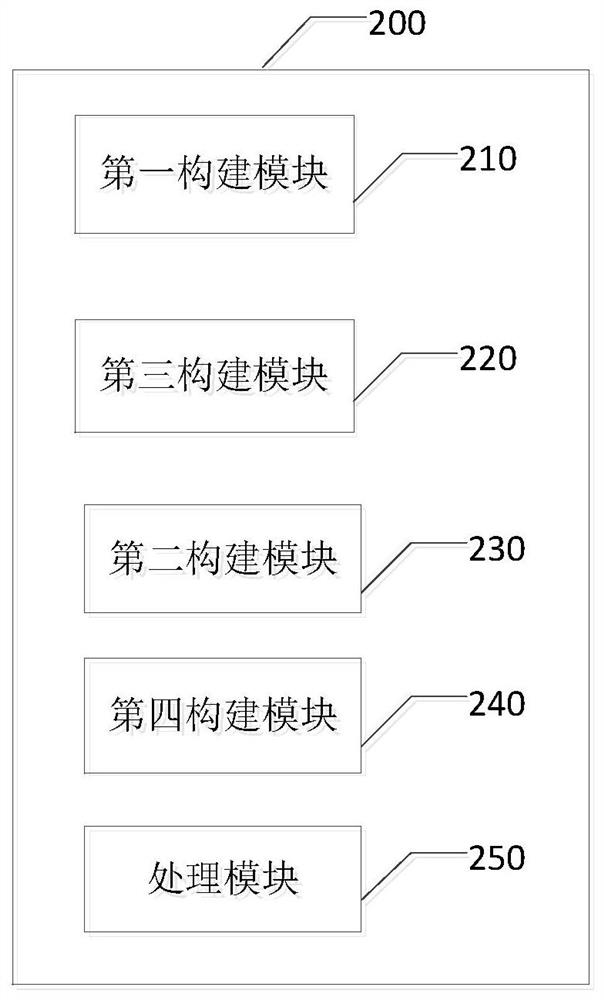
Image

Examples
Embodiment Construction
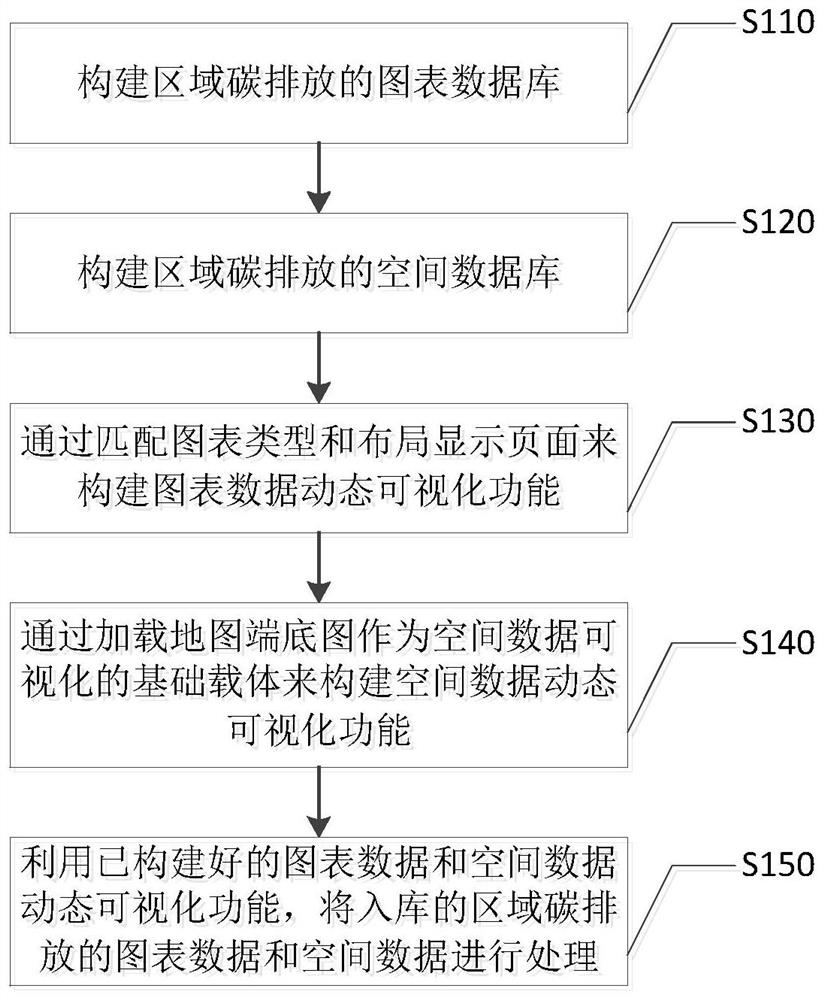
[0025] In order to make the object, technical solution and advantages of the present invention clearer, the present invention will be further described in detail below in conjunction with specific embodiments and with reference to the accompanying drawings.
[0026] figure 1 A flow chart of a dynamic visualization method for regional carbon emissions according to an embodiment of the present invention is schematically shown.
[0027] Such as figure 1 As shown, the dynamic visualization method for regional carbon emissions according to the embodiment of the present invention includes steps S110-S150.
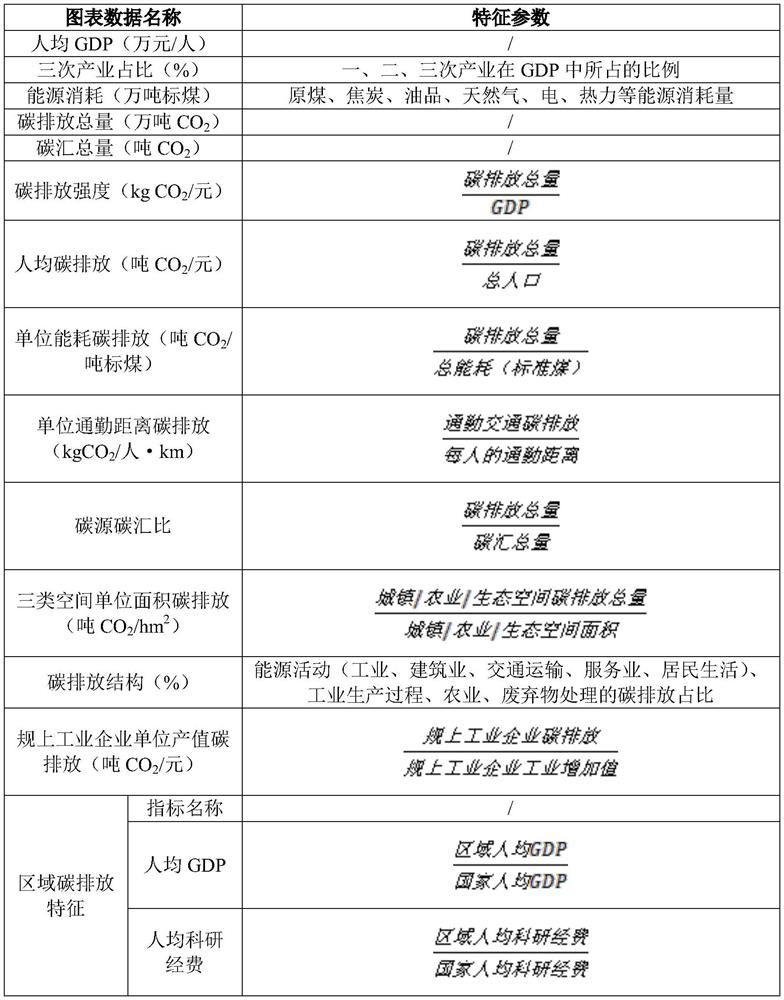
[0028] Step S110, constructing a graph database of regional carbon emissions, wherein the graph database includes graph data of regional socio-economic development and graph data of regional carbon emissions.
[0029] The chart data of the above-mentioned regional social and economic development include but not limited to such as economy (GDP, per capita GDP), industry (the pro...
PUM
 Abstract
Description
Claims
Application Information