Electromagnetic frequency spectrum visualization analysis method based on spatio-temporal integrated digital earth

A digital earth and analysis method technology, applied in the field of information processing, can solve the problems of less research on the multi-dimensional characteristics of signals, and the inability to objectively reflect the spatial distribution of regional signals, spatial energy distribution, errors, etc.

Pending Publication Date: 2022-02-01
成都戎星科技有限公司
View PDF0 Cites 7 Cited by
  • Summary
  • Abstract
  • Description
  • Claims
  • Application Information

AI Technical Summary

Problems solved by technology

[0002] The traditional spectrum situation research is mainly based on the two dimensions of time and frequency, that is, the spectrum usage is analyzed from the perspective of spectrum station congestion. The traditional spectrum situation has little research on the multi-dimensional characteristics of the signal. Its construction is mainly based on the signal propagation model, which is relatively different from the actual environment. Large error, cannot objectively reflect the spatial distribution and spatial energy distribution of signals in a specific area

Method used


Image

  • Electromagnetic frequency spectrum visualization analysis method based on spatio-temporal integrated digital earth
  • Electromagnetic frequency spectrum visualization analysis method based on spatio-temporal integrated digital earth

Examples


Embodiment 1

[0054] This embodiment proposes a method for visual analysis of the electromagnetic spectrum based on the integrated space-time digital earth, including the following steps:

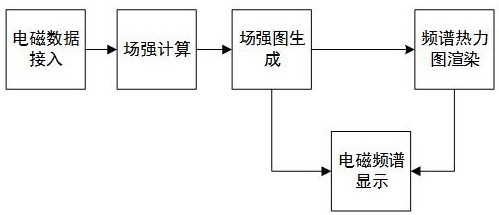
[0055] Step 1: Establish a signal receiving system and an electromagnetic spectrum visualization analysis system based on the space-time integrated digital earth; the electromagnetic spectrum visualization analysis system includes an electromagnetic data access module, a field strength calculation module, a field strength map generation module, and a spectrum thermal power module connected in sequence A map rendering module, an electromagnetic spectrum display module; the field strength map generation module is also connected to the electromagnetic spectrum display module;

[0056] Step 2: Use the signal receiving system to receive the electromagnetic signal monitoring data, and send it to the electromagnetic data access module, analyze the received electromagnetic signal monitoring data through the elect...

Embodiment 2

[0063] In this embodiment, on the basis of the above-mentioned embodiment 1, in order to better realize the present invention, further, in the step 2, after the electromagnetic data access module receives the electromagnetic signal detection data, it analyzes the analyzed electromagnetic signal parameters obtained The data includes the number, location, transmission frequency band, transmission power, antenna polarization mode and azimuth angle of electromagnetic radiation sources;

[0064] At the same time, the electromagnetic data access module will also be used to obtain the receiving antenna model parameters and the transmitting antenna model parameters;

[0065] The receiving antenna model parameters include receiving sensitivity, noise temperature, equivalent noise bandwidth, noise figure, signal-to-noise ratio, receiving antenna beam width, receiving antenna beam pointing, receiving antenna gain, and receiving antenna pattern;

[0066] The transmitting antenna model par...

Embodiment 3

[0071] In this embodiment, on the basis of any one of the above-mentioned embodiments 1-2, in order to better realize the present invention, further, the step 3 specifically includes the following steps:

[0072] Step 3.1: Read the receiving antenna model parameters;

[0073] Step 3.2: Read the transmitting antenna model parameters;

[0074] Step 3.3: Set the output field strength dot matrix interval;

[0075] Step 3.4: Set and select the propagation model;

[0076] Step 3.5: Execute the field strength calculation task, according to the parameters and settings of steps 3.1-3.4, establish each discrete point in space, and calculate the electromagnetic field strength of each discrete point in space, and finally obtain the coordinates and field strength of each discrete point in the space area value.

[0077] Working principle: Use the obtained coordinates and field strength values ​​of each discrete point in the area to generate a field strength triangulation. The non-closed...


PUM


Abstract

The invention provides an electromagnetic frequency spectrum visualization analysis method based on a spatio-temporal integrated digital earth. The method comprises the steps that: signal monitoring data is accessed from a signal receiving system by using an electromagnetic data access module; a field intensity calculation module calculates the electromagnetic field intensity of each discrete point; a field intensity diagram generation module constructs a field intensity equivalent region by using the electromagnetic field intensity values of the discrete points, and generates an electromagnetic field intensity diagram through rendering; a frequency spectrum thermodynamic diagram rendering module performs visual rendering according to frequency spectrum behaviors such as occurrence time, duration time, frequency and power of signals to generate a frequency spectrum thermodynamic diagram; and an electromagnetic frequency spectrum display module performs spatio-temporal integrated display on the electromagnetic field intensity diagram and the spectrum thermodynamic diagram based on the three-dimensional digital earth. According to the method, construction based on the space and energy frequency spectrum situation can be achieved based on the operation, visual analysis is conducted on signal space distribution and space energy distribution based on the spatio-temporal integrated digital earth, and the space distribution and space energy distribution situation of signals in a specific area can be objectively reflected.

Description

technical field [0001] The invention belongs to the technical field of information processing, and in particular relates to an electromagnetic spectrum visualization analysis method based on a time-space integrated digital earth. Background technique [0002] The traditional spectrum situation research is mainly based on the two dimensions of time and frequency, that is, the spectrum usage is analyzed from the perspective of spectrum station congestion. The traditional spectrum situation has little research on the multi-dimensional characteristics of the signal. Its construction is mainly based on the signal propagation model, which is relatively different from the actual environment. Large errors cannot objectively reflect the spatial distribution and spatial energy distribution of signals in a specific area. Contents of the invention [0003] Aiming at the above-mentioned defects of the prior art, the present invention proposes an electromagnetic spectrum visualization a...

Claims


Application Information

Patent Timeline
Patent Type & Authority Applications(China)
IPC IPC(8): G06F30/12G06T15/00G06T17/05G06T17/20G06K9/62
CPCG06F30/12G06T17/05G06T17/20G06T15/005G06T2200/04G06F18/2135
Inventor 张海堂姚慰周康燕曾理汪峰任浩肖剑峰
Owner 成都戎星科技有限公司
Why Eureka
Try Eureka