Human body efficacy quantitative evaluation method for blue light protection and application of human body efficacy quantitative evaluation method
A quantitative evaluation, blue light technology, applied in the field of technical cosmetics skin science, can solve the problems of lack of blue light protection efficacy evaluation methods, and achieve the effect of intuitive evaluation methods
- Summary
- Abstract
- Description
- Claims
- Application Information
AI Technical Summary
Problems solved by technology
Method used
Image

Examples
Embodiment 1
[0084] This embodiment provides a quantitative evaluation method for human body efficacy of blue light protection.
[0085] The blue light source is: the relative proportion of 400-700nm is not less than 50%, and the wavelength band less than 400nm is not higher than 2.5%.
[0086] Test samples (that is, protective samples): Sample 1 is the company's product protective cream (from the self-made sample of Shanghai Fudun Testing Technology Co., Ltd.).
[0087] The tester meets the following requirements:
[0088] (1) The number of testers is 35;
[0089] (2) Choose healthy volunteers aged 18 to 60, both male and female;
[0090] (3) No history of light-sensitive diseases in the past, and no drugs that affect light-sensitivity within 6 months before the test;
[0091] (4) The tester's skin type is above type III, among which there are no less than 5 people with type III and IV skin;
[0092] (5) The skin at the test site should be free from pigmentation, inflammation, scars, ...
Embodiment 2
[0110] In this embodiment, the tester is tested by the method of Example 1, and the specific data obtained are shown in Table 1.
[0111] Detector: data number F024, gender: male; age: 58 years old; skin type: III.
[0112] Table 1: Distribution of Delta M value of tester F024 at 5 time points between the uncoated sample group and the coated sample group
[0113]
[0114]
[0115] In Table 1, M is the melanin index; Delta M is the M difference between the test area and the standard area or the M difference between the control area and the standard area, indicating the change in the melanin index M.
[0116] Take Delta M as the Y axis and the number of days as the X axis to draw a graph, such as figure 1 As shown, and the slope is calculated by the calculation formula in Example 1, the slope K1 of the control area, that is, the unsmeared sample group, is 2.18; the slope of the test area, that is, the smeared sample group, is K2, which is 2.01. Calculate BPF = 2.18 / 2.01 ...
Embodiment 3
[0130] For sample 1 in Example 1, 35 testers (F001~F036, wherein the data of F027 was lost to follow-up) were tested, the data are shown in Table 5, the statistical description of the delta value of the product group and the control group every day, Table 5 includes Table 5.1, Table 5.2 and Table 5.3.
[0131] Table 5.1
[0132]
[0133]
[0134] Table 5.2
[0135]
[0136] Table 5.3
[0137]
[0138]
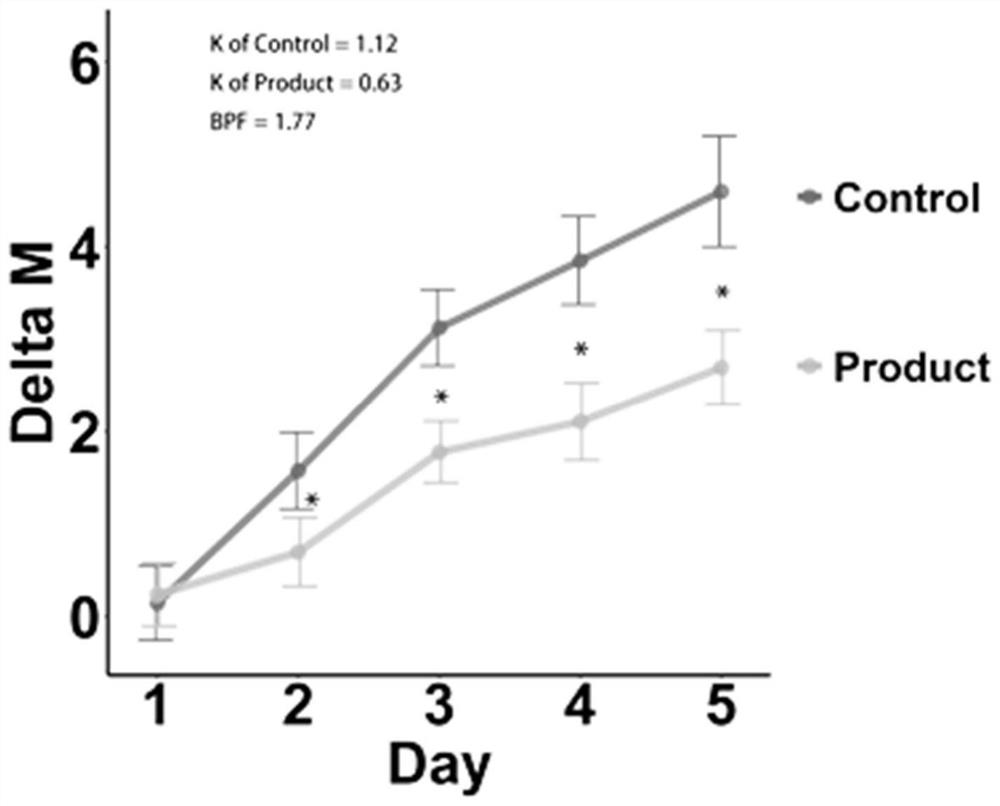
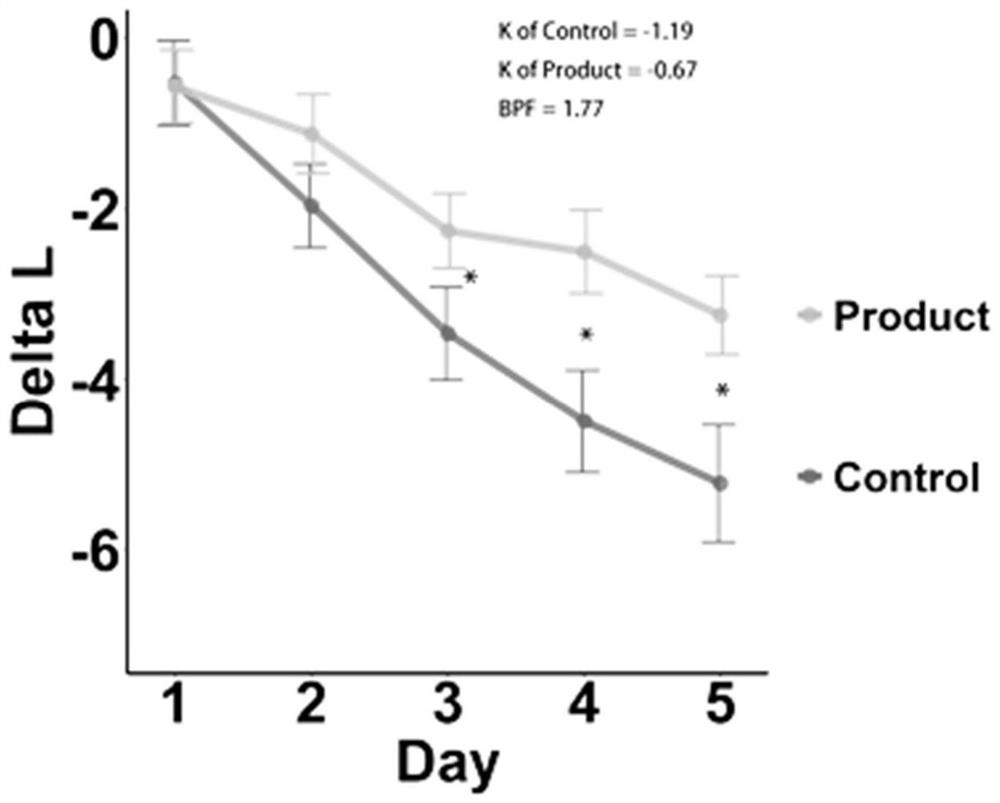
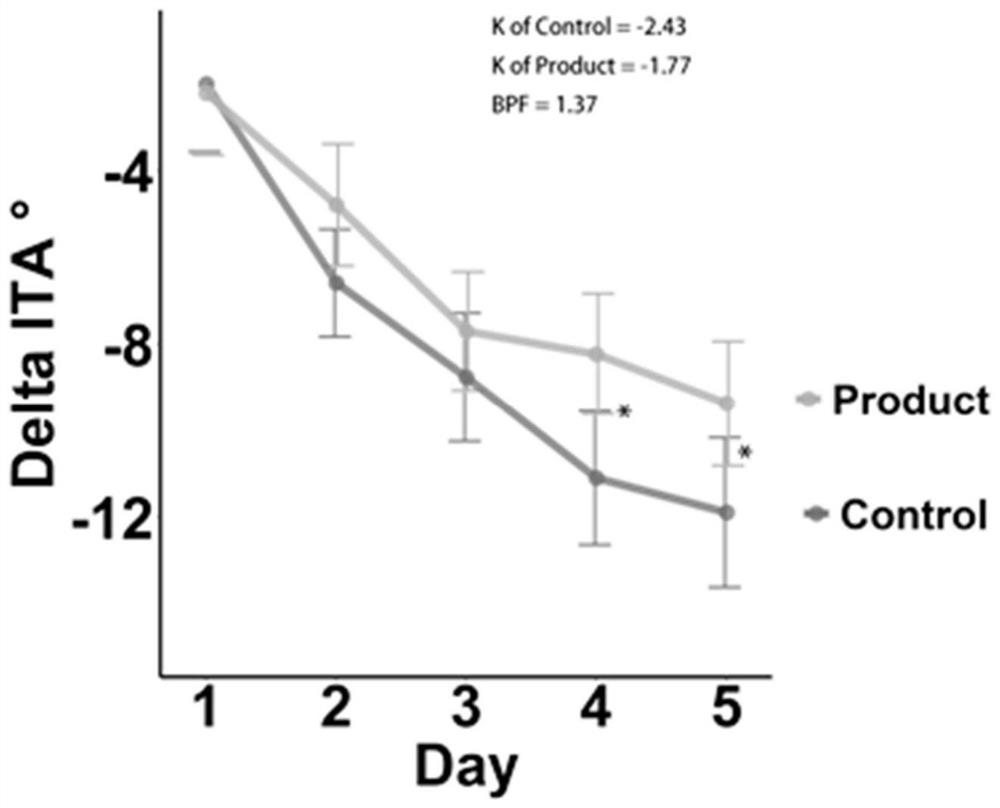
[0139] Fit the linear equation to the mean value and time in Table 5, and calculate the slope and BPF. The results are shown in Table 6. Table 6 shows the slope and BPF of the product group and the control group at the levels of delta M, delta L and delta ITA° .
[0140] Table 6
[0141] K Product control BPF Delta M 0.63 1.12 1.77 Delta L -0.67 -1.19 1.77 Delta ITA° -1.77 -2.43 1.37
[0142] In summary, the method of the present invention can effectively detect the blue light protection index of the protection samp...
PUM
 Abstract
Description
Claims
Application Information