Atmospheric temperature profile prediction method
A technology of atmospheric temperature and prediction method, which is applied in the direction of prediction, thermometer, application of thermometer, etc., and can solve the problem of low prediction accuracy
- Summary
- Abstract
- Description
- Claims
- Application Information
AI Technical Summary
Problems solved by technology
Method used
Image

Examples
Embodiment 1
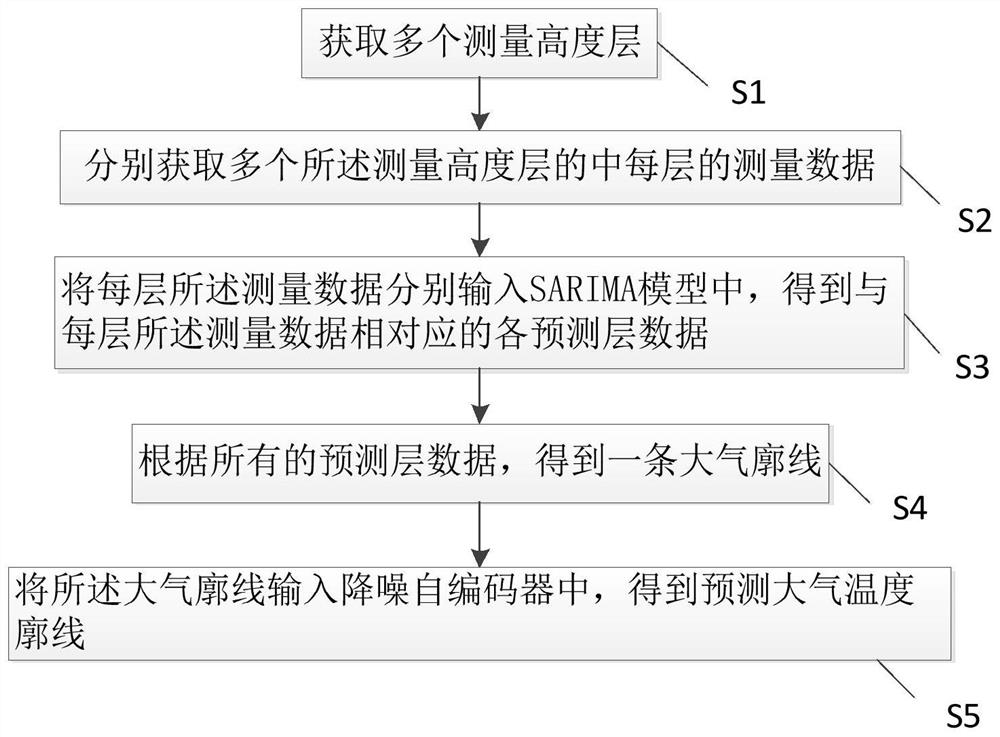
[0030] The present invention provides a method for predicting atmospheric temperature profile, referring to figure 1 As shown, the atmospheric temperature profile prediction method includes:
[0031] S1: Obtain multiple measurement altitude layers;
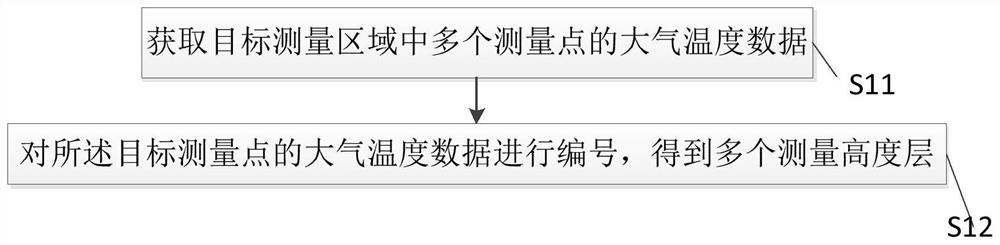
[0032] Specifically, refer to figure 2 As shown, the step S1 includes:
[0033] S11: Obtain the atmospheric temperature data of the target measurement point;
[0034] S12: Numbering the atmospheric temperature data of the target measurement point to obtain a plurality of measurement altitude layers.
[0035] S2: Acquiring the measurement data of each of the plurality of measurement height layers respectively;
[0036] S3: Input the measurement data of each layer into the SARIMA model respectively, and obtain the prediction data of each layer corresponding to the measurement data of each layer;
[0037] Among them, the specific structure of the SARIMA model is:
[0038]
[0039] Among them, φ( ) and Φ( ) represent autoreg...
Embodiment 2
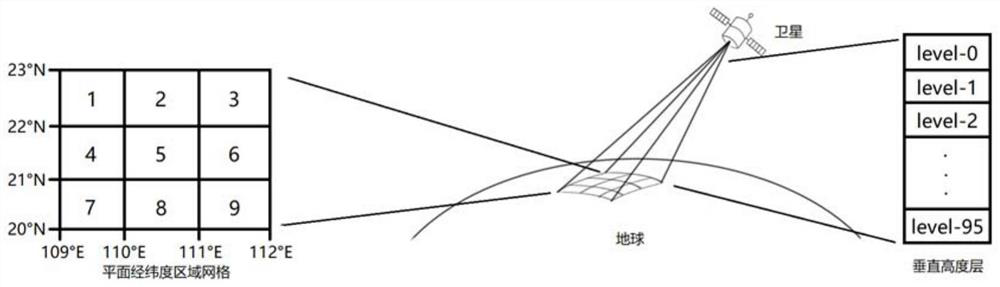
[0046] The data used in the experiment is the spatial distribution data of atmospheric temperature detected by a group of satellites. The atmospheric temperature data has a three-dimensional spatial distribution structure, such as image 3 As shown, a total of 96 altitude layers of atmospheric temperature data have been recorded in space. The atmospheric temperature data is a set of satellite measurement data for Maoming City, Guangzhou Province, China.
[0047] Atmospheric temperature data at each spatial measurement point can be analyzed from two perspectives of time and space. In terms of time, if Figure 4 As shown, the atmospheric temperature data consists of a set of time series data, and the observation time lasts from 2011 to 2014. Among them, the data is recorded on the 1st of each month, and a total of 48 observation data at each space point are recorded. With the change of time, the atmospheric temperature has an obvious seasonal variation trend, in which the atm...
PUM
 Abstract
Description
Claims
Application Information
 - R&D
- Intellectual Property
- Life Sciences
- Materials
- Tech Scout
- Unparalleled Data Quality
- Higher Quality Content
- 60% Fewer Hallucinations
Browse by: Latest US Patents, China's latest patents, Technical Efficacy Thesaurus, Application Domain, Technology Topic, Popular Technical Reports.
© 2025 PatSnap. All rights reserved.Legal|Privacy policy|Modern Slavery Act Transparency Statement|Sitemap|About US| Contact US: help@patsnap.com