Fundus disease visual analysis method based on computer vision and deep learning
A technology for computer vision and fundus diseases, applied in neural learning methods, calculations, image analysis, etc., to achieve wide applicability, improve reliability and intuition
- Summary
- Abstract
- Description
- Claims
- Application Information
AI Technical Summary
Problems solved by technology
Method used
Image
Examples
Embodiment approach
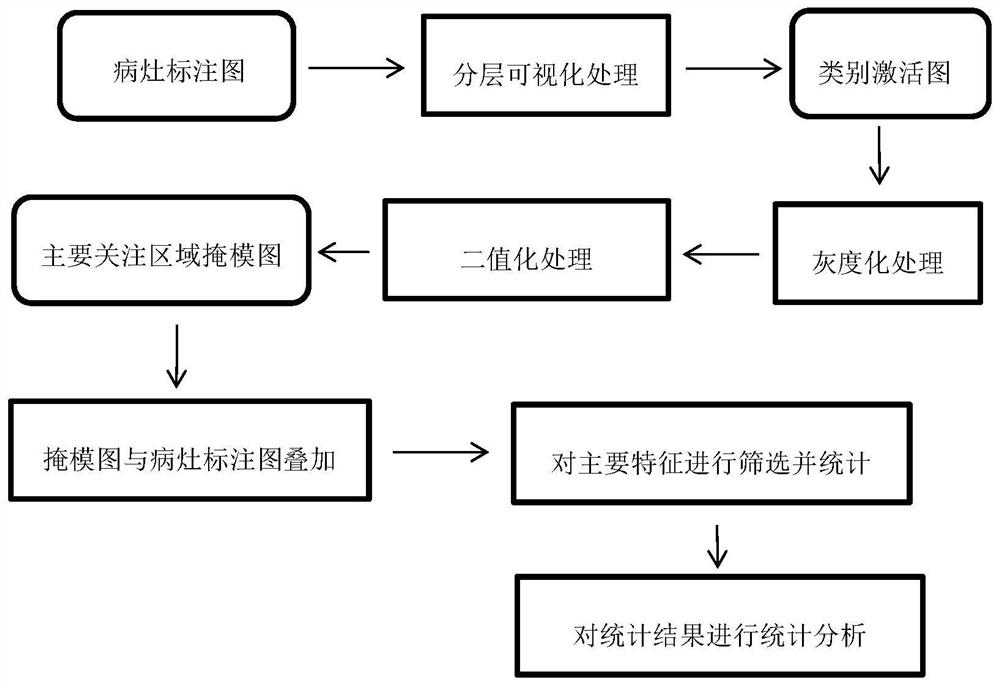
[0046] The flow chart of the implementation is as figure 1 shown, including the following steps:
[0047] Step S10, establishing a fundus lesion labeled image database;
[0048]Step S20, visualizing the region of interest of the model;
[0049] Step S30, the visualization area is superimposed;
[0050] Step S40, regionalized image feature screening and statistics;
[0051] Step S50, statistical data association analysis.
[0052] The model attention area visualization processing step S20 of the embodiment also includes the following steps:
[0053] Step S200, select a deep learning model that can be used for fundus disease image analysis to train the fundus disease images, and obtain the output weight of the model.
[0054] Step S210, loading the obtained model output weights, and performing multi-level visualization processing on the model by using the corresponding labeled images of fundus lesions to obtain category activation maps (heat maps) of different levels.
[0...
Embodiment
[0068] figure 1 A schematic flow chart of a method for visualizing and analyzing fundus diseases based on computer vision and deep learning is shown, taking diabetic retinopathy as an example. It is mainly divided into two parts: model focus area visualization and data statistical analysis.
[0069] The embodiment adopts a DenseNet-based image classification model and fundus images of patients in a certain hospital, and the size of the image file used for classification is generally around 300K.
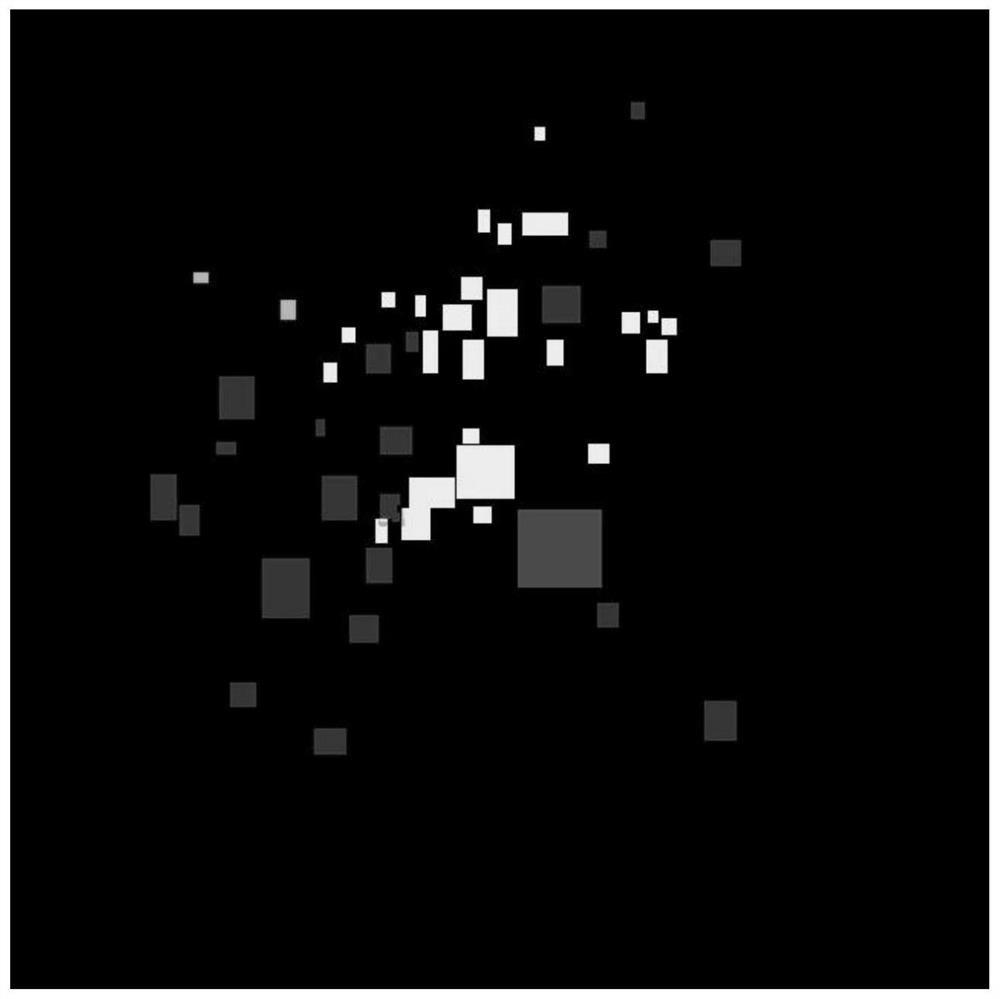
[0070] First, according to step 1, use the labelimg software to manually label and combine the lesions in the medical fundus disease images in units of categories, and the obtained lesion label images are as follows: figure 2 shown.
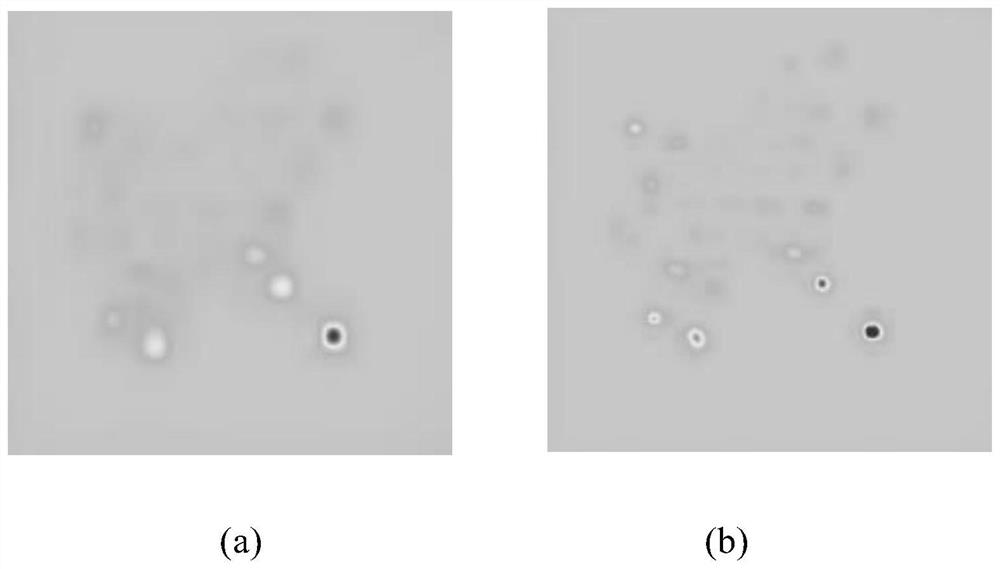
[0071] According to step 2, use the CAM-based improved algorithm to visualize the output of the 4 DenseBlock structures of DenseNet to obtain multi-level convolutional layer output weights, and obtain the output category activation maps of each level...
PUM
 Abstract
Description
Claims
Application Information
 - R&D
- Intellectual Property
- Life Sciences
- Materials
- Tech Scout
- Unparalleled Data Quality
- Higher Quality Content
- 60% Fewer Hallucinations
Browse by: Latest US Patents, China's latest patents, Technical Efficacy Thesaurus, Application Domain, Technology Topic, Popular Technical Reports.
© 2025 PatSnap. All rights reserved.Legal|Privacy policy|Modern Slavery Act Transparency Statement|Sitemap|About US| Contact US: help@patsnap.com


