Stress curve clustering method of building fiber grating stress sensor

A technology of stress sensor and fiber grating, which is applied in the direction of instruments, data processing applications, character and pattern recognition, etc., can solve the problems of poor clustering effect and low clustering efficiency, and achieve easy tuning, stable algorithm results, and input parameters. little effect

Pending Publication Date: 2022-04-22
GUILIN UNIV OF AEROSPACE TECH
View PDF0 Cites 0 Cited by
  • Summary
  • Abstract
  • Description
  • Claims
  • Application Information

AI Technical Summary

Problems solved by technology

[0005] In order to solve the technical problems of low clustering efficiency and poor clustering effect of traditional clustering algorithms

Method used


Image

  • Stress curve clustering method of building fiber grating stress sensor
  • Stress curve clustering method of building fiber grating stress sensor
  • Stress curve clustering method of building fiber grating stress sensor

Examples


Embodiment 1

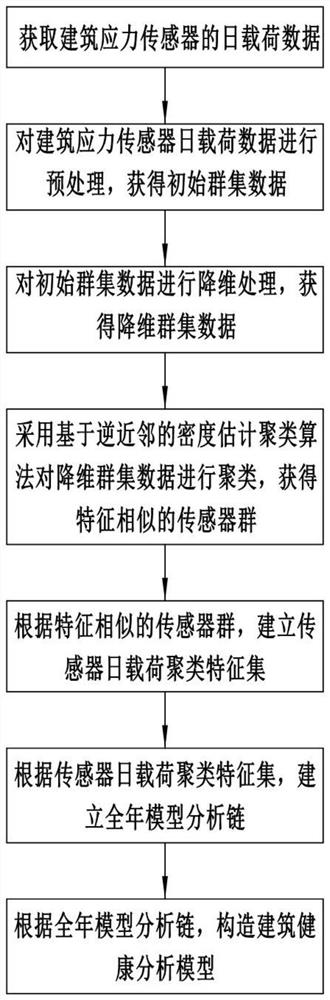
[0043] Such as figure 1 As shown, the present embodiment provides a method for clustering stress curves of architectural fiber grating stress sensors, including the following steps,

[0044] S1. Obtain the daily load data of a plurality of building stress sensors, establish P original sample sets, and let the P original sample sets correspond to a plurality of the building stress sensors; wherein, each of the original sample sets contains the current The sample set corresponds to the daily load data collected by the building stress sensor at Q time points in a day, where P and Q are both positive integers.

[0045]S2. Preprocessing the daily load data of each building stress sensor to obtain initial cluster data.

[0046] Specifically, data missing value processing is performed on all the original sample sets to obtain multiple initial sample sets; data standardization processing and data regularization processing are performed on all daily load data in each of the initial sa...

Embodiment 2

[0082] In this embodiment, different data sets with classification marks are clustered with the density estimation clustering algorithm based on the inverse nearest neighbor, that is, the RNN-DBSCAN algorithm and the K-Means algorithm and the DBSCAN algorithm. For the situation where the actual category information is unknown, use Calinski- The Harabasz index, that is, the CH index, is used to evaluate the clustering effect; for the dataset with known classification marks, the clustering effect index can be evaluated by using normalized mutual information (Normalized Mutual Information) and adjusted mutual information (Adjusted Mutual Information).

[0083] Assuming that U and V are the distribution of N sample labels, the entropies of the two distributions are: where P(i)=|U i | / N,P(j)=|U j | / N, the mutual information between U and V is defined as: where P(i,j)=|U i ∩U j | / N, the standardized mutual information is: Adjust mutual information: The value range of NMI...


PUM


Abstract

The invention relates to a stress curve clustering method for building fiber grating stress sensors. The method comprises the following steps: acquiring daily load data of a plurality of building stress sensors; preprocessing the daily load data of each building stress sensor to obtain initial cluster data; performing dimension reduction processing on the initial cluster data to obtain dimension-reduced cluster data, clustering the dimension-reduced cluster data based on an inverse neighbor density estimation clustering algorithm to obtain a sensor group with similar characteristics, and in the inverse neighbor density estimation clustering algorithm, a sample distance calculation method is a cosine similarity calculation method, and a sample distance calculation method is a cosine similarity calculation method. Establishing a daily load clustering feature set of the sensor group, establishing an annual model analysis chain, and constructing a building health analysis model; according to the invention, the stress data of the fiber bragg grating building stress sensor with huge data volume is clustered into a sensor group with similar characteristics, so that the stress change trend of key structures of different types of buildings can be better predicted, and a more reliable method is provided for safety monitoring of smart buildings.

Description

technical field [0001] The invention relates to the field of data analysis of building stress sensors, in particular to a method for clustering stress curves of fiber grating stress sensors used in buildings. Background technique [0002] With the wide application of optical fiber stress sensor monitoring system in many fields such as national defense, railway, chemical industry, environment, nuclear power, bridge and tunnel monitoring, it becomes more real-time and accurate to obtain building stress monitoring data through optical fiber stress sensor. The monitoring system will obtain more massive and accurate building stress data. [0003] Since geological and environmental changes are slow evolutionary processes, it is not feasible to make safety judgments based on certain data alone. It is necessary to collect reliable data accumulated over time and analyze correct mathematical models to make safety predictions with high reliability. Therefore, in the face of huge build...

Claims


Application Information

Patent Timeline
IPC IPC(8): G06K9/62G06Q50/08
CPCG06Q50/08G06F18/23
Inventor 林奕森郭振军熊艺文马莉陈艳张余明刘洪林
Owner GUILIN UNIV OF AEROSPACE TECH
Why Eureka
Try Eureka