Soybean having epistatic genes affecting yield
An allele and gene technology, applied in the field of soybeans with epistatic genes that affect yield, can solve the problems of affecting height and plant height having no obvious effect
- Summary
- Abstract
- Description
- Claims
- Application Information
AI Technical Summary
Problems solved by technology
Method used
Image
Examples
Embodiment 1
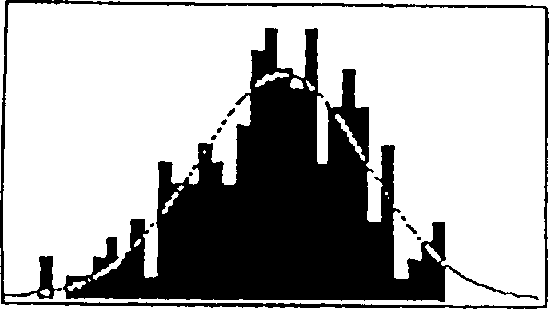
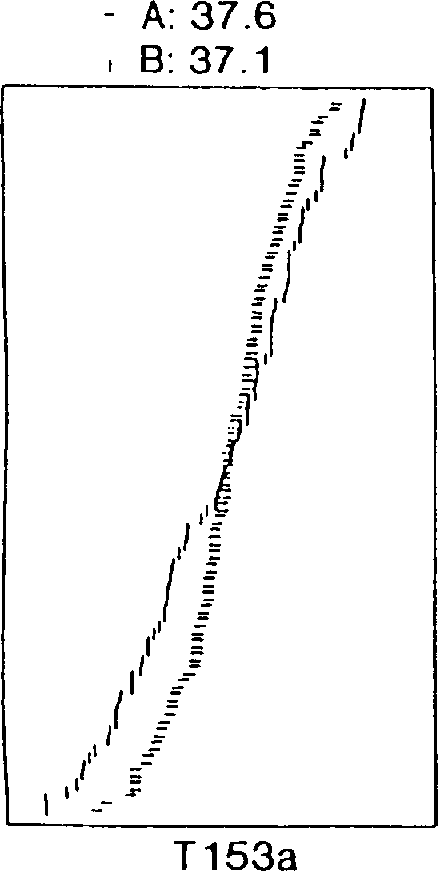
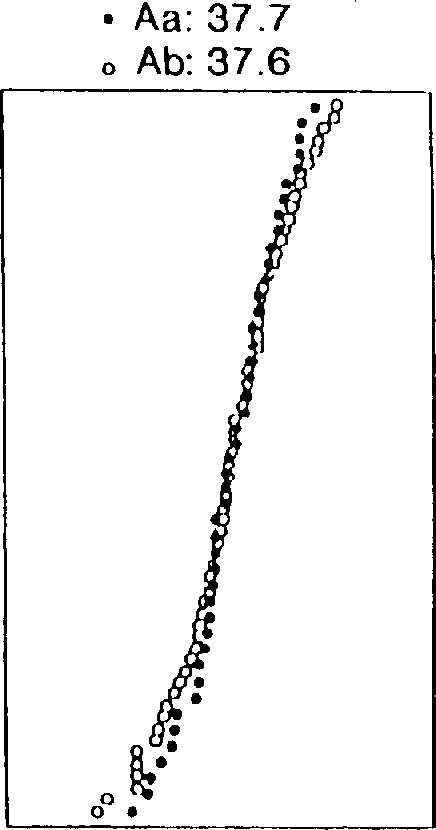
[0088] During screening of the soybean 'Archer' X'Noir 1' RI population for epistatic effects on yield, a surprise was found between the first locus linked to T153a and B172 and the second locus linked to Satt207 strong interaction. Plot the data as a series of cumulative distribution graphs, as shown in Figure 1. Data are combined yield results from all field trials including test plots in Minnesota and Chile. The horizontal axis of panel B is the standard distribution curve for yield (bu / ac) as a function of plant number. Panels B-E are cumulative distribution curves in which yield (horizontal axis) is plotted against each plant yield class. In panel A, all plants containing the 'Archer' allele of T153a (A) or the 'Noir 1' allele of T153a (B) are plotted as separate curves. An essentially normal distribution was found in yield tests.
[0089] The average production (bu / ac) of these two subpopulations is listed above the graph. In examining these data, it is important to...
Embodiment 2
[0097] In this and the following examples, markers designated by "Satt" or "Sat" before the numbers are microsatellite (microsattelite) DNA markers isolated from the Agricultural Research Council of the United States Department of Agriculture, available by request to Dr. Perry, Cregan, Available from USDA-ARS, Beltsville, MD [Cregan, P. et al. (1998) Genomics]. Markers A397, A489 and K011c were obtained from Biogenetic Services, Inc. (supra).
[0098] Determining maturity (days from planting to maturity) by plant height (cm) in the 'Minsoy'X'Noir 1' RI population revealed a pair of interacting QTLs, one linked to the marker Satt307, The other is linked to marker K011c. For dwarf, late-maturing plants, a higher maturity / height ratio is obtained. For tall precocious plants, lower maturity / height ratios were obtained. Figure 18A The cumulative distribution curve shown in -D shows the interaction between the two QTTs, Figure 18A The distribution of plants carrying the 'Noir ...
Embodiment 3
[0101] A pair of interacting loci affecting grain protein content was identified in the 'Archer' X 'Minsoy' RI population. They are linked to markers Sat_001 (modifier locus) and Satt001, respectively. Field data were obtained from a 1997 Minnesota field trial. This interaction is represented by an LLR value of 11.20. The cumulative distribution is shown in Figure 7.
PUM
 Abstract
Description
Claims
Application Information
 - R&D
- Intellectual Property
- Life Sciences
- Materials
- Tech Scout
- Unparalleled Data Quality
- Higher Quality Content
- 60% Fewer Hallucinations
Browse by: Latest US Patents, China's latest patents, Technical Efficacy Thesaurus, Application Domain, Technology Topic, Popular Technical Reports.
© 2025 PatSnap. All rights reserved.Legal|Privacy policy|Modern Slavery Act Transparency Statement|Sitemap|About US| Contact US: help@patsnap.com


