Method for determining damage position of anchor rod system

A technology of damage location and determination method, which is applied to processing detection response signals, using sound waves/ultrasonic waves/infrasonic waves to analyze solids, etc., can solve the problem that it is difficult to determine the position and distribution of singular points in space, and the response cannot be known by time domain methods. It is difficult to accurately obtain the damaged position and other issues

Inactive Publication Date: 2007-04-11
CHONGQING UNIV
View PDF0 Cites 2 Cited by
  • Summary
  • Abstract
  • Description
  • Claims
  • Application Information

AI Technical Summary

Problems solved by technology

The time-domain method cannot know its response in the frequency domain, that is, it does not know which frequency band the damage concentration appears in; while the frequency-domain method can only determine the overall nature of the singularity of a signal, but it is difficult to determine the location and distribution of the singularity in space. That is, it is not known when the damage occurred and the phase of the specific damage reflected wave
In addition, due to the weak low-strain measurement signal and the influence of noise, the determination of the position of the signal mutation is affected by the artificial factors of the technician, and it is difficult to accurately obtain the damaged position

Method used


Image

  • Method for determining damage position of anchor rod system
  • Method for determining damage position of anchor rod system
  • Method for determining damage position of anchor rod system

Examples


Embodiment 1

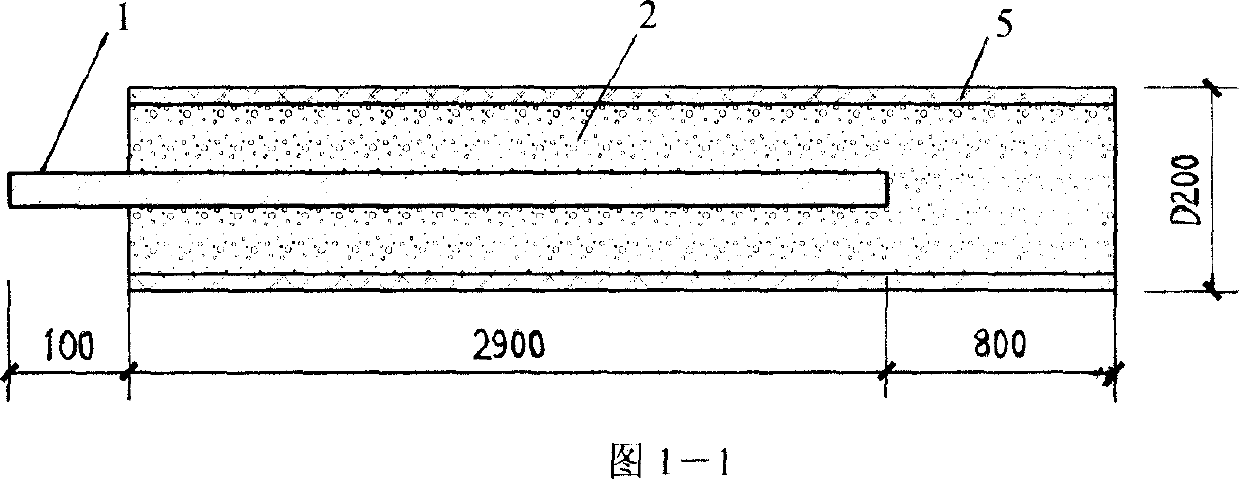
[0024] Example 1: Take a complete anchor rod with a length of 2.9 meters, as shown in Figure 1-1, and use the dynamic measurement signal obtained by hammering the end of the rod to illustrate the detection of the mutation point of the fault signal.

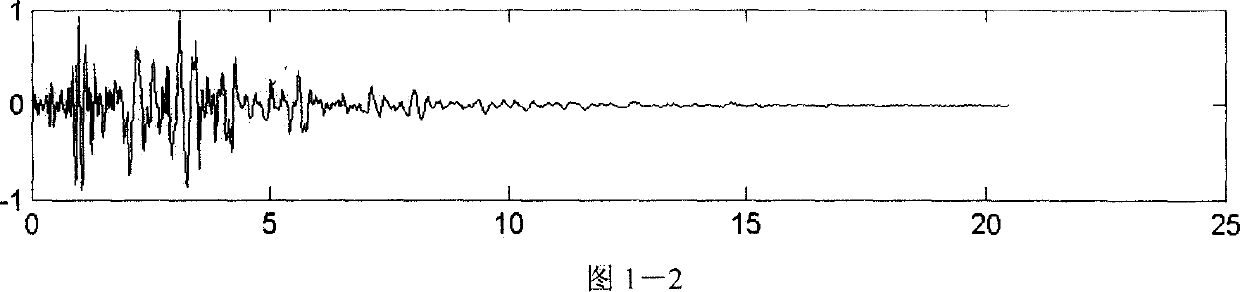
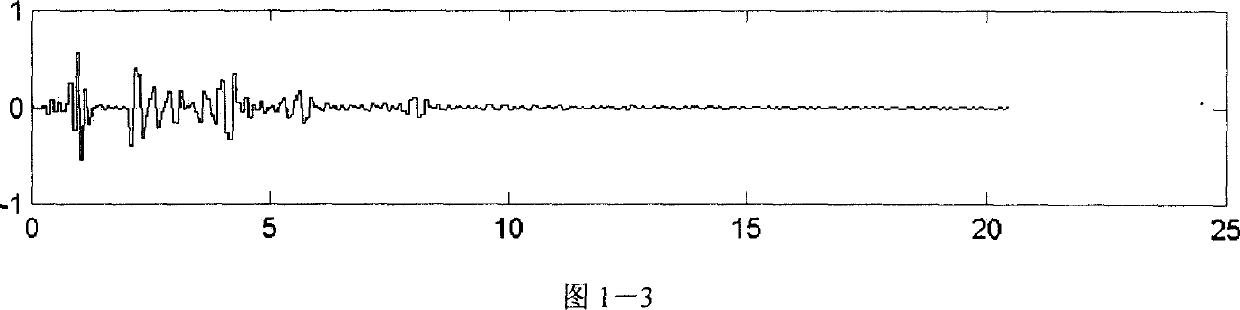
[0025] Considering that the sudden change of the signal produces a large number of high-frequency components, the electrical signal is first decomposed by wavelet, and then the high-frequency part of the signal is reconstructed to determine the sudden change of the signal. In this example, the wavelet decomposition and reconstruction function provided by MATLAB is used to process the signal. The original signal is shown in Figure 1-2. Here, the db1 wavelet function of the Daubechies wavelet series is used as the wavelet base for three-layer decomposition and reconstruction, as shown in Figure 1. -3. It can be seen that the change of the high-frequency component of the signal is more obvious, because the mutation point must contain...

Embodiment 2

[0030] Embodiment 2: Take a damaged anchor rod model 1, see 2-1, its length is 2.9 meters, there are two damage interfaces, the position is located at 1 meter and 1.9 meters respectively from the rod end, and the resulting dynamic force of the rod end is hammered. The test signal is used to illustrate the detection of the mutation point of the fault signal.

[0031] 1. For the measured bolt time domain signal u(s, t) (see Figure 2-2), use the db1 wavelet function of the Daubechies wavelet series to decompose and reconstruct the three-layer wavelet packet, as shown in Figure 2- 3;

[0032] 2. Perform threshold de-noising processing on the high-frequency coefficients of the obtained signal;

[0033] 3. Perform single-branch reconstruction on the high-frequency coefficient part of the signal after denoising processing, and obtain the reconstructed waveform diagram, as shown in Figure 2-4;

[0034] 4. From the reconstructed waveform diagram, identify the position t of the incide...

Embodiment 3

[0043] Embodiment 3: Take a damaged anchor rod model 2, see 3-1, its length is 2.9 meters, there are two damage interfaces, the position is located at 1 meter and 1.9 meters respectively from the rod end, and the dynamic force obtained by hammering the rod end The test signal is used to illustrate the detection of the mutation point of the fault signal.

[0044] The same method as in Example 2 is used for detection, and the relevant detection diagrams of Fig. 3-2 to Fig. 3-4 are obtained, and it can be obtained from Fig. 3-4:

[0045] t 0 = 0.14ms, t 1 = 0.55ms, t 2 = 0.89ms, t 1 =1.29ms, the calculated result is:

[0046] First damage interface position: L 1 =C·(t 1 -t 0 ) / 2=5054×(0.55-0.14) / 2×10 -3 =1.036m

[0047] Second damage interface position: L 2 =C·(t 2 -t 0 ) / 2=5054×(0.55-0.14) / 2×10 -3 =1.895m

[0048] Anchor length: L=C (t e -t 0 ) / 2=5054×(1.29-0.14) / 2×10 -3 =2.906m

[0049] It can be further confirmed by the above calculation results that the resu...


PUM

PropertyMeasurementUnit
Lengthaaaaaaaaaa

Abstract

The nondestructive flaw detecting process for determining the damage position in anchor bolt-wall rock structure system includes the following steps: performing three layer wavelet packet resolving of the measured damage anchor bolt time domain signal u(s, t) with the db1 wavelet function of Daubechies wavelet series to obtain the low frequency and high frequency coefficients of different layers; performing threshold denoising treatment on the high frequency coefficients of the obtained signal; performing the one-leg reconstruction of the high frequency coefficients of the denoised signal to obtain the reconstructed oscillogram; recognizing the incident wave from the reconstructed oscillogram, anchor bottom reflection wave and sudden signal change position t0, te and ti; and final calculating to obtain the anchor bolt length L=C.(te-t0) / 2 and anchor bolt damage position Li=C.(ti-t0) / 2, where, C is the wave speed 5054 m / s. The method can determine the anchor bolt damage position precisely.

Description

technical field [0001] The invention relates to a method for non-destructive flaw detection of an engineering structure system, in particular to a non-destructive flaw detection method for determining the damage position of a bolt-surrounding rock structure system. Background technique [0002] As we all know, the primary task of the non-destructive testing of the bolt-surrounding rock structure system is to determine the location of the damage. When the bolt system is damaged, the time domain curve of the velocity measured at the top of the rod will change abruptly, that is, the reflected wave at the bottom of the rod will have sub-peaks of the same or opposite phase. The current method of determining the damage location is usually by detecting the mutation point The time difference between the peak of the incident wave and the signal is transformed into the frequency domain, and the damage position of the bolt system can be judged by detecting the distance between the freq...

Claims


Application Information

Patent Timeline
IPC IPC(8): G01N29/44G01N29/04
Inventor 陈建功张永兴王桂林吴曙光
Owner CHONGQING UNIV
Why Eureka
Try Eureka