Multiplex analysis of molecules in single cells by image correlation
a single cell, multi-molecule technology, applied in the field of single cell multi-molecule profiling by image correlation, can solve the problems of increasing the complexity of data analysis, and achieve the effects of reducing the number of data sets
- Summary
- Abstract
- Description
- Claims
- Application Information
AI Technical Summary
Benefits of technology
Problems solved by technology
Method used
Image
Examples
example 1
Single Cell Versus Subcellular Molecule Abundance
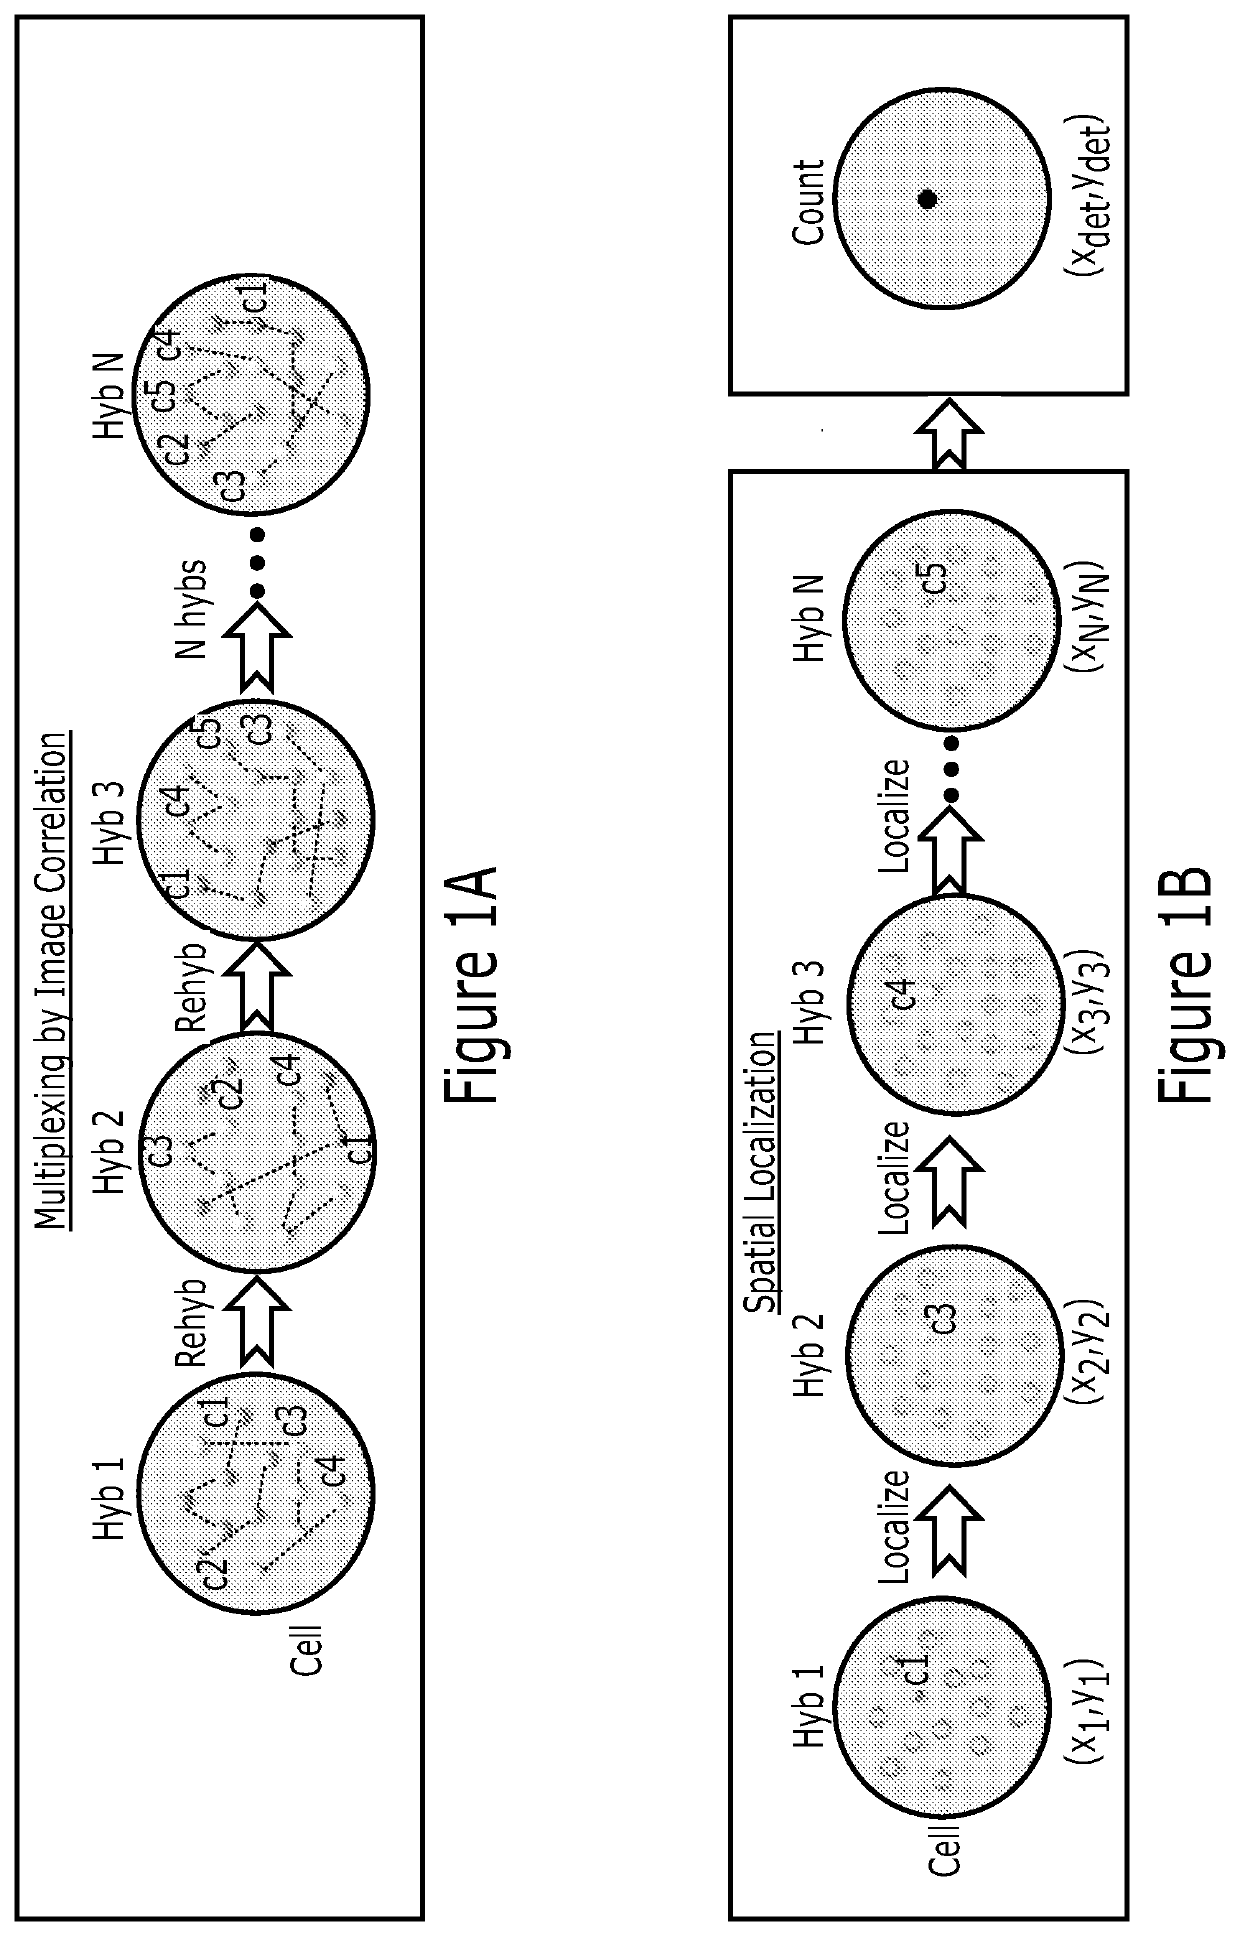
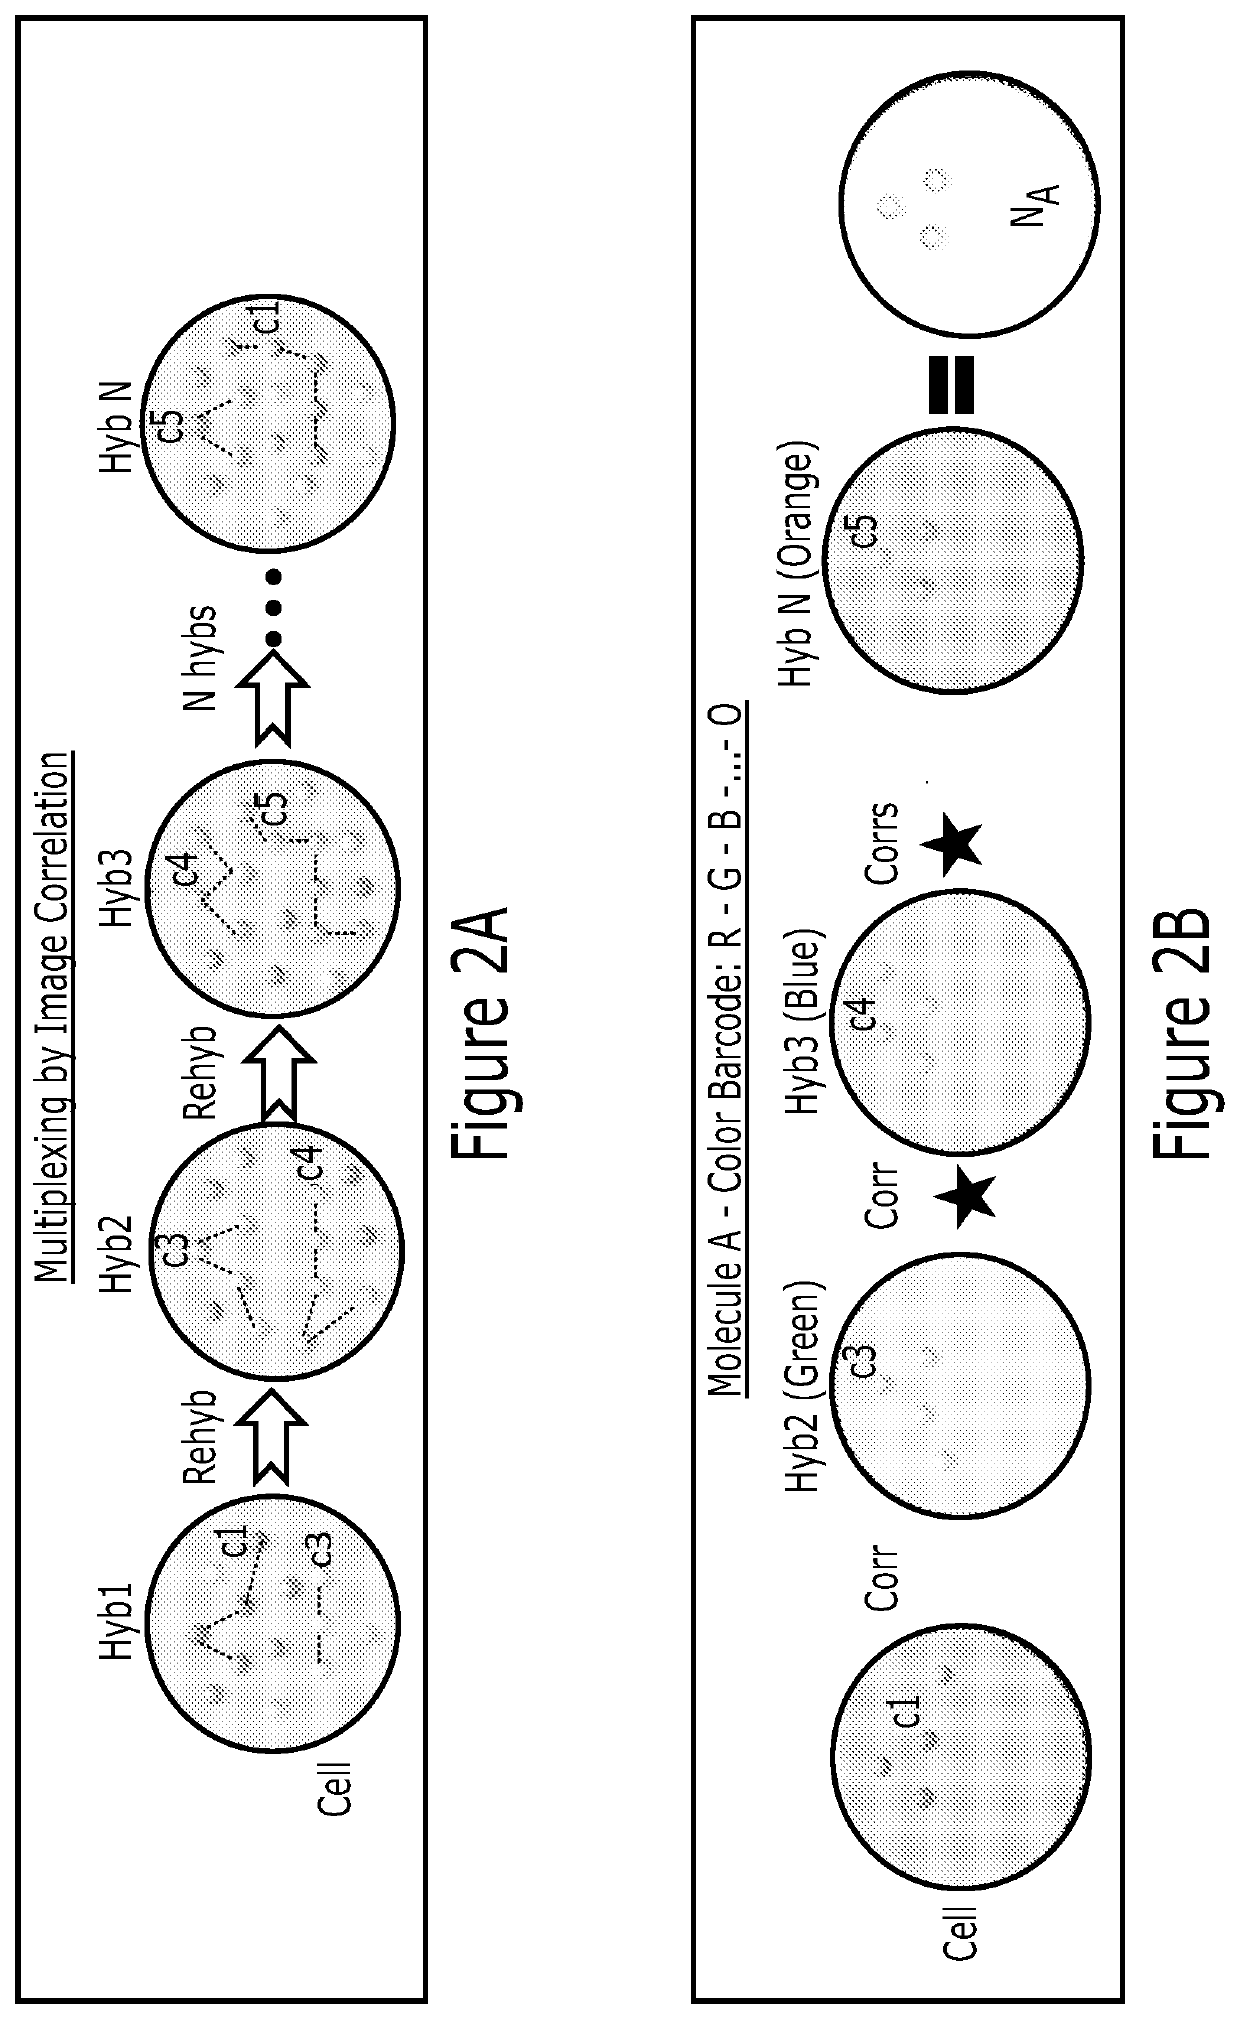
[0221]We have shown by computer simulation that hundreds of molecular species can be multiplexed and their abundances extracted with less than 10% error using this correlation method. This method is applicable to many molecular species, such as mRNA, proteins, lipids and carbohydrates. Each single cell is encoded with a singular value for the abundance of molecules (FIG. 4A). Lastly, the correlation analysis can be applied only on a subset of the image to obtain spatial information within the cell (FIG. 4B). Partitioning the cell into, for example, 20×20 or 40×40 or 80×80 pixels enables sub-region analysis. The abundance map resolution will be lower than the image resolution, and is in a tradeoff with the abundance estimate accuracy. However, one gains the simplicity of implementation and ease of analysis. For example, a 100 protein analysis will only require 3 rounds of h, compared to 20 rounds previously.
example 2
Methods for Simulations
[0222]Point emitters were randomly distributed in a digital image of size 128×128 pixels or 180×180 pixels or 256×256 pixels or 512×512 pixels using a custom written MATLAB algorithm. Emitters were convolved with point-spread function (PSF) of a 100× wide field fluorescence microscope. The obtained images mimic the molecules labeled with fluorescent dyes. Adjusting the total number of emitters per simulation area changed concentration of the molecules. Sequences of these digital images were correlated in spatial or Fourier domains to compute the abundances of molecules that are common across these image arrays. In the correlation process, PSF of the image detection does not need to be evaluated, as the correlation amplitude is the key to obtain molecule copy number. Fixing the position of the cross-correlation term and averaging the background of the rest of the image improved the performance of the molecule detection.
example 3
Regular Wide Field Microscopic Image Analysis
[0223]In the case of regular wide field microscopic image analysis: 180×180 pixels were simulated as a digital image of a cell. Three types of molecules (A, B, and C molecules) were included in the simulations. Molecule A was the target to detect using cross-correlation algorithm. Molecules B and C were additional contaminants in the first and second hybridizations, respectively. FIG. 5A shows randomly distributed 1,000 A and 1,000 B molecules or emitters or single-pixel positions within the simulation window. These molecules were convolved or blurred with the PSF of a microscope creating lower resolution images as illustrated in FIG. 5B-C. In between first hyb and second hyb, only the 1,000 A molecules share the same positions, while 1,000 B and 1,000 C molecules are totally uncorrelated across these two images (FIG. 5B-C). The cross-correlation of the first hyb and second hyb images provided a cross correlation function exhibiting a Gau...
PUM
 Abstract
Description
Claims
Application Information
 - R&D
- Intellectual Property
- Life Sciences
- Materials
- Tech Scout
- Unparalleled Data Quality
- Higher Quality Content
- 60% Fewer Hallucinations
Browse by: Latest US Patents, China's latest patents, Technical Efficacy Thesaurus, Application Domain, Technology Topic, Popular Technical Reports.
© 2025 PatSnap. All rights reserved.Legal|Privacy policy|Modern Slavery Act Transparency Statement|Sitemap|About US| Contact US: help@patsnap.com


