Multiplex analysis of molecules in single cells by image correlation

a single cell, multi-molecule technology, applied in the field of single cell multi-molecule profiling by image correlation, can solve the problems of increasing the complexity of data analysis, and achieve the effects of reducing the number of data points

Active Publication Date: 2016-01-21
CALIFORNIA INST OF TECH
View PDF0 Cites 8 Cited by
  • Summary
  • Abstract
  • Description
  • Claims
  • Application Information

AI Technical Summary

Benefits of technology

[0010]For example, the present invention provides the insight that existing technologies such as single cell RNA-seq or qPCR require single cells to be isolated and put into multi-well format, which is a multiple step process that can be cost prohibitive, labor intensive and prone to artifacts. Furthermore, the present invention recognizes that existing in situ sequencing technologies that use enzymatic reactions to convert the mRNA into a DNA template first can be highly inefficient (for example in the mRNA to DNA conversion process), so that, often, only a small fraction of the RNAs are converted and detected. The present invention provides the particular insight that one major downside of such low efficiency, which is estimated at 1% for RT and 10% for PLA, is that it can introduce significant noise ad bias in the gene expression measurements. The present invention further recognizes that existing spectral mRNA barcoding technologies that utilize single molecule fluorescence in situ hybridization (smFISH) require distinct fluorophores for scale up, and may be limited in the number of barcodes that can be generated. smFISH also requires splitting probes into barcoding subsets during hybridization. Because smFISH often uses two or more colors for a target, it produces high density of objects in the image, which can increase the complexity of data analysis.

Problems solved by technology

Because smFISH often uses two or more colors for a target, it produces high density of objects in the image, which can increase the complexity of data analysis.

Method used


Image

  • Multiplex analysis of molecules in single cells by image correlation
  • Multiplex analysis of molecules in single cells by image correlation
  • Multiplex analysis of molecules in single cells by image correlation

Examples


example 1

Single Cell Versus Subcellular Molecule Abundance

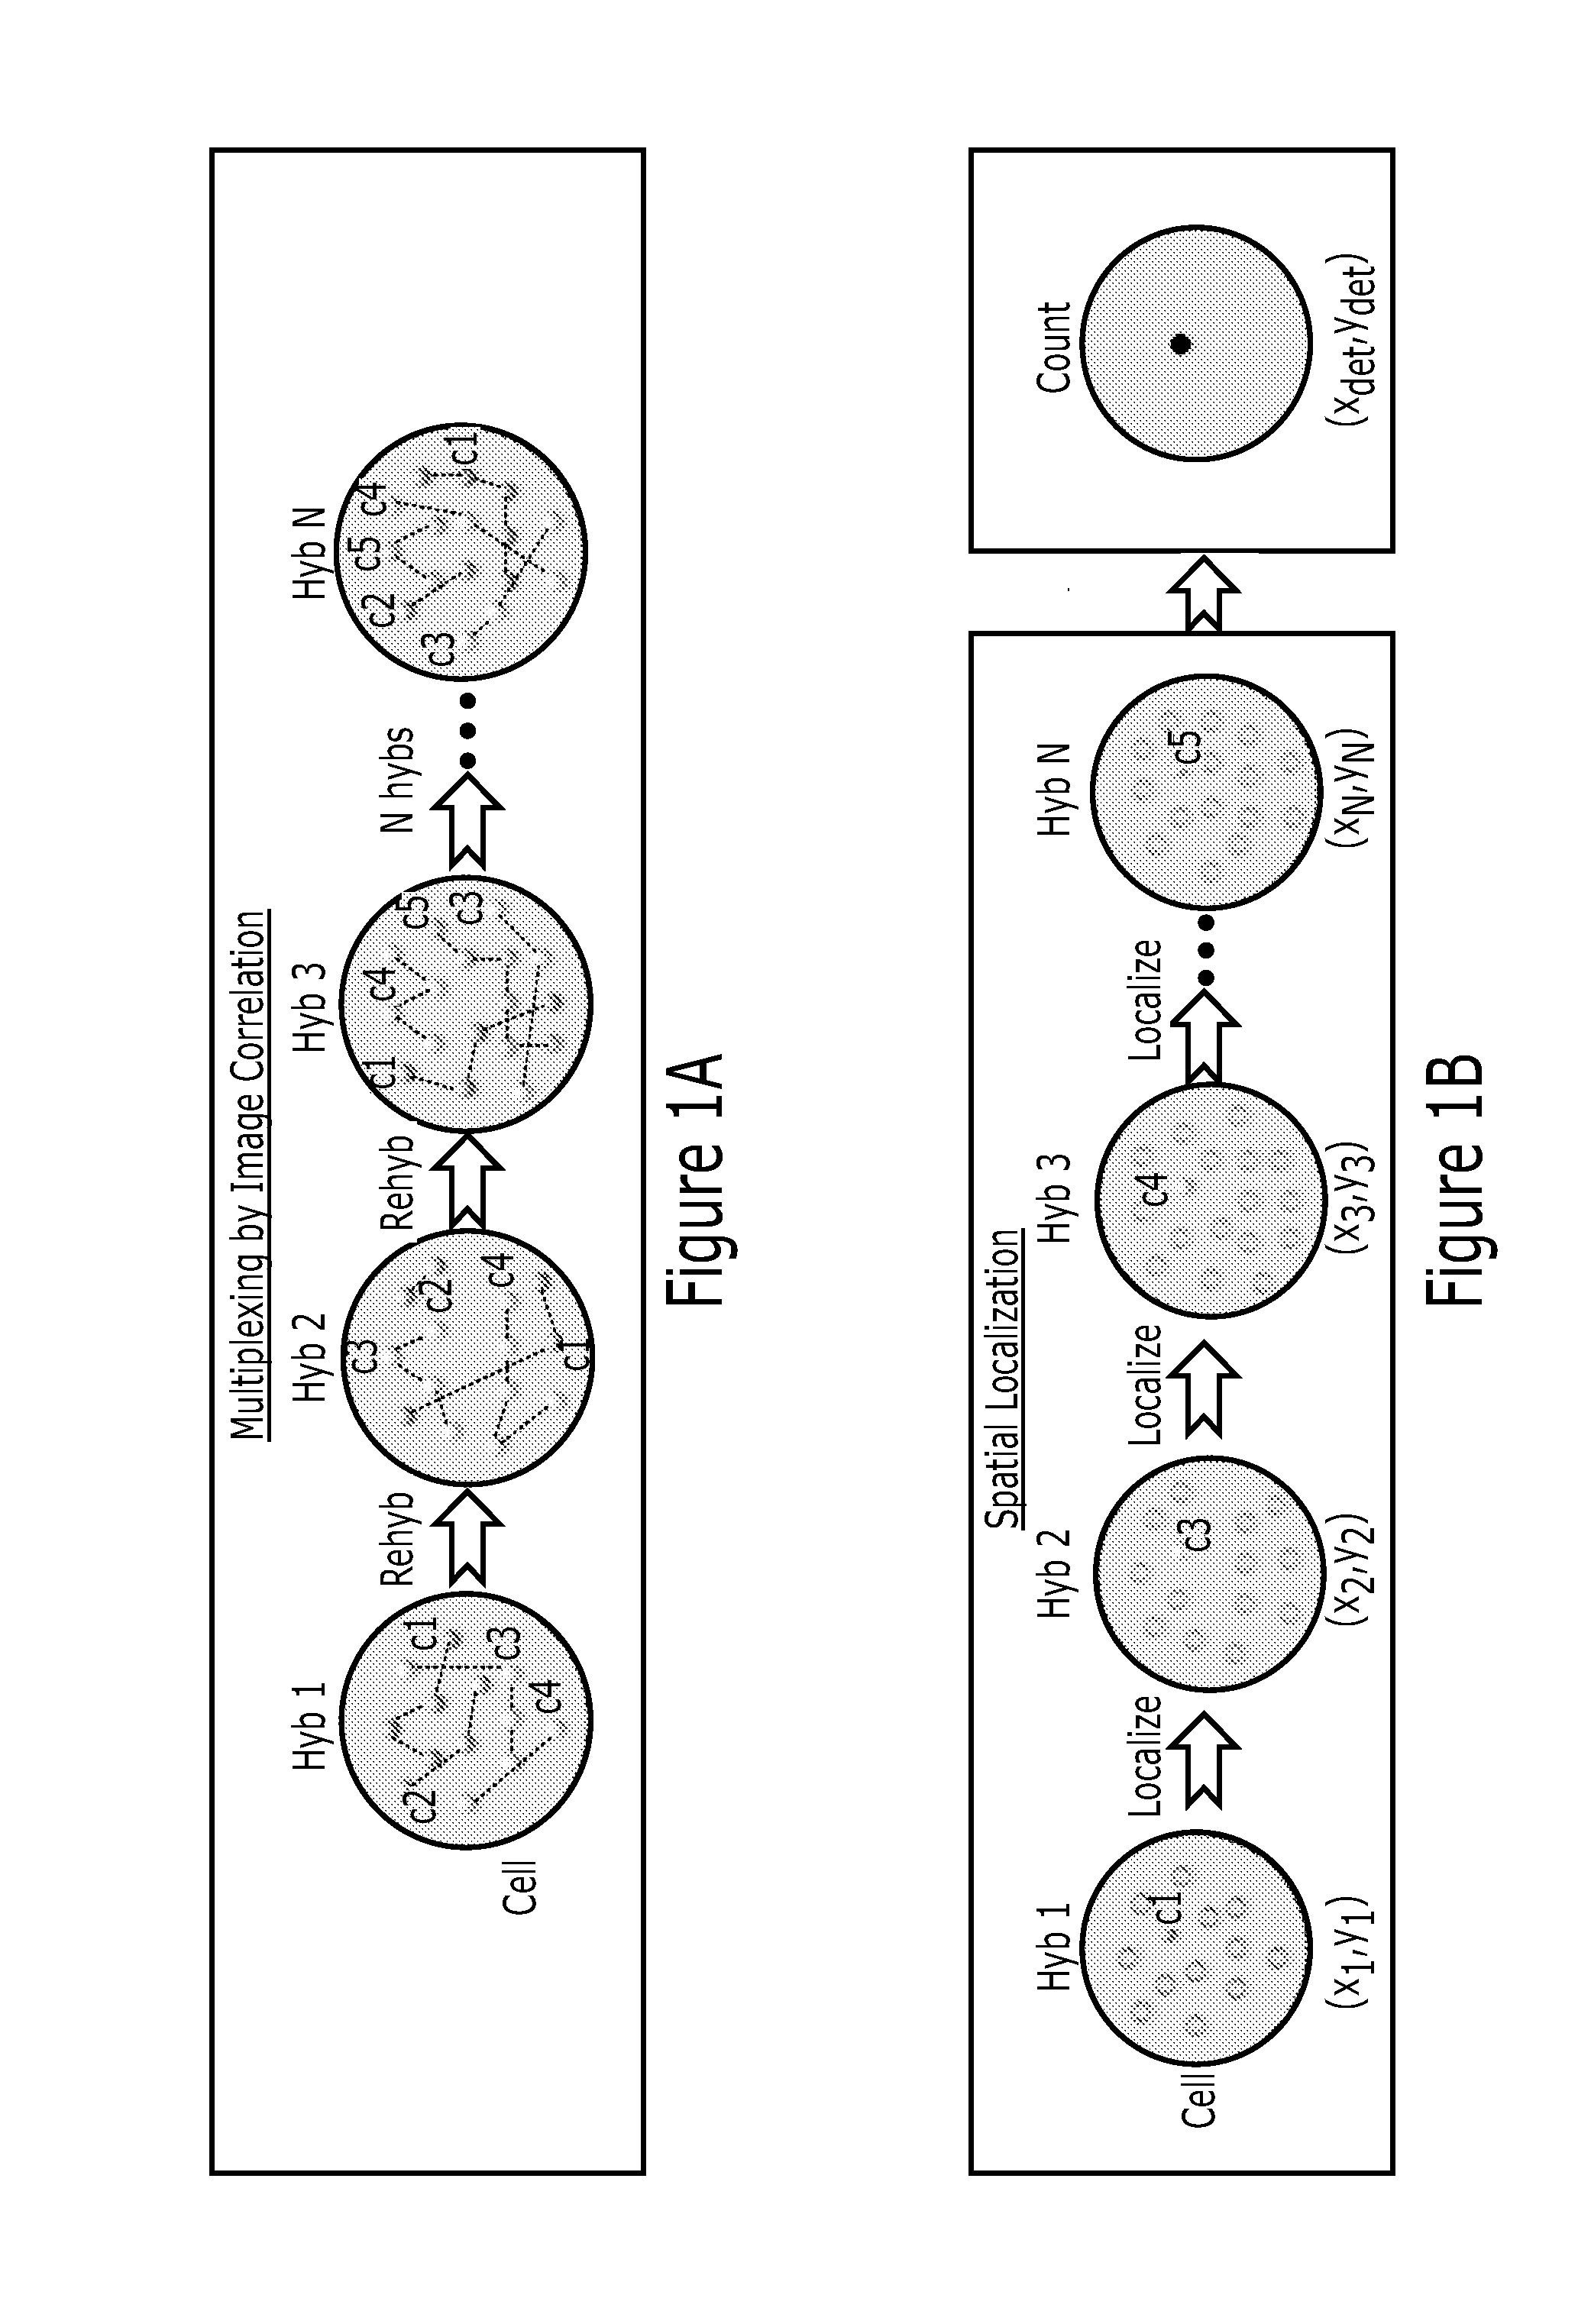
[0211]We have shown by computer simulation that hundreds of molecular species can be multiplexed and their abundances extracted with less than 10% error using this correlation method. This method is applicable to many molecular species, such as mRNA, proteins, lipids and carbohydrates. Each single cell is encoded with a singular value for the abundance of molecules (FIG. 4A). Lastly, the correlation analysis can be applied only on a subset of the image to obtain spatial information within the cell (FIG. 4B). Partitioning the cell into, for example, 20×20 or 40×40 or 80×80 pixels enables sub-region analysis. The abundance map resolution will be lower than the image resolution, and is in a tradeoff with the abundance estimate accuracy. However, one gains the simplicity of implementation and ease of analysis. For example, a 100 protein analysis will only require 3 rounds of h, compared to 20 rounds previously.

example 2

Methods for Simulations

[0212]Point emitters were randomly distributed in a digital image of size 128×128 pixels or 180×180 pixels or 256×256 pixels or 512×512 pixels using a custom written MATLAB algorithm. Emitters were convolved with point-spread function (PSF) of a 100× wide field fluorescence microscope. The obtained images mimic the molecules labeled with fluorescent dyes. Adjusting the total number of emitters per simulation area changed concentration of the molecules. Sequences of these digital images were correlated in spatial or Fourier domains to compute the abundances of molecules that are common across these image arrays. In the correlation process, PSF of the image detection does not need to be evaluated, as the correlation amplitude is the key to obtain molecule copy number. Fixing the position of the cross-correlation term and averaging the background of the rest of the image improved the performance of the molecule detection.

example 3

Regular Wide Field Microscopic Image Analysis

[0213]In the case of regular wide field microscopic image analysis: 180×180 pixels were simulated as a digital image of a cell. Three types of molecules (A, B, and C molecules) were included in the simulations. Molecule A was the target to detect using cross-correlation algorithm. Molecules B and C were additional contaminants in the first and second hybridizations, respectively. FIG. 5A shows randomly distributed 1,000 A and 1,000 B molecules or emitters or single-pixel positions within the simulation window. These molecules were convolved or blurred with the PSF of a microscope creating lower resolution images as illustrated in FIG. 5B-C. In between first hyb and second hyb, only the 1,000 A molecules share the same positions, while 1,000 B and 1,000 C molecules are totally uncorrelated across these two images (FIG. 5B-C). The cross-correlation of the first hyb and second hyb images provided a cross correlation function exhibiting a Gau...


PUM

PropertyMeasurementUnit
radiusaaaaaaaaaa
radiusaaaaaaaaaa
radiusaaaaaaaaaa

Abstract

Disclosed herein are methods and systems for analyzing visual data from multiple rounds of hybridization interactions where the same molecular target is detected by probes with different detectable labels. In particular, disclosed herein are methods and systems for analyzing sequential hybridization images for molecular profiling, where the images are obtained using multiplex fluorescence in situ hybridization (FISH).

Description

CROSS-REFERENCE TO RELATED APPLICATIONS[0001]This application claims priority to U.S. Provisional Application Ser. No. 62 / 025,891, filed Jul. 17, 2014, which is hereby incorporated by reference herein in its entirety.STATEMENT REGARDING FEDERALLY-SPONSORED RESEARCH[0002]This invention was made with government support under Grant No. DP2-OD008530-01 and No. R01 HD075605 awarded by the National Institutes of Health. The government has certain rights in the invention.FIELD OF INVENTION[0003]The invention disclosed herein generally relates to methods and systems for locating and quantitating molecular targets; e.g., within a cellular environment. Specifically, the invention disclosed herein relates to methods and systems for resolving signals from sequential hybridization interactions. More specifically, the invention disclosed herein relates to methods and systems for dense molecular profiling in single cells by image correlation.BACKGROUND[0004]Locating and quantitating molecular targ...

Claims


Application Information

Patent Timeline
Patent Type & Authority Applications(United States)
IPC IPC(8): G16B20/10C40B30/02G16B5/00G16B35/00G16B45/00
CPCG06F19/26C40B30/02G06F19/12G16B5/00G16B35/00G16B45/00G16C20/60G16B20/10
Inventor CAI, LONGCOSKUN, AHMET F.
Owner CALIFORNIA INST OF TECH
Why Eureka
Try Eureka