
Method and system for evaluating reliability of results in a visual reaction test

a visual reaction and reliability technology, applied in the field of visual reaction reliability evaluation, can solve the problems of affecting the accuracy of measurements, reducing the visual performance ability, and not being able to act as quickly, and achieve the effect of reliable results, effective and simple way

Active Publication Date: 2021-01-26
OCUSPECTO
View PDF17 Cites 0 Cited by
  • Summary
  • Abstract
  • Description
  • Claims
  • Application Information

AI Technical Summary

Benefits of technology

The invention relates to a visual reaction test that aims to provide reliable results while being simple and easy to use. It introduces a delay time between the appearance of the visual stimulus and the person's response to determine if they are fully attentive, cheating or have not fully learned the operating principle of the test. The delay time is variable and relatively short to ensure that the person reacts to the stimulus. The test stimulus may comprise a symbol with a visually recognizable value indicating a direction, such as an arrow or a standard Landot-C. The invention also enables determination of the minimum time a person needs for recovery from a previous step to be attentive to the new stimulus by shortening the delay until reaction time begins to slow down.

Problems solved by technology

In the case of dementia or cognitive impairment the cognitive performance can be so slow or variable, that it affects the accuracy of the measurements.
Slow answers to the visual stimuli also diminishes the visual performance ability—you can't act as quickly based on the visual information compared to faster persons.
The person could have attentional difficulties which can result in concentration difficulties regarding the execution of the reaction time test.
Problems arise also, if the person hasn't fully learned the principle of the test.

Method used


Image

  • Method and system for evaluating reliability of results in a visual reaction test
  • Method and system for evaluating reliability of results in a visual reaction test
  • Method and system for evaluating reliability of results in a visual reaction test

Examples


example 1

Reaction Time Test (OcuRT Test)

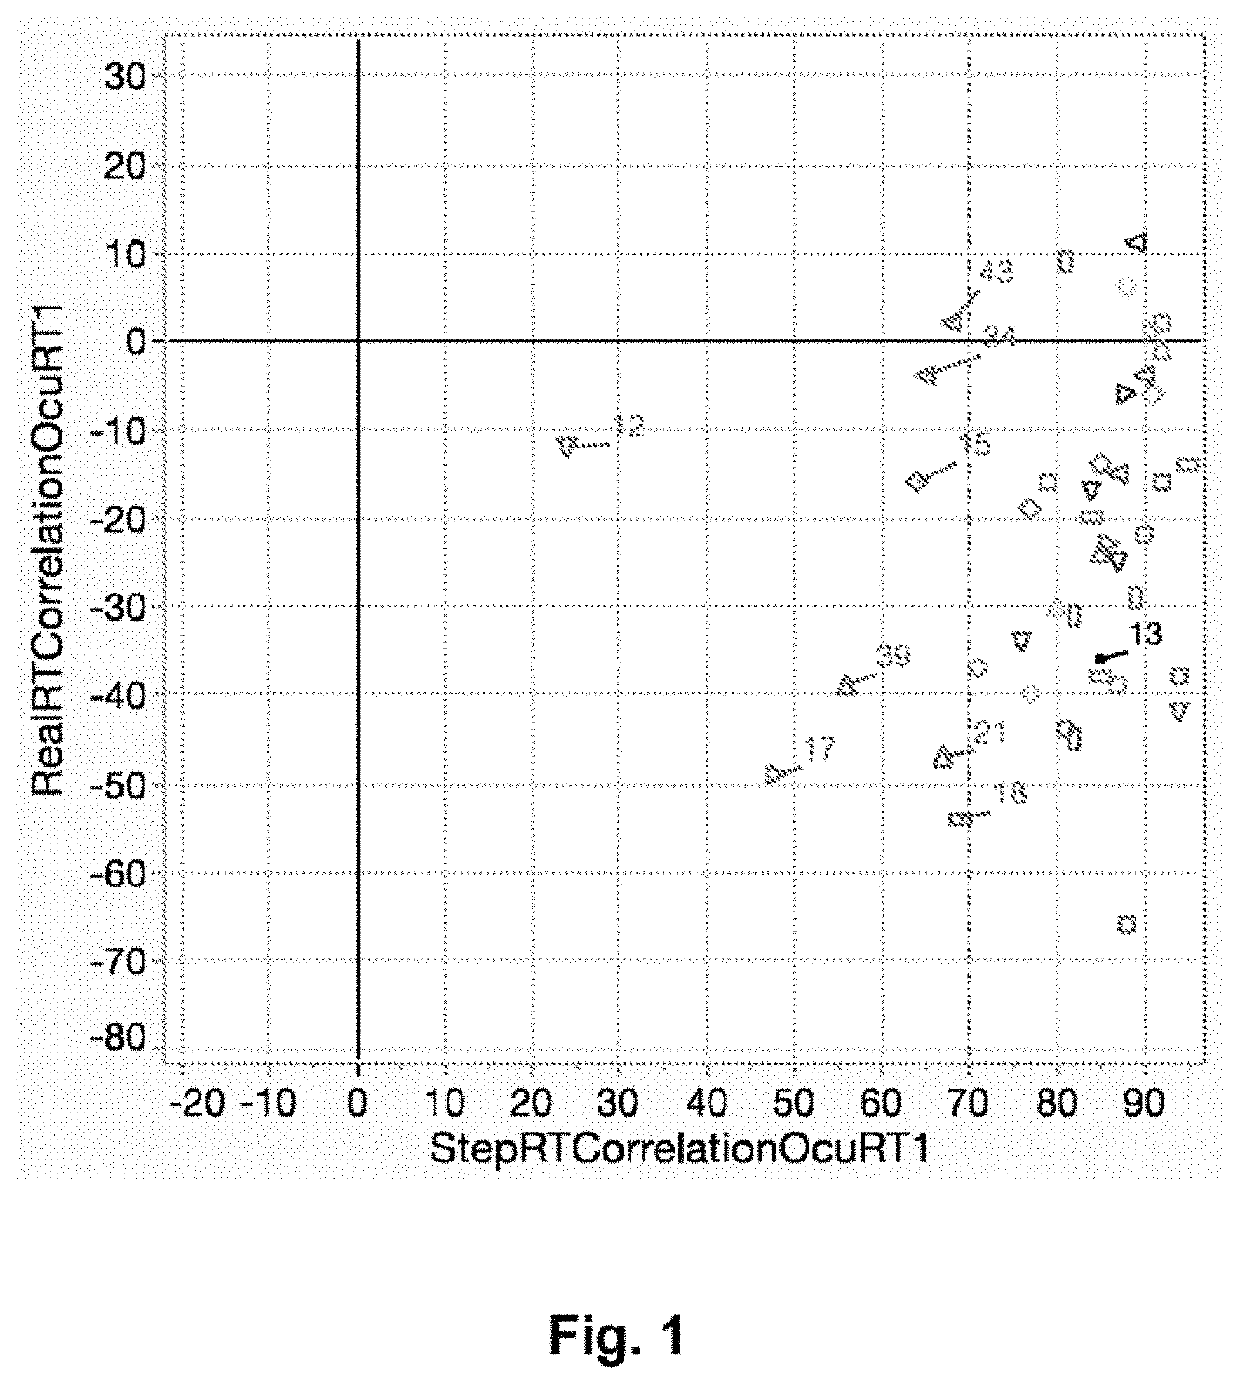
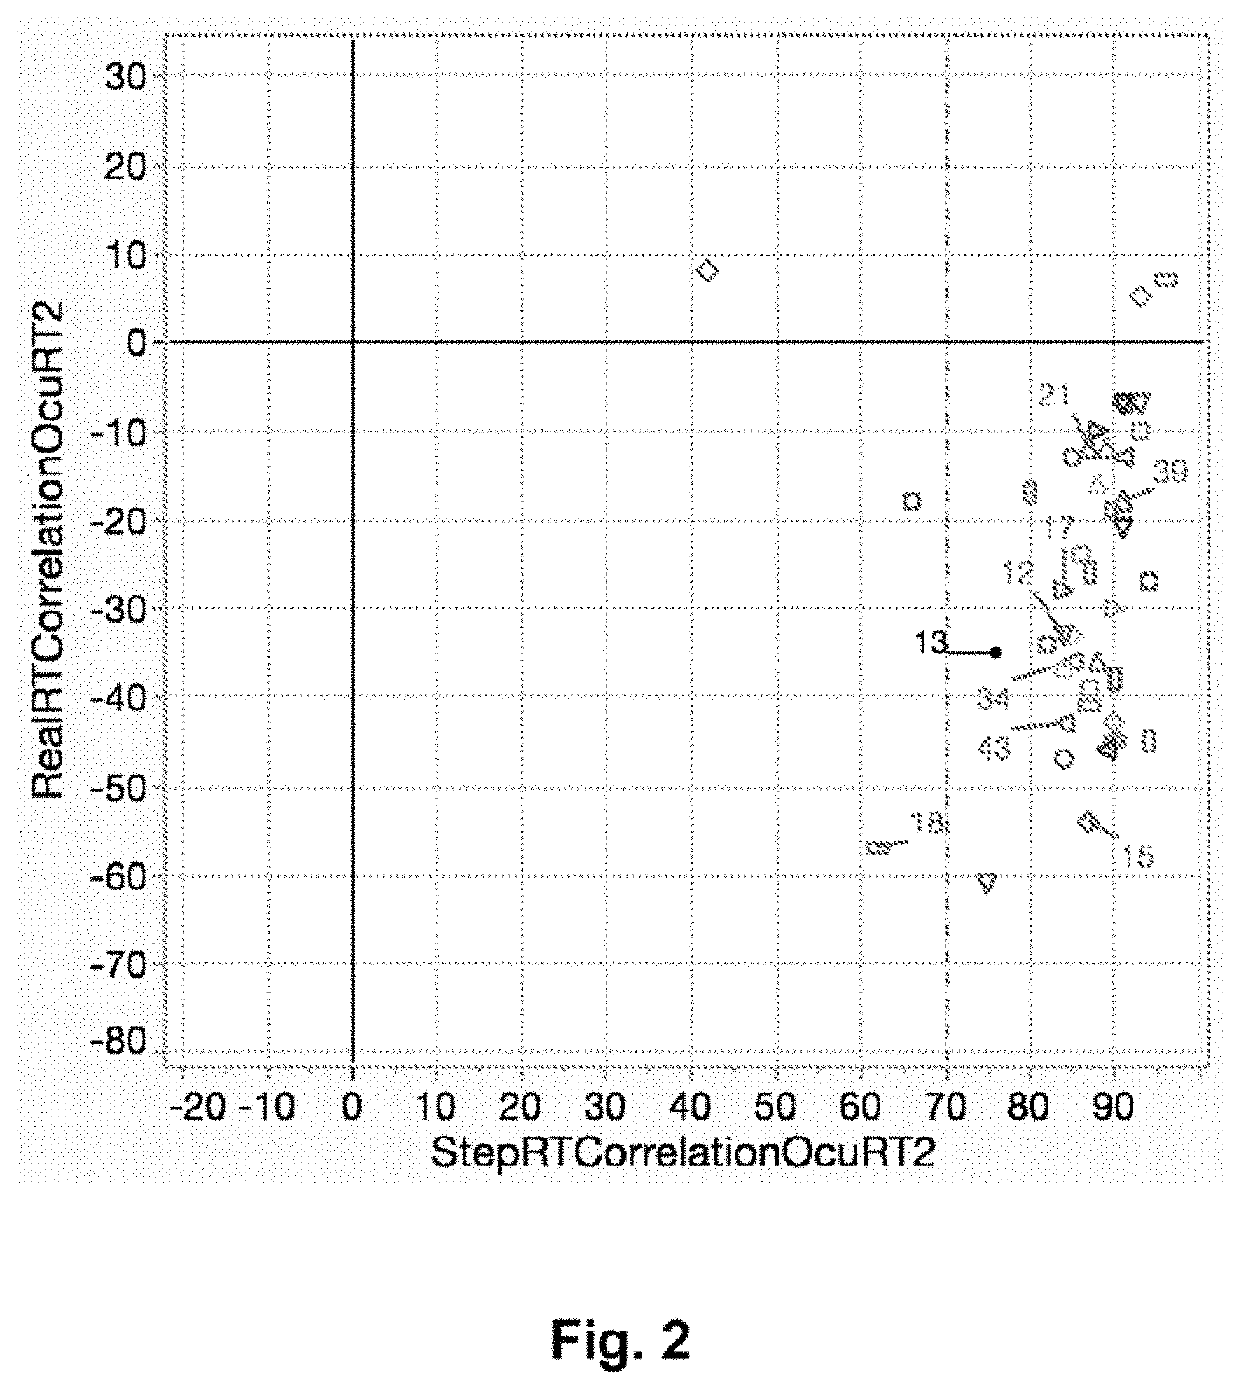
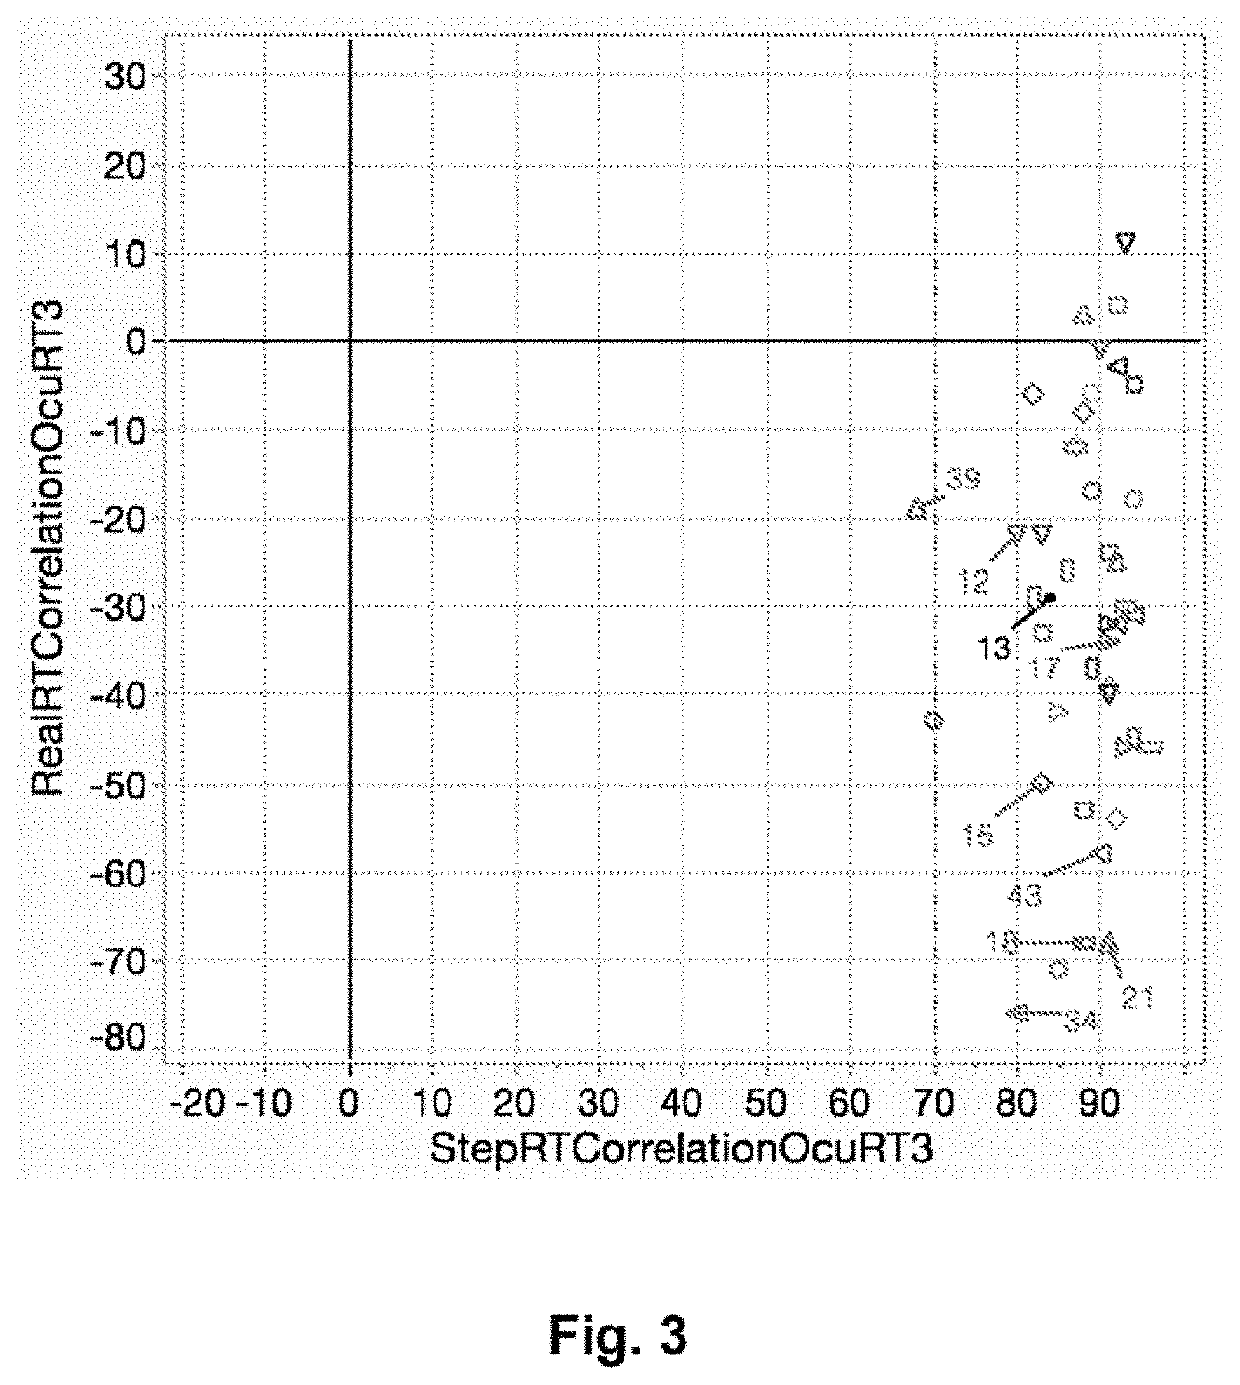
[0072]In order to find the cut off value for a reliable measurement, we studied the correlation coefficient in repeated measurements within one test subject to find out the effect of learning. Also, we compared the correlation coefficient among persons skilled in the test to results achieved during added cognitive load and deliberate malingering or cheating.

[0073]The test subjects were seated in front of an Ocusweep device and an Ocusweep tablet at a close distance, and an Ocusweep remote control was handed to them. In the test, the tablet displayed a series of black rings, which have an opening on the left or on the right side. The test subjects were advised to push either the left or right button of the remote control, depending on which side the opening was located, and they were told to do this as quickly as possible. They were also instructed not to guess and only answer when they see the opening. As a result of a wrong answer, a red circle appear...

example 2

for OcuRT Test Algorithm

[0084]A few possible examples for the OcuRT are as follows:

[0085]Left and right direction images or optotypes, such as standard Landolt-C, may be used as visual test stimuli. One example, a softened standard Landolt-C directed to the right, is shown in FIG. 6.

[0086]After each correct response by the test user, the visual test stimuli may by slightly moved on the screen, so that it will be more difficult for the user to make conclusions from “movement” of the test image direction.

[0087]If the test subject responds with a wrong response, e.g. presses a button with a wrong direction, a wrong response indicator image may be shown in place of the test image. The wrong response indicator image may be shown e.g. for 1 to 3 seconds, or for 2.5 seconds. An example of a wrong response indicator image, a ring, is shown in FIG. 7. The ring maybe e.g. red.

[0088]The response waiting timeout time may be set e.g. at 2 to 5 seconds, e.g. at 4 seconds. If the test user does no...


PUM


Abstract

The invention relates to a method and a system for evaluating reliability of results in a visual reaction test taken by a user. Method steps with following phases are repeated several times:A visual test stimulus with a recognisable value is shown to the user, at a stimulus time-point;The user reports when she recognises the stimulus value, at a reporting time-point;A variable and relatively short delay time is inserted between the visual stimuli;Reaction times between the stimulus time-points and the reporting time-points are recorded;Step times are calculated as a sum of the delay time and reaction time for each step.Correlation between step times and delay times or correlation between reaction times and delay times is compared with predefined correlation values for reliability and thereby the level of reliability of the results is determined.

Description

TECHNICAL FIELD OF THE INVENTION[0001]The invention relates to a method and a system for evaluating reliability of results in a visual reaction test. The invention especially relates to a new way to determine whether a visual reaction test user is not fully attentive, is cheating or hasn't fully learned the operating principle of the test.TECHNICAL BACKGROUND[0002]Measuring the properties of human vision requires a cooperative test person in contrary to devices which assess the structure of the eye or visual system or measures electrical responses from the neural pathways. In vision measurements, a standardized visual stimulus is usually displayed to be detected or recognized by the test person. A response for the visual stimulus is usually given by the test person with a button or verbally. This response can be saved either manually or automatically and, depending of the response, a next stimulus (easier or more difficult) is presented.[0003]This kind of methodology is called psych...

Claims


Application Information

Patent Timeline
Patent Type & Authority Patents(United States)
IPC IPC(8): A61B13/00A61B3/032A61B3/00A61B3/02
CPCA61B3/032A61B3/0041A61B3/02A61B5/162
Inventor MANTYSALO, TAPIOLEINONEN, MARKKUSUOMINEN, JAAKKOTIGCHELAAR, IRISJARVINEN, PEKKAMAATTA, ELIASPENTTILA, KAISAKUUTTI, ROOPELAHDENPERA, SAMULI
Owner OCUSPECTO
Learn More