
Low frequency DAS well interference evaluation

a low frequency das and well interference technology, applied in the field of low frequency das well interference evaluation, can solve the problems of only measuring well interference by chemical and radioactive tracers, the problem of increasing the problem of well interference, and the limitations of all these methods, so as to achieve the effect of increasing the calculated semblance accuracy

Active Publication Date: 2021-12-07
CONOCOPHILLIPS CO
View PDF107 Cites 5 Cited by
  • Summary
  • Abstract
  • Description
  • Claims
  • Application Information

AI Technical Summary

Benefits of technology

The patent describes a new method of improving the quality of low-frequency DAS data, which is used in seismic analysis. This method involves identifying and removing interference and noise from the data, which speeds up the analysis process and makes it more selective. The method is particularly useful in environments with varying temperatures and can be used in real-time monitoring of well temperature changes. Overall, this technique allows for more accurate and selective analysis of low-frequency DAS data.

Problems solved by technology

The ball-activated plug diverts fracture fluids through the perforations into the formation, where pressure build-up and eventually causes fracturing.
One undesirable result of a fracking program occurs when the fractures of one well reach to the fractures of a nearby well, causing interference.
Well interference has become an ever-increasing problem as the spacing between wells has significantly decreased in recent years.
However, all these methods have limitations.
Tracers can provide spatial information, but both chemical and radioactive tracers can only measure well interference during early production stages because of limited downhole survival time.
Microseismic surveys can only provide qualitative interpretations of the reservoir and the fractures, since there is no physical model that directly correlates microseismicity with fracture connectivity.
However, mapping fracture connections during completion cannot provide information of the connectivity during production of hydrocarbons.
Even incremental improvements in technology can mean the difference between cost effective production and reserves that are uneconomical to produce.

Method used


Image

  • Low frequency DAS well interference evaluation
  • Low frequency DAS well interference evaluation
  • Low frequency DAS well interference evaluation

Examples


Embodiment Construction

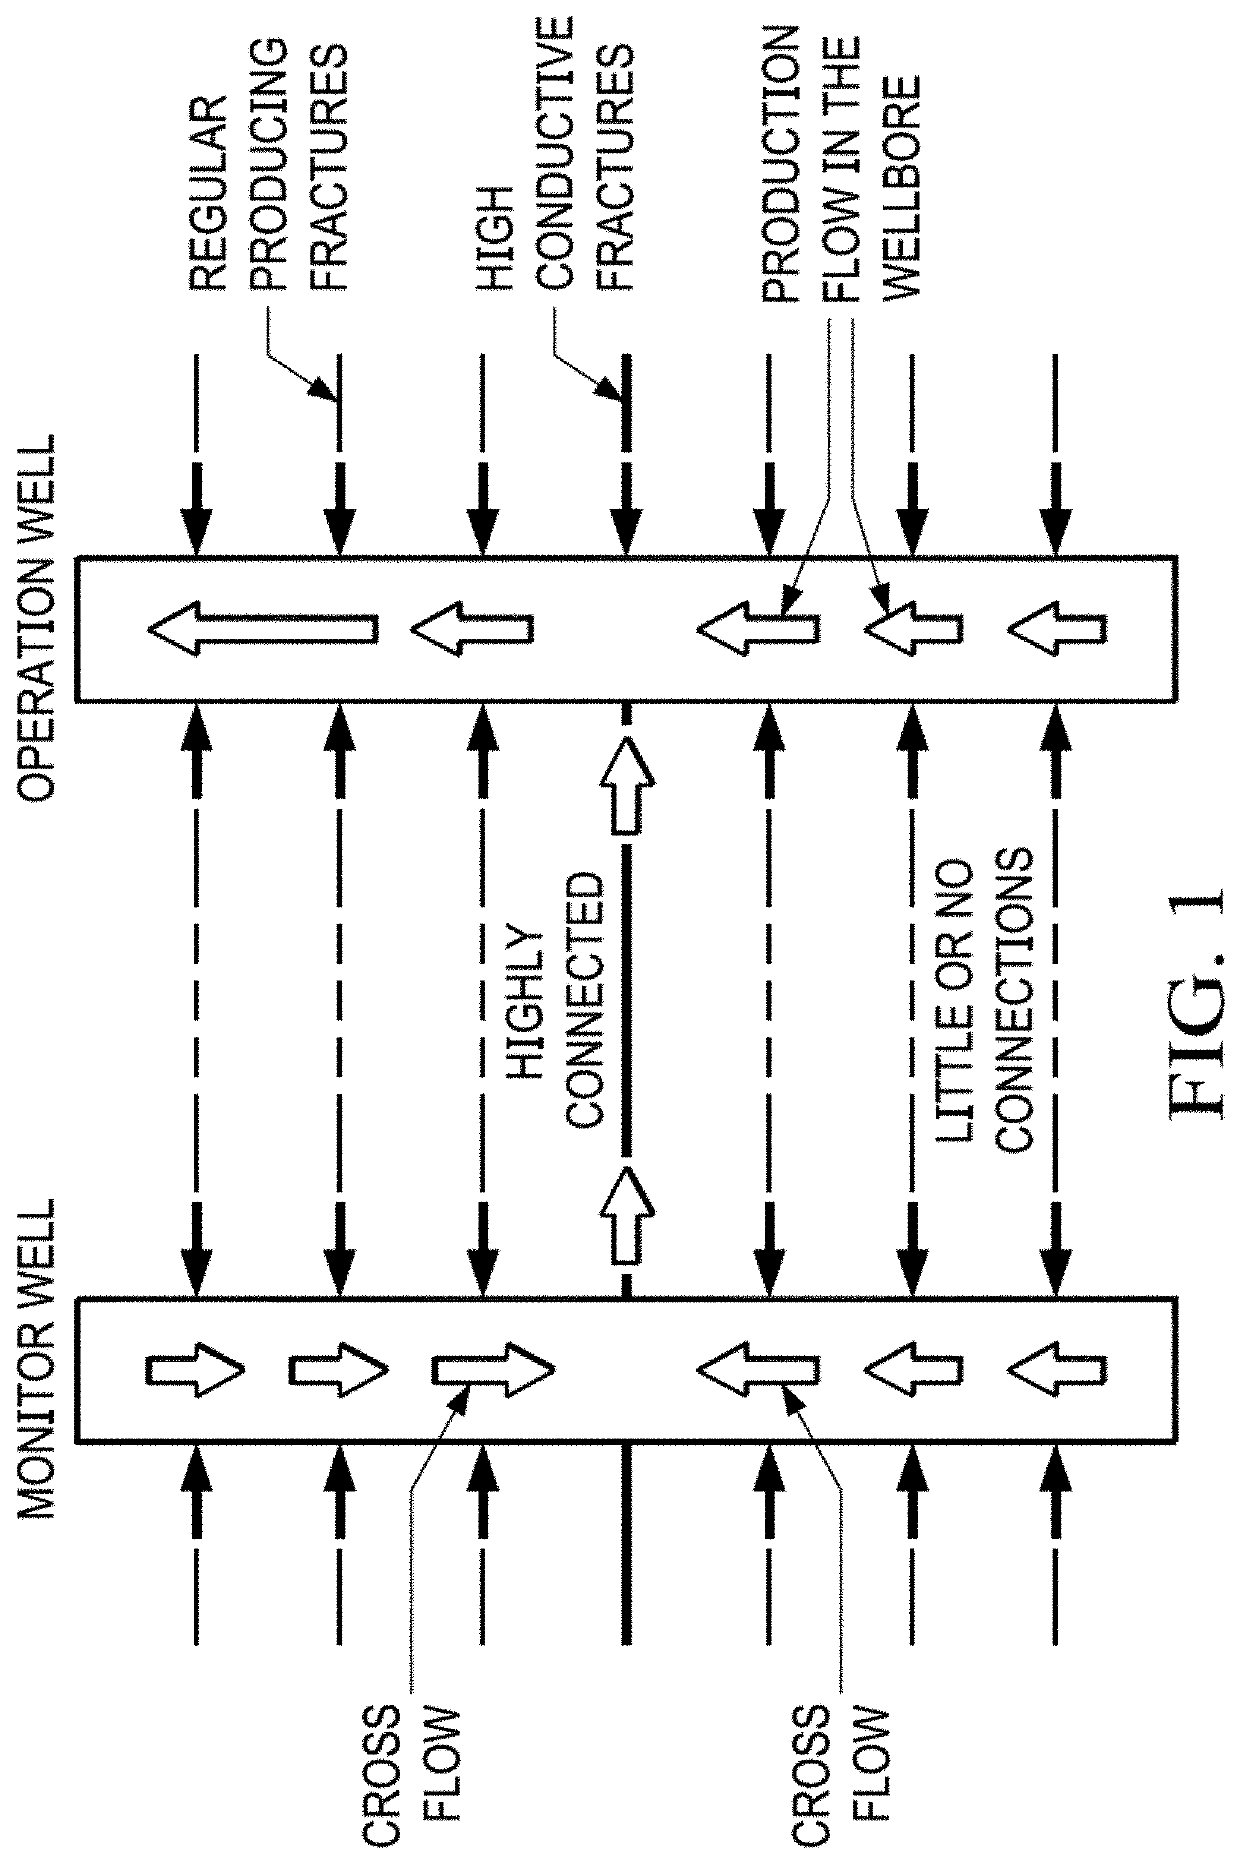
from two adjacent hydraulically fractured horizontal production wells. However, a similar procedure can be used for other kinds of wells.

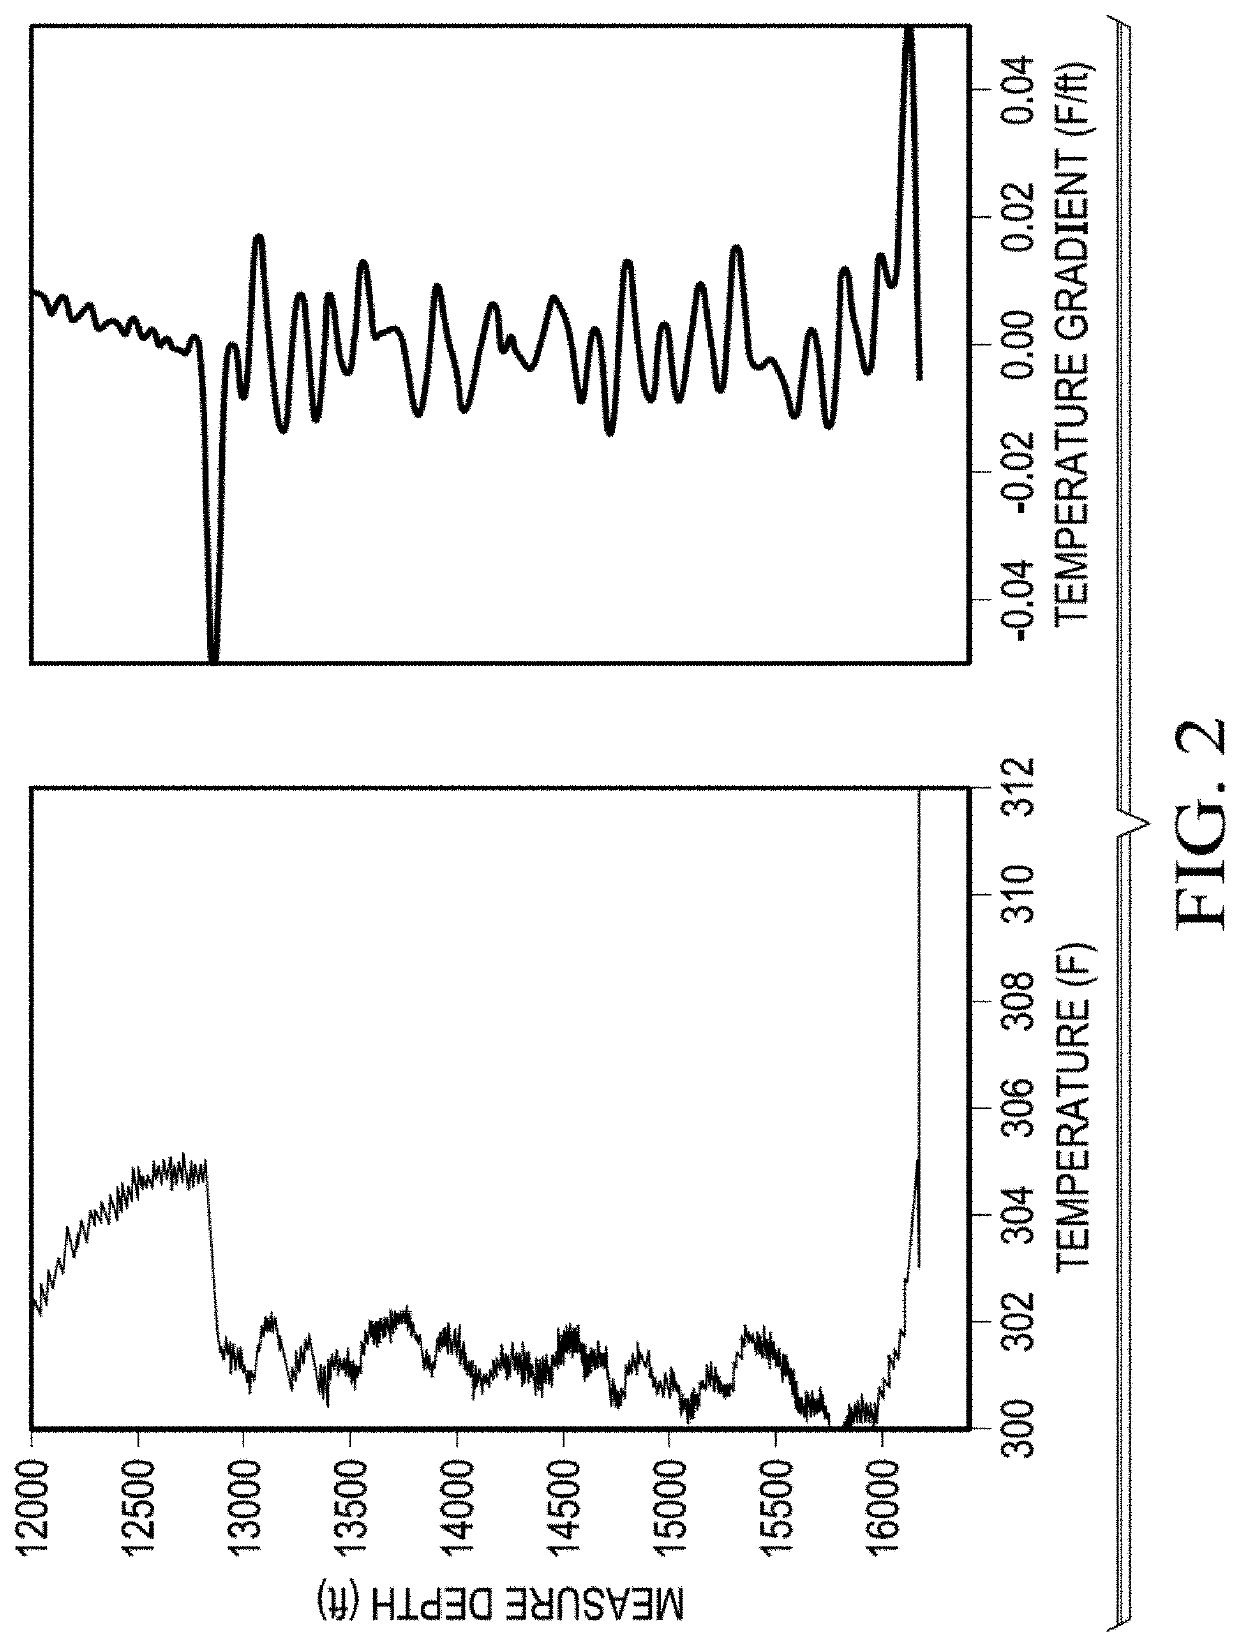
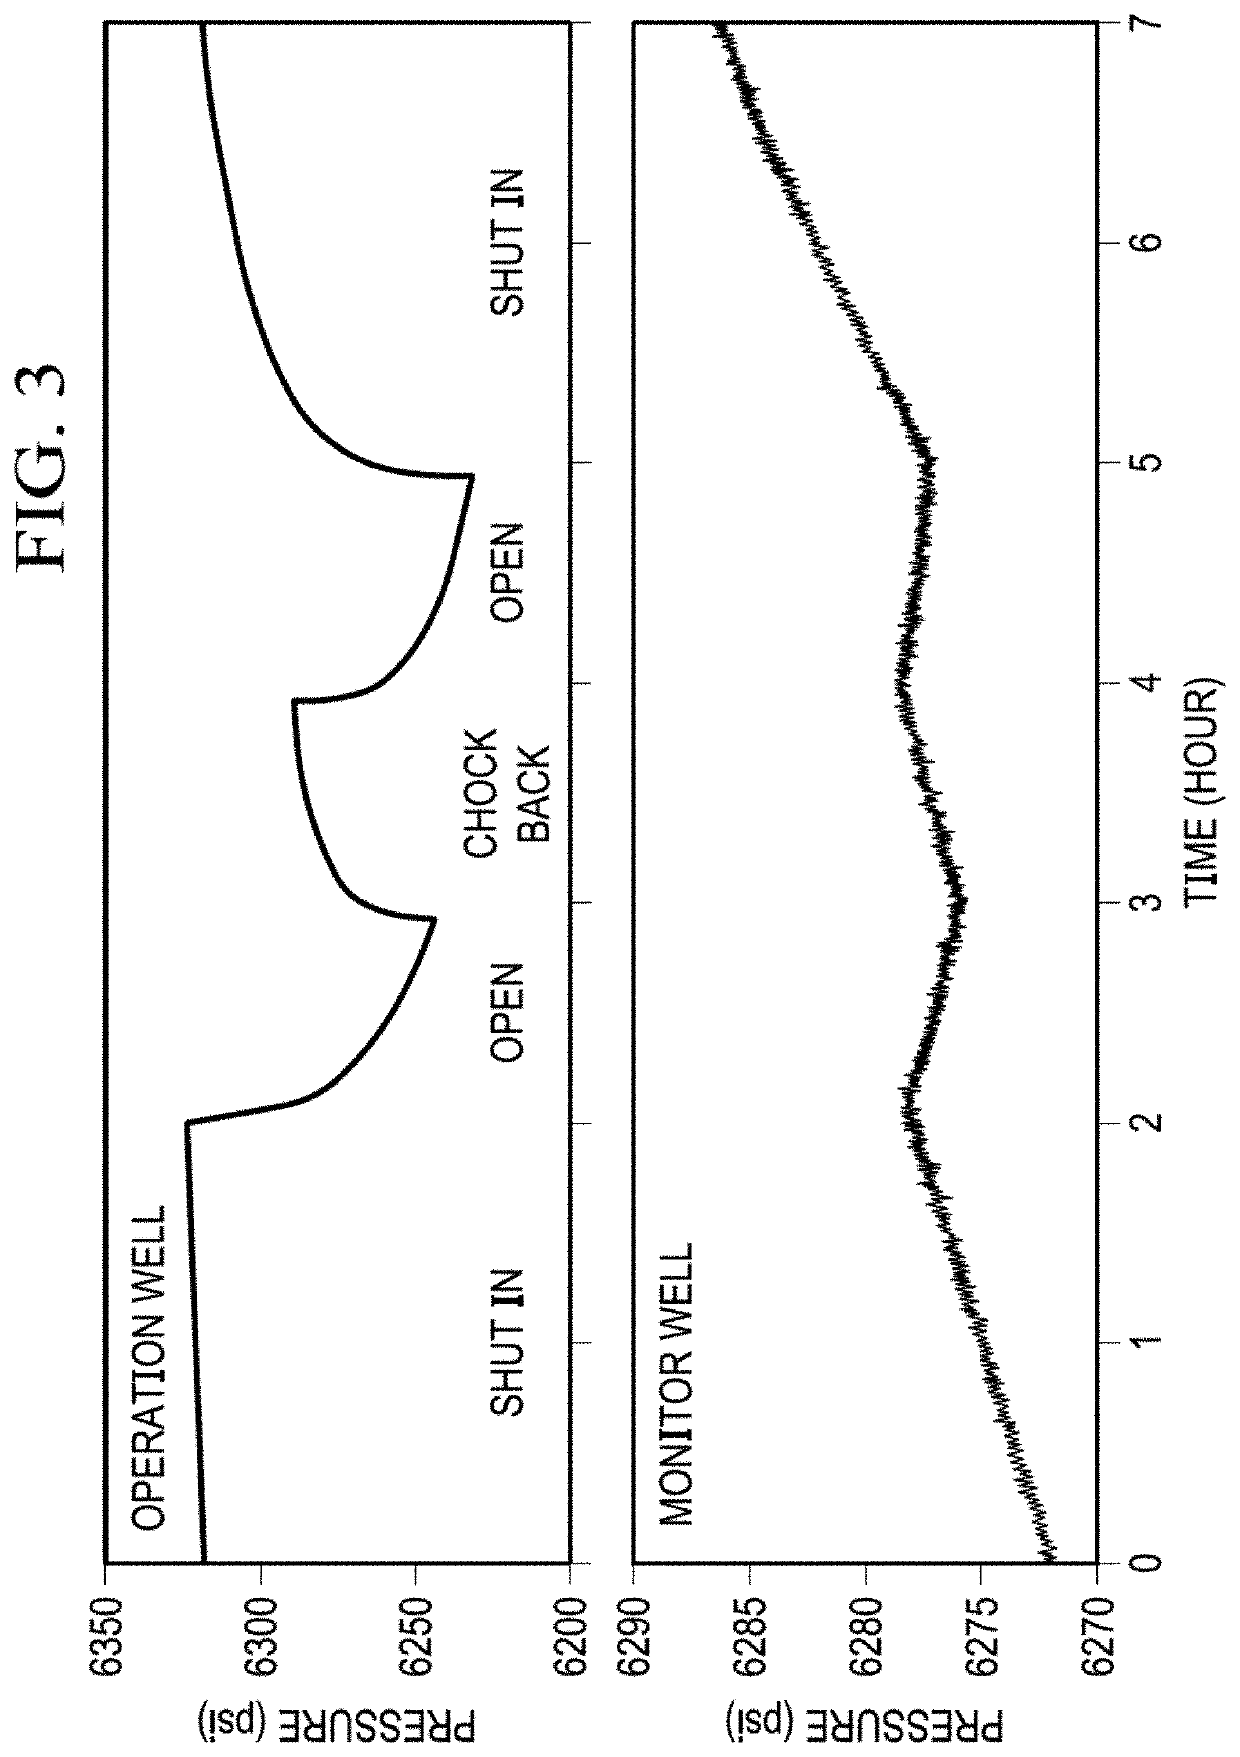
[0125]Because DAS is a strain rate sensor and the fiber is mechanically coupled with the formation, strain from the minute temperature variations caused by interference can be detected. The DAS data are recorded at an offset monitor well during production of an adjacent well. The fiber-optic cables are preferably installed outside the casing and cemented in place. The raw data are sampled at 10 kHz continuously at more than 6000 locations along the wellbore, with 1 m spatial sampling and 5 m gauge length. The recorded optical phase is differentiated in time, hence the DAS data are linearly correlated with the strain rate along the fiber.

[0126]The raw DAS data are down-sampled to 1 s after a low-pass anti-aliasing filter (0-0.5 Hz) is applied. The data are then median filtered to remove any spiky noise. Another low-pass filter with a corner frequenc...


PUM


Abstract

A method of assessing cross-well interference and / or optimizing hydrocarbon production from a reservoir by obtaining low frequency DAS and DTS data and pressure data from a monitor well, when both the monitor and production well are shut-in, and then variably opening the production well for production, and detecting the temperature and pressure fluctuations that indication cross-well interference, and localizing the interference along the well length based on the low frequency DAS data. This information can be used to optimize well placement, completion plans, fracturing plans, and ultimately optimize production from a given reservoir.

Description

PRIOR RELATED APPLICATIONS[0001]This application claims priority to U.S. Ser. No. 62 / 649,346, filed Mar. 28, 2018, and incorporated by reference in its entirety for all purposes.FIELD OF THE DISCLOSURE[0002]The disclosure relates generally to methods of assessing cross well interference using Distributed Temperature Sensing (DTS), Distributed Acoustic Sensing (DAS), and pressure data.BACKGROUND OF THE DISCLOSURE[0003]Unconventional reservoirs include reservoirs such as tight-gas sands, gas and oil shales, coalbed methane, heavy oil and tar sands, and gas-hydrate deposits. These reservoirs have little to no porosity, thus the hydrocarbons may be trapped within fractures and pore spaces of the formation. Additionally, the hydrocarbons may be adsorbed onto organic material of a e.g. shale formation. Therefore, such reservoirs require special recovery operations beyond the conventional operating practices in order to mobilize and produce the oil.[0004]The rapid development of extracting...

Claims


Application Information

Patent Timeline
Patent Type & Authority Patents(United States)
IPC IPC(8): E21B47/107E21B47/06E21B47/07E21B43/26G01V1/42G01H9/00E21B47/135
CPCE21B47/107E21B47/06E21B47/07E21B43/26E21B47/135G01H9/004G01V1/42G01V2210/646E21B47/10G01V2001/526G01V1/208G01V2210/1234G01V2210/1299G01V2210/1429
Inventor JIN, GEKRUEGER, KYLE RROY, BAISHALI
Owner CONOCOPHILLIPS CO
Learn More