Leukemia diagnostic kit targeting prohibitin gene and diagnostic method using same
a technology of leukemia and diagnostic kit, which is applied in the direction of microbiological testing/measurement, biochemistry apparatus and processes, etc., can solve the problems of difficult to diagnose leukemia more quickly and difficult to precisely determine the progression of the diseas
- Summary
- Abstract
- Description
- Claims
- Application Information
AI Technical Summary
Benefits of technology
Problems solved by technology
Method used
Image
Examples
example 1
nt of Gene Expression Level by PCR
[0102](1) Step 1: Collection of White Blood Cells from Peripheral and Bone Marrow Specimens
[0103]Plasma was removed by centrifugation of whole blood at 3,500 rpm for 15 minutes, PBS (pH 7.4) was added to have a total volume of 5 mL, 3 ml of Lymphoprep was added thereto and then slowly mixed, and then the resulting mixture was centrifuged at 1,500 rpm for 30 min, thereby recovering a white blood cell (WBC) layer.
[0104]Sequentially, after adding PBS (pH 7.4) to have a total volume of 7 ml, the mixture was slowly mixed, and centrifuged at 1,500 rpm for 10 minutes to remove a supernatant, and then only a pellet (cells) was recovered.
[0105](2) Step 2: RNA Extraction
[0106]In the present invention, an AMBION kit (RNAqueous phenol-free total RNA isolation_AM1912) was used.
[0107]500 μl of a lysis / binding sol. was added to a specimen and subjected to vortex mixing, followed by the addition of 500 μl of 64% ethanol (the same amount of the lysis / binging sol.). ...
example 2
of Measured Values and Diagnosis
[0130](1) Diagnosis of Leukemia Using PHB2 Expression Level
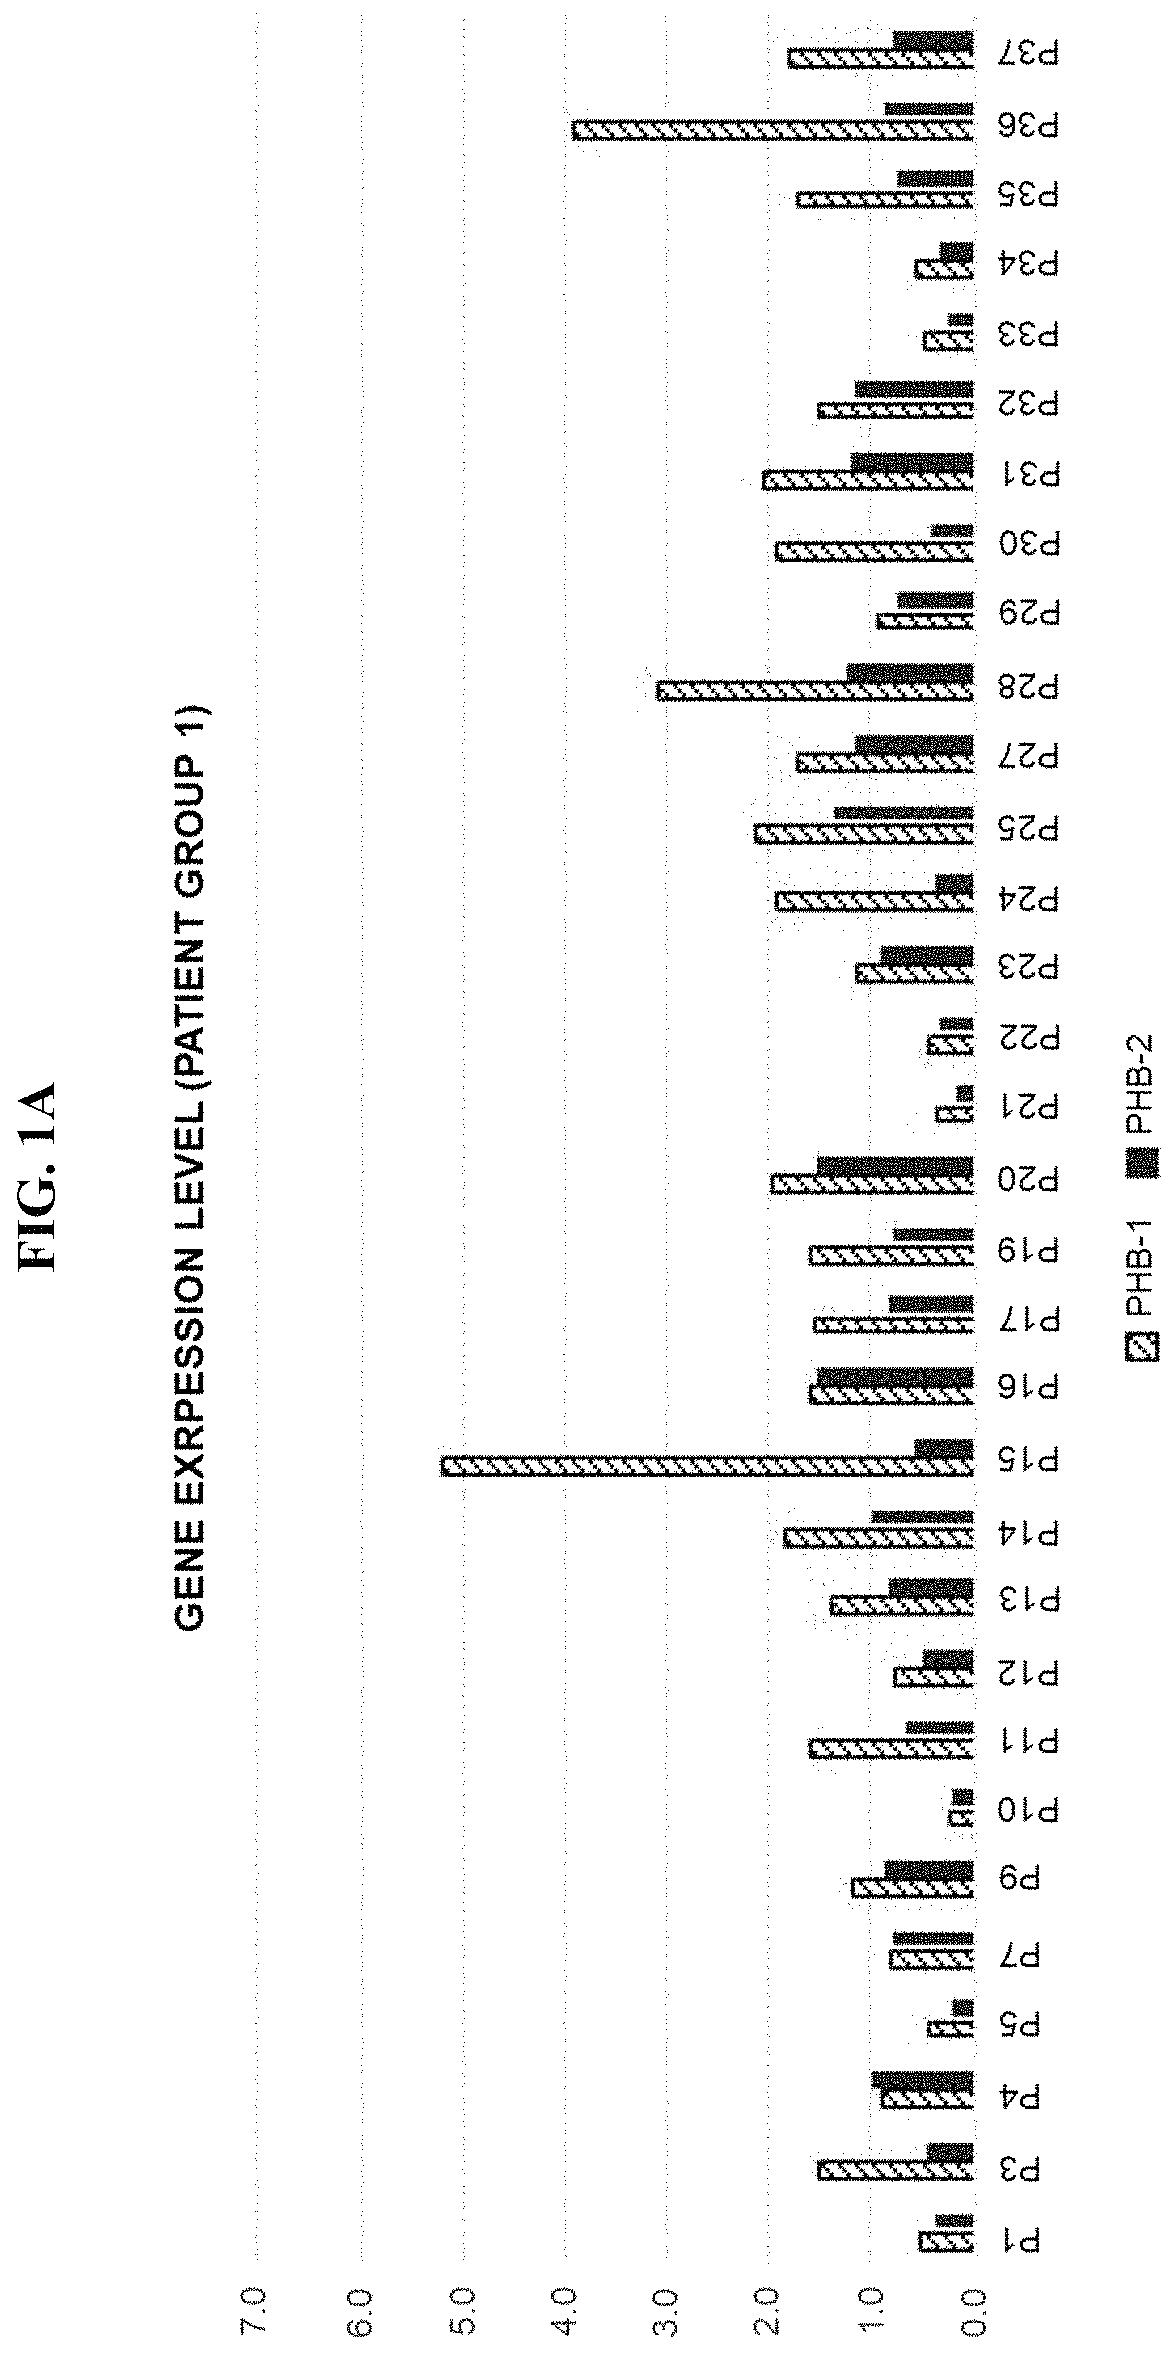
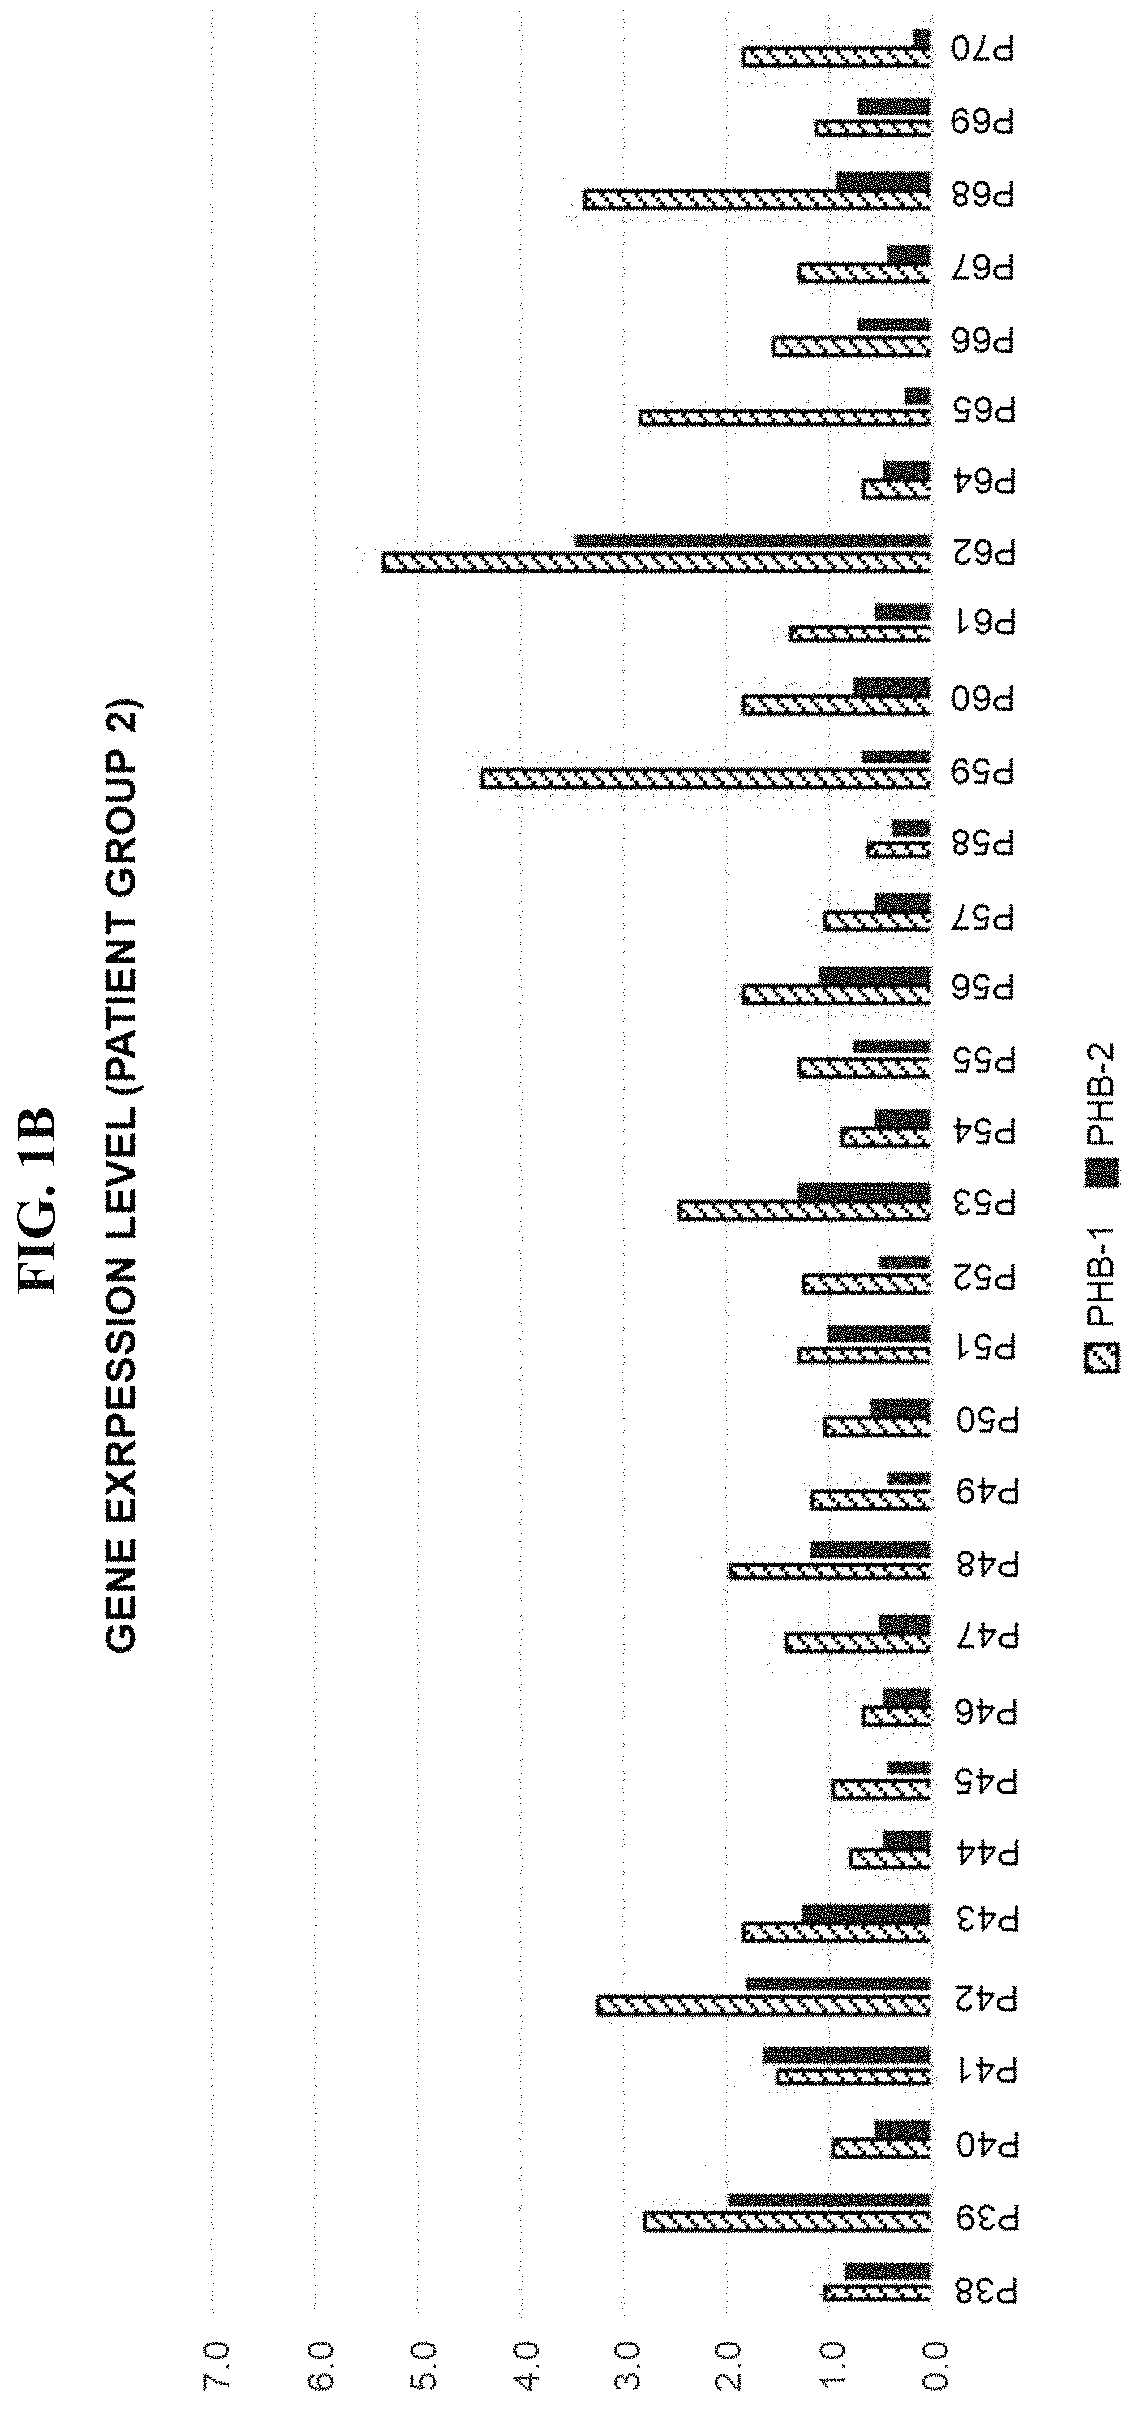
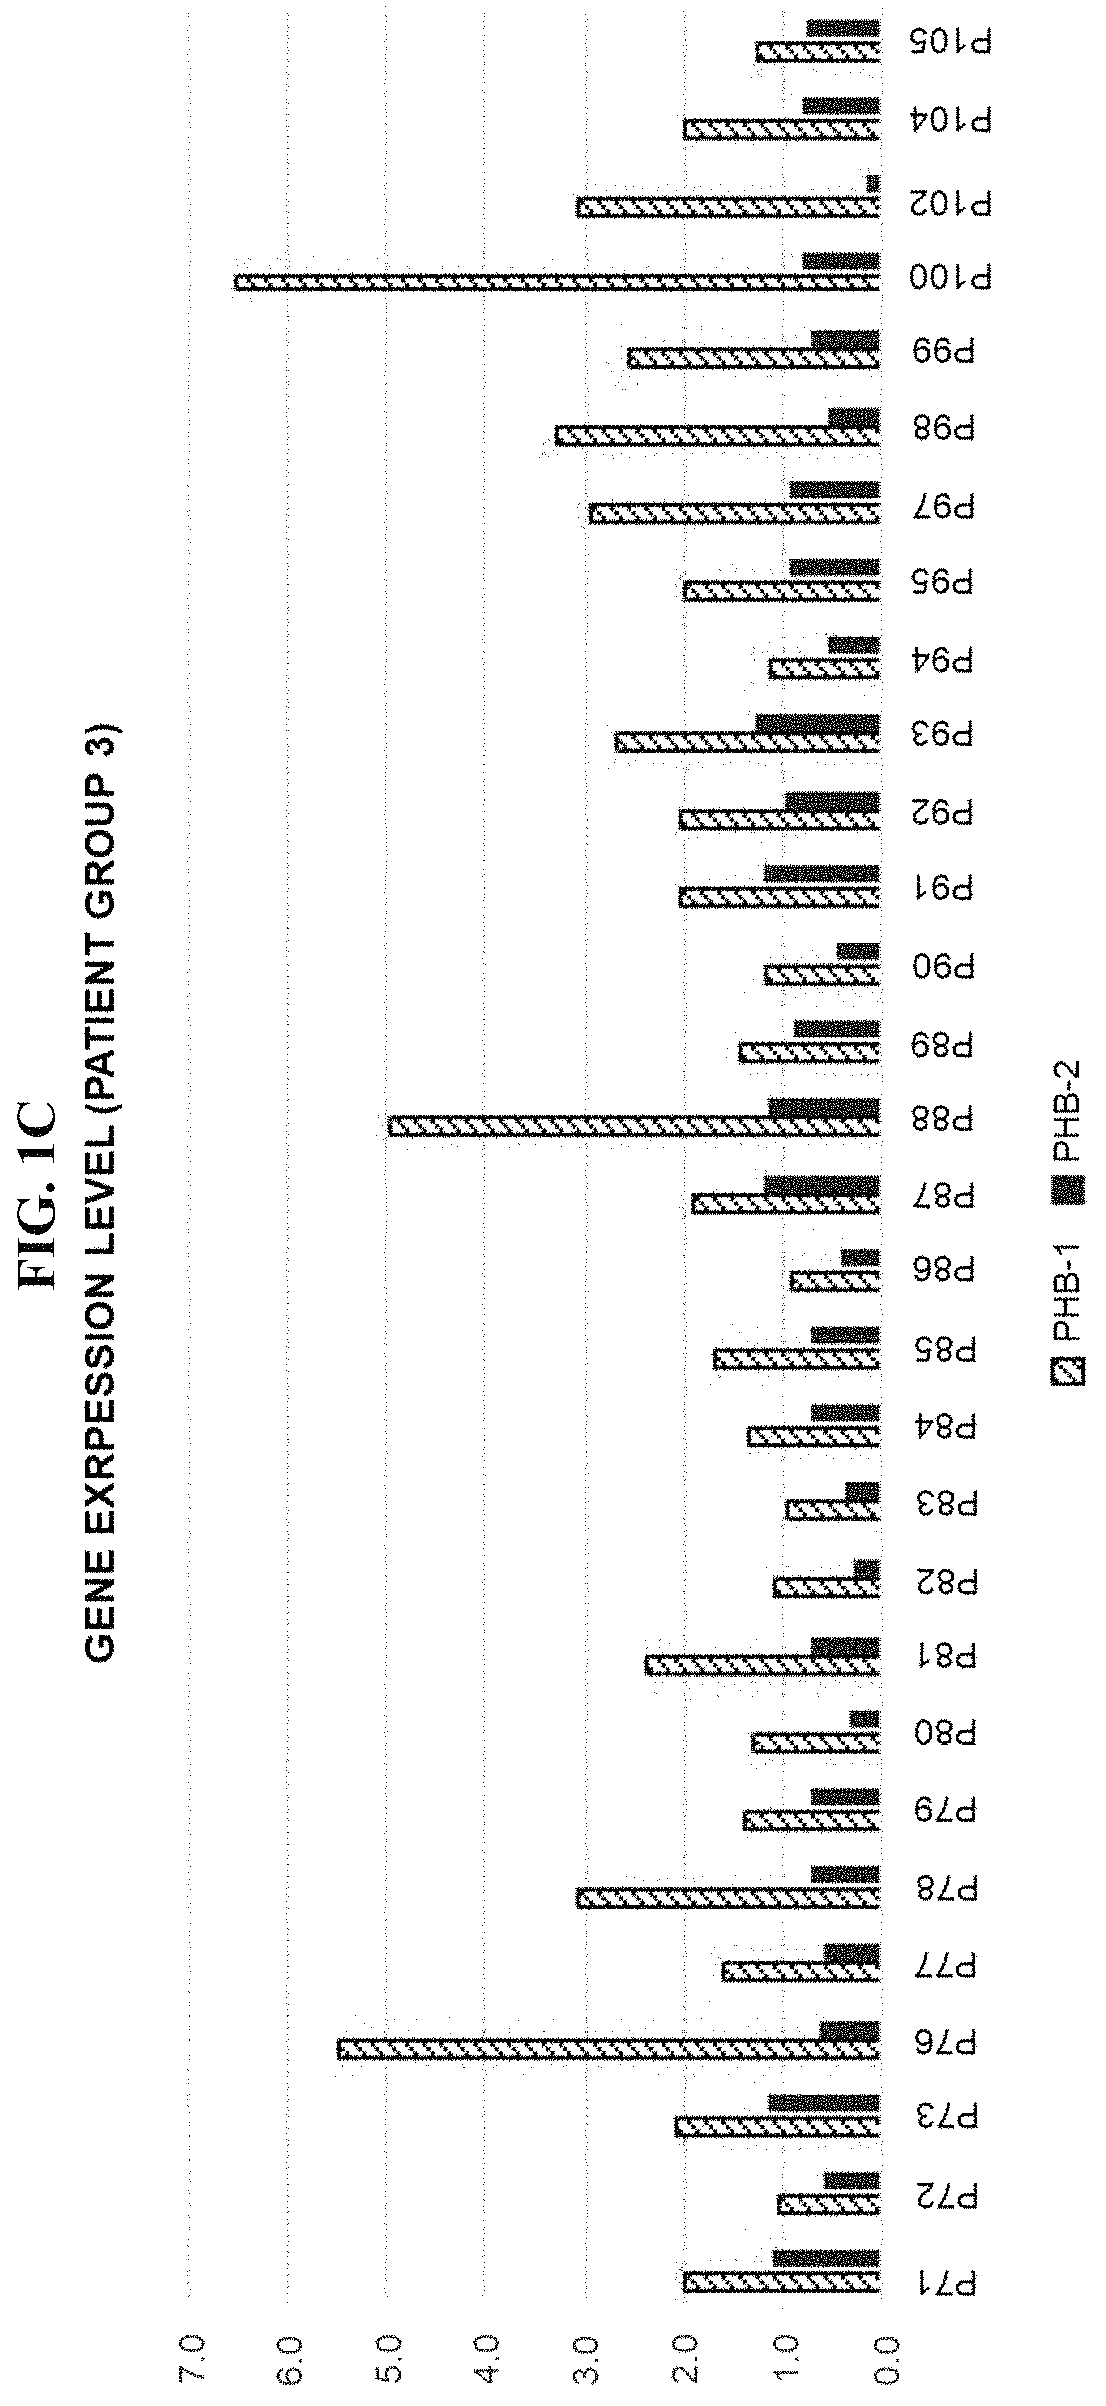
[0131]To significantly distinguish “patient” and “normal” according to PHB1 and PHB2 expression levels shown in Tables 2 and 3, measured values were analyzed by Equation 4 below.
[0132]FIG. 3A shows only the PHB2 expression levels confirmed in Tables 2 and 3, and then, to eliminate difficulty in observation caused by overlapping generated when single values are present on one axis, for convenience, the patient group is represented on the line of 1.0 of the vertical axis, and the normal group is represented on the line of 0.5 of the vertical axis, and as a result of enlarging only the region in which PHB2 values of the normal group and the patient group overlap in FIG. 3B, it was confirmed that the region represented by the dotted line is the overlapping section (0.14˜0.47).
[0133]In the overlapping region, three vertical lines (0.2, 0.315, 0.435) in FIG. 3B represent the examples of boundary val...
PUM
| Property | Measurement | Unit |
|---|---|---|
| total volume | aaaaa | aaaaa |
| total volume | aaaaa | aaaaa |
| pH | aaaaa | aaaaa |
Abstract
Description
Claims
Application Information
 - R&D
- Intellectual Property
- Life Sciences
- Materials
- Tech Scout
- Unparalleled Data Quality
- Higher Quality Content
- 60% Fewer Hallucinations
Browse by: Latest US Patents, China's latest patents, Technical Efficacy Thesaurus, Application Domain, Technology Topic, Popular Technical Reports.
© 2025 PatSnap. All rights reserved.Legal|Privacy policy|Modern Slavery Act Transparency Statement|Sitemap|About US| Contact US: help@patsnap.com


