Apparatus and method for detection and quantification of oscillatory signals
a technology of oscillatory characteristics and apparatus, applied in the field of apparatus and method for detection and quantification of oscillatory characteristics, can solve the problems of large and rapid regular or irregular fluctuations in frequency and amplitude, false positive or negative detection of measured characteristics of measurement of signals like biological signals, and prone to noise, etc., to achieve the effect of increasing accuracy
- Summary
- Abstract
- Description
- Claims
- Application Information
AI Technical Summary
Benefits of technology
Problems solved by technology
Method used
Image
Examples
second embodiment
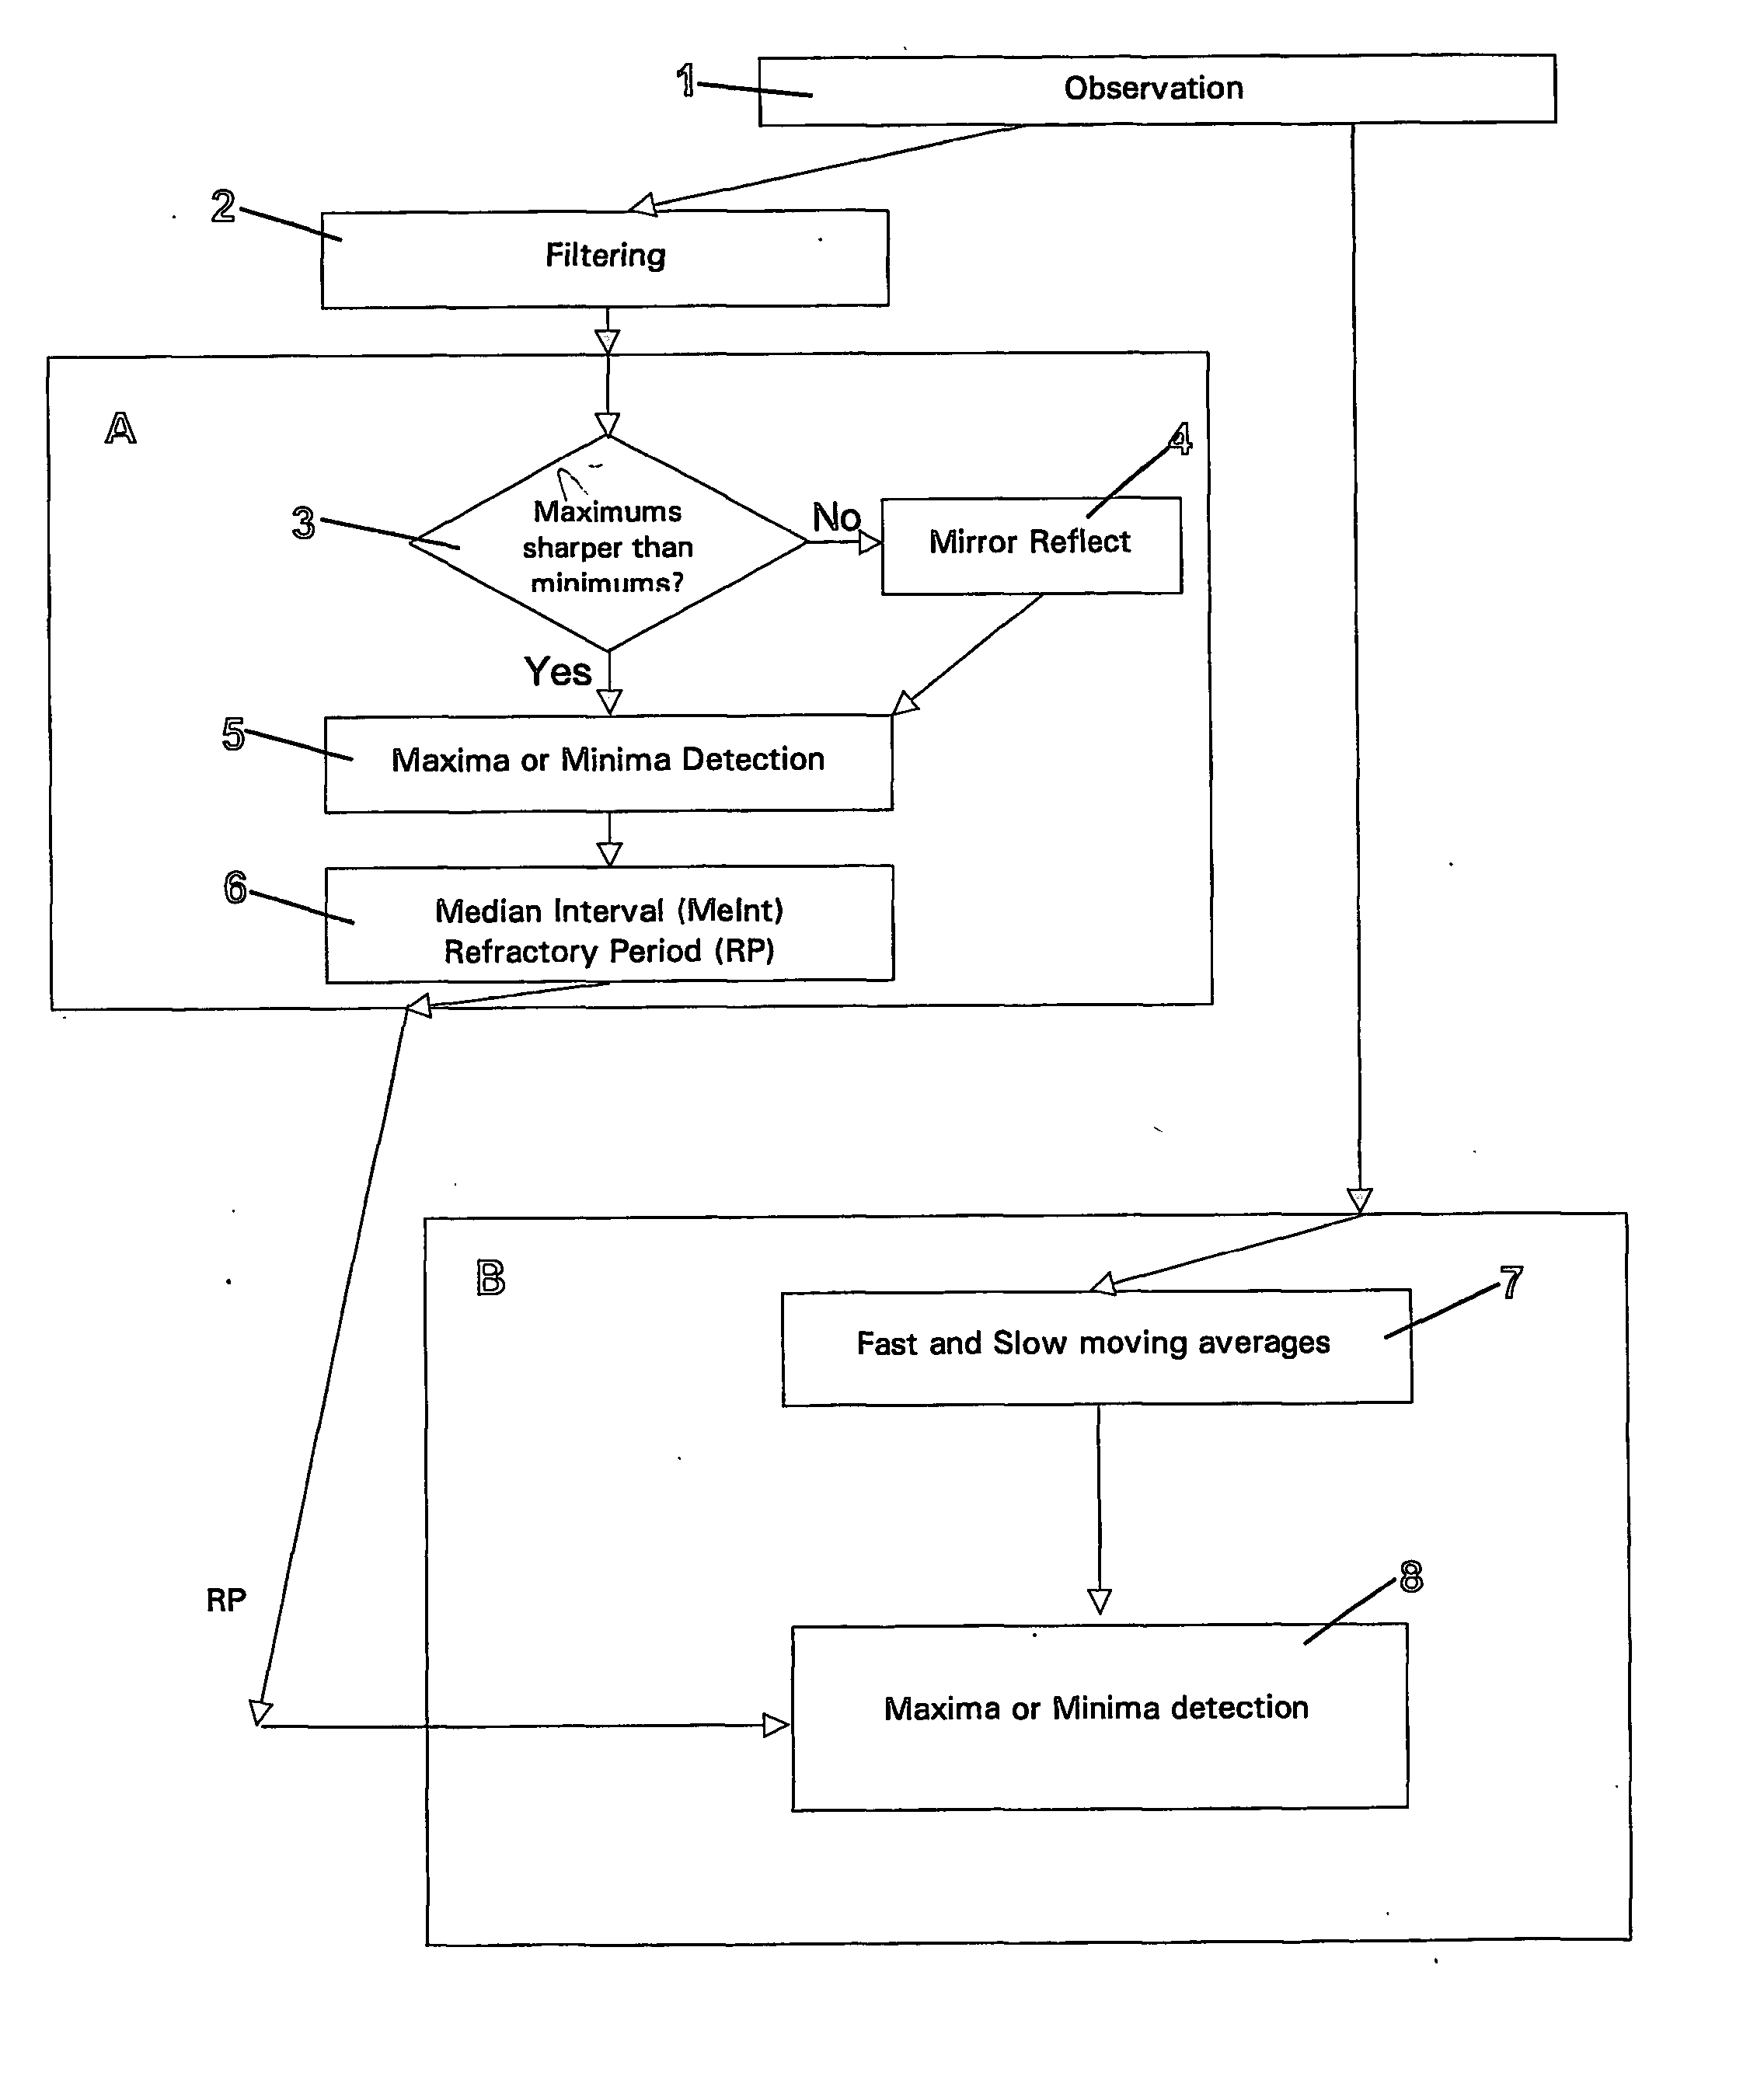
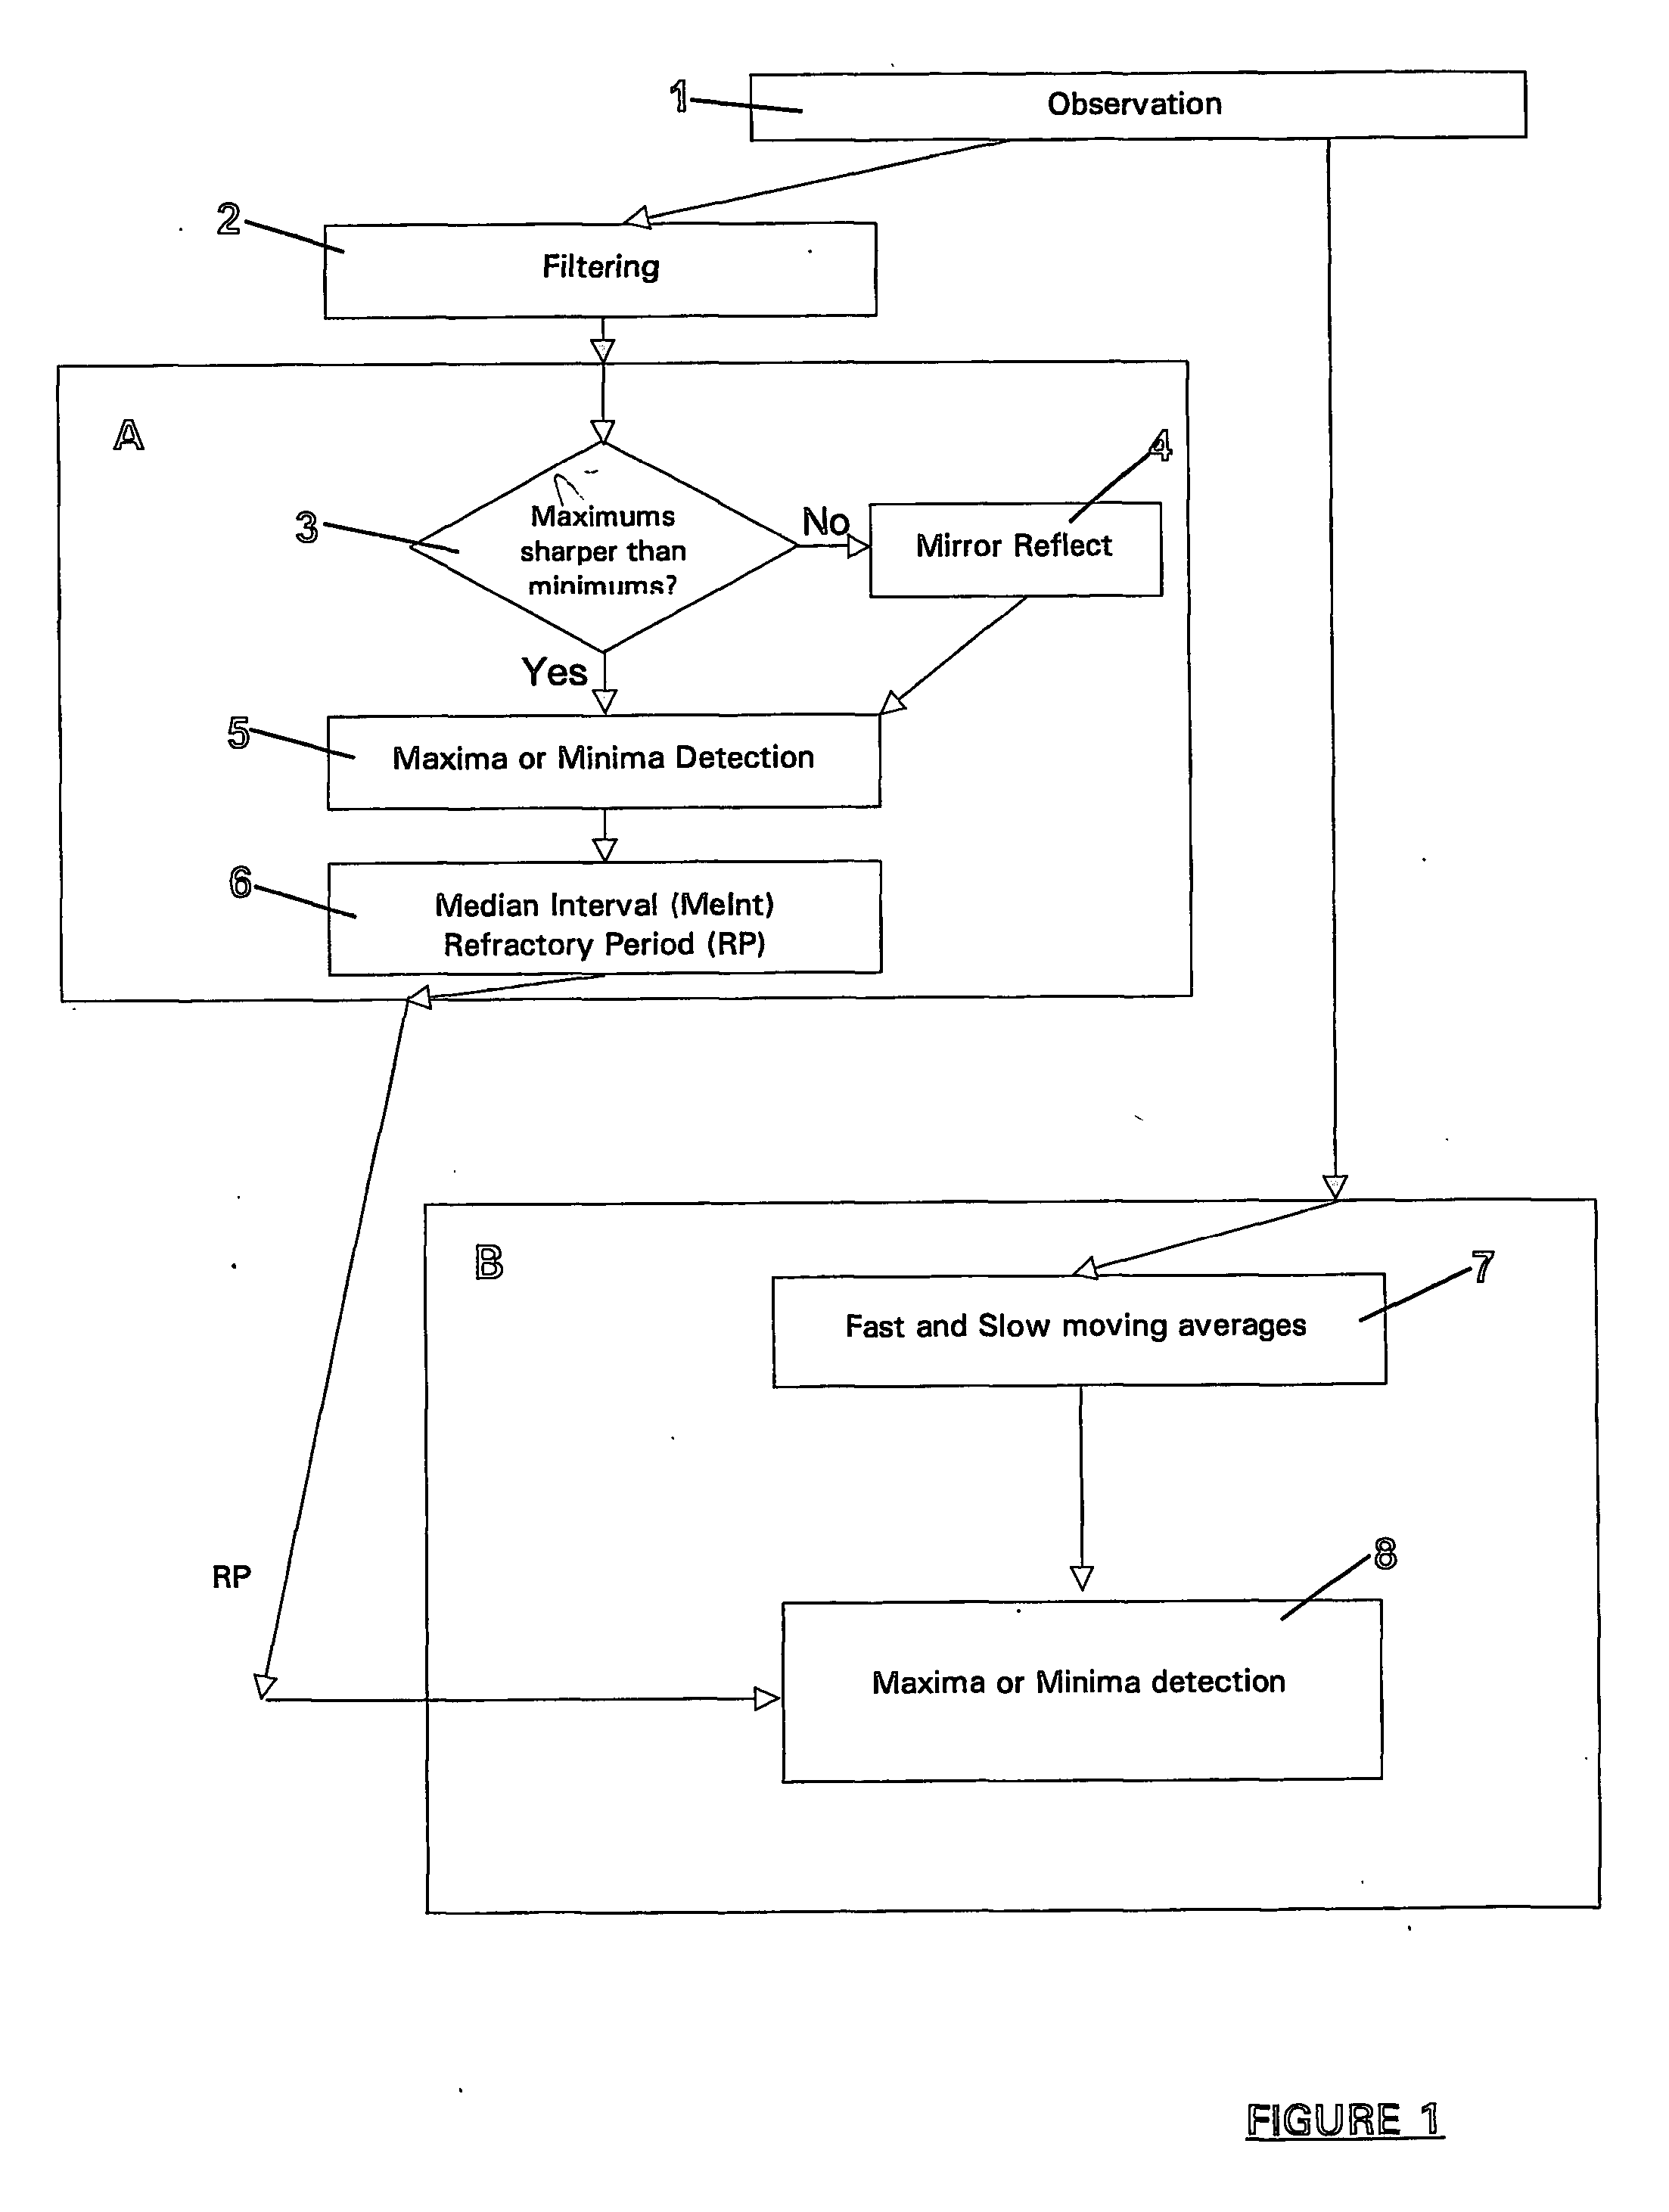
[0119] Referring again to FIG. 1, once the median interval MeInt has been determined, the refractory period (RP) as a fraction of MeInt is calculated. The fraction is chosen from experience and a suitable value has been found to be 0.7, although this may be varied depending on the signal characteristics. This is discussed in more detail herein below in relation to the Next, final detection, represented by the steps within box B may be completed. Final detection includes of the analysis of the original signal by producing two moving averages in step 7. A fast and a slow moving average is calculated, with a shorter and longer averaging time interval respectively. Any appropriate average may be used such as the arithmetic mean or median value for the moving averages.
[0120] Using moving averages provides a means of detection independent of baseline movement as well as allowing for noise in the signal to be ignored. Analysing the moving averages on a point-by-point basis in step 8, the ...
first embodiment
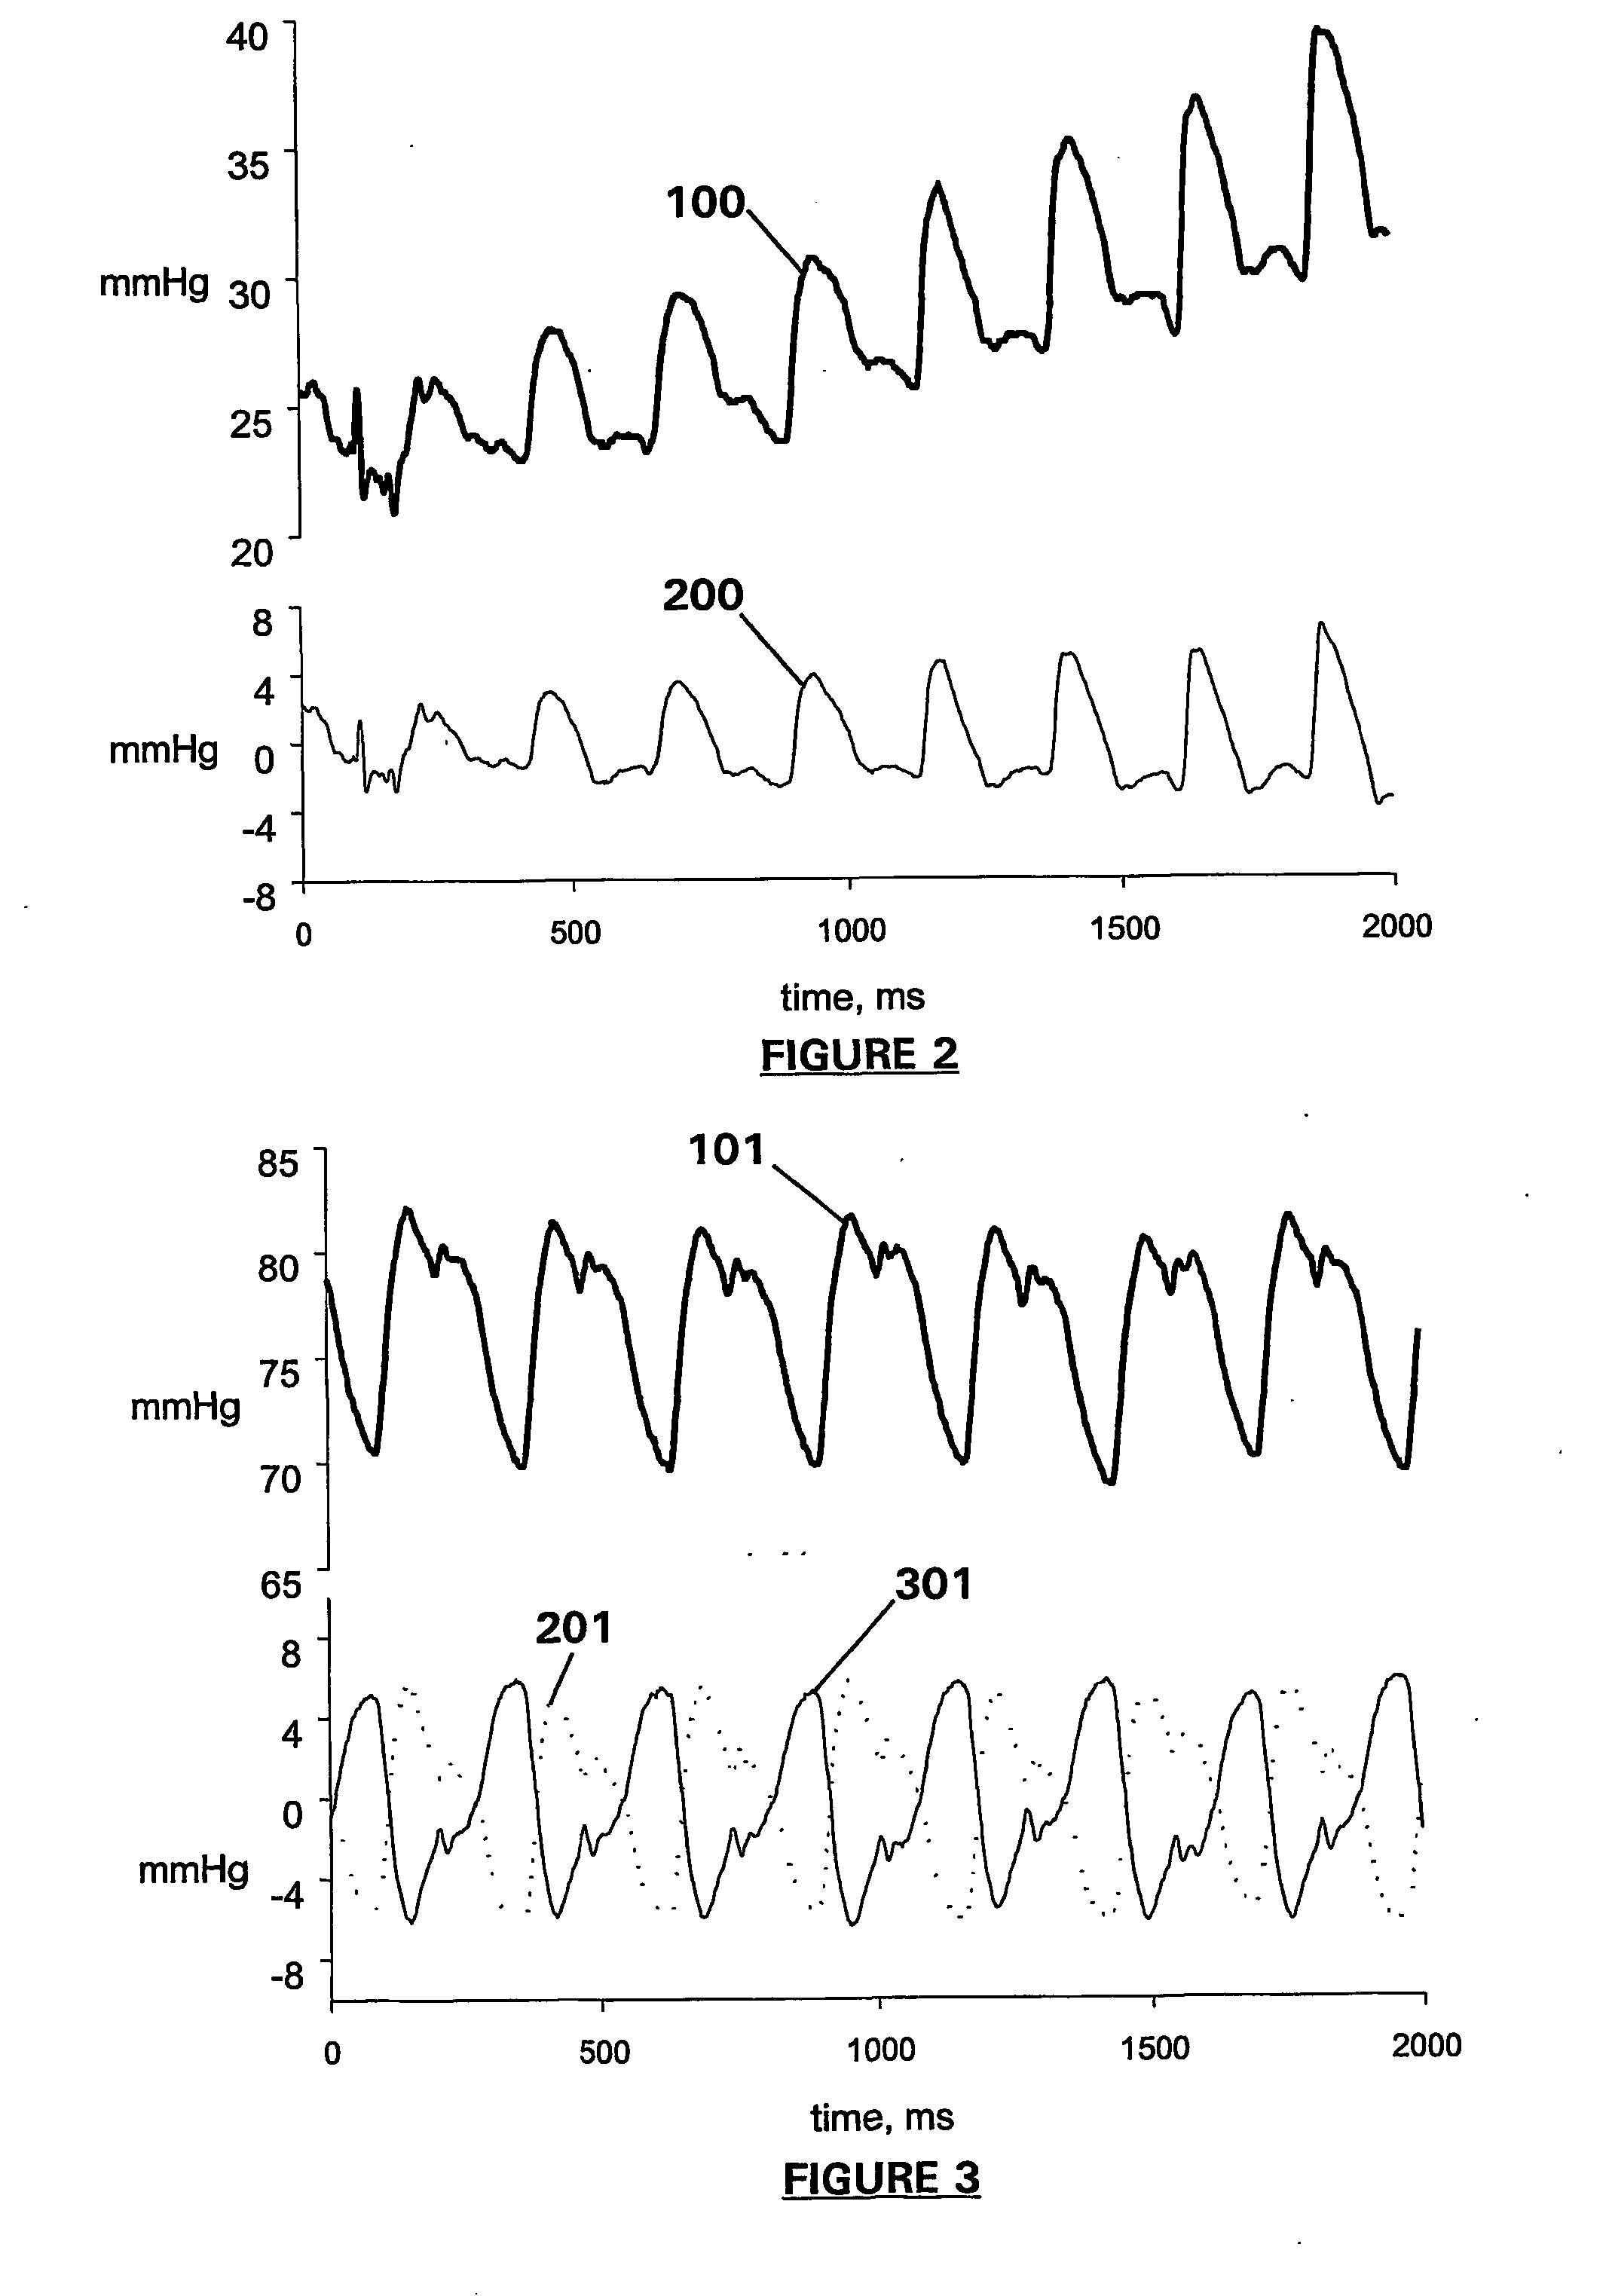
[0145] Final detection includes the steps within box D of FIG. 13 and like the first embodiment includes the analysis of the original signal by means of producing two moving averages, a fast and slow moving average with shorter and longer averaging time interval. A 40 ms and 100 ms averaging time interval has been found suitable for the examples herein. The pilot value for the slow moving average might again be the shortest interval between signal peaks (100 ms for 600 beat per mean in rabbit), and the fast averaging interval 2-3 times shorter. The point where fast (F) moving average becomes bigger, than slow (S) moving average is determined as a before peak intersection (BPI) of the moving averages. The point where fast moving average becomes smaller, than slow moving average is determined as an after peak intersection (API) of the moving averages.
[0146] The API is equivalent to the APCP of the first embodiment, the change in terminology simply included to clarify the two alternati...
PUM
 Abstract
Description
Claims
Application Information
 - R&D
- Intellectual Property
- Life Sciences
- Materials
- Tech Scout
- Unparalleled Data Quality
- Higher Quality Content
- 60% Fewer Hallucinations
Browse by: Latest US Patents, China's latest patents, Technical Efficacy Thesaurus, Application Domain, Technology Topic, Popular Technical Reports.
© 2025 PatSnap. All rights reserved.Legal|Privacy policy|Modern Slavery Act Transparency Statement|Sitemap|About US| Contact US: help@patsnap.com


