Quality and condition monitoring based on spectrum separating measurement

a spectrum separation and quality monitoring technology, applied in the direction of instruments, nuclear elements, nuclear engineering, etc., can solve the problems of increasing the complexity of measurement equipment, affecting the measurement result naturally, and limited the number of spectral bands being examined in practi

Inactive Publication Date: 2005-01-27
METSO AUTOMATION OY
View PDF8 Cites 10 Cited by
  • Summary
  • Abstract
  • Description
  • Claims
  • Application Information

AI Technical Summary

Benefits of technology

[0017] It is a particular aim of the invention to make it possible to observe more accurately than in prior art, and reliably identify fast phenomena, which appear only momentarily in the so called machine direction in the process. The invention is also applicable, however, for analysing more continuous phenomena. A very significant advantage of the invention is that the cause of failures in the process can now be identified by means of the invention in an easier and more reliable way than in prior art. Thus, the invention makes it possible to implement a highly automated control of quality and condition.
[0018] To attain these purposes, the method according to the invention is primarily characterized in what will be presented in the characterizing part of the independent claim 1.
[0019] The other, dependent claims will present some preferred embodiments of the invention.
[0020] The essential basic idea of the invention is that temporally and spatially resolved spectral data is collected with the optical spectrum separating measurement device from a moving object, i.e. a web or an element involved in handling it, in a manner synchronized with the movement of said object. On the basis of this spectral data, a two-dimensional “quality variable chart” is formed, which chart is further substantially continuous in the direction of movement and describes at least one quality variable.
[0021] In this context, the two-dimensional quality variable chart refers to a method of storing data, in which the data is stored in a coordinate system, its first axis describing a point in the cross-direction of the object (such as, for example, the web), and the second axis of the coordinate system describing a point in the direction of movement of the object. At each point, which is determined with the help of said two coordinates data on the value of said quality variable is stored.
[0022] Said quality variable can be, for example, the moisture level of the web or the amount of coating of the web, which quality variables are determined from the web on the basis of, for example, transmission and spectrum separated reflection measurements, which are carried out on the infrared range. Thus the quality variable chart reveals, for example, changes in the moisture level of the web at different points of the web in machine direction and cross-direction.

Problems solved by technology

An obvious problem of this solution is the difference in time of the measurements taken on different spectral bands, in which case when using data measured on different spectral bands at different times for determining the moisture level of the web, the measurement result obtained in this manner does not describe a certain point of the web exactly, but the measurement result is naturally affected by the movement of the web during the measurement.
One limitation of the method is that the number of spectral bands being examined is, in practice, limited, because the complexity of the measurement equipment increases significantly with an increase in the number of spectral bands.
Because of the number of detectors the costs of measurement equipment can also be high.

Method used


Image

  • Quality and condition monitoring based on spectrum separating measurement
  • Quality and condition monitoring based on spectrum separating measurement
  • Quality and condition monitoring based on spectrum separating measurement

Examples


Embodiment Construction

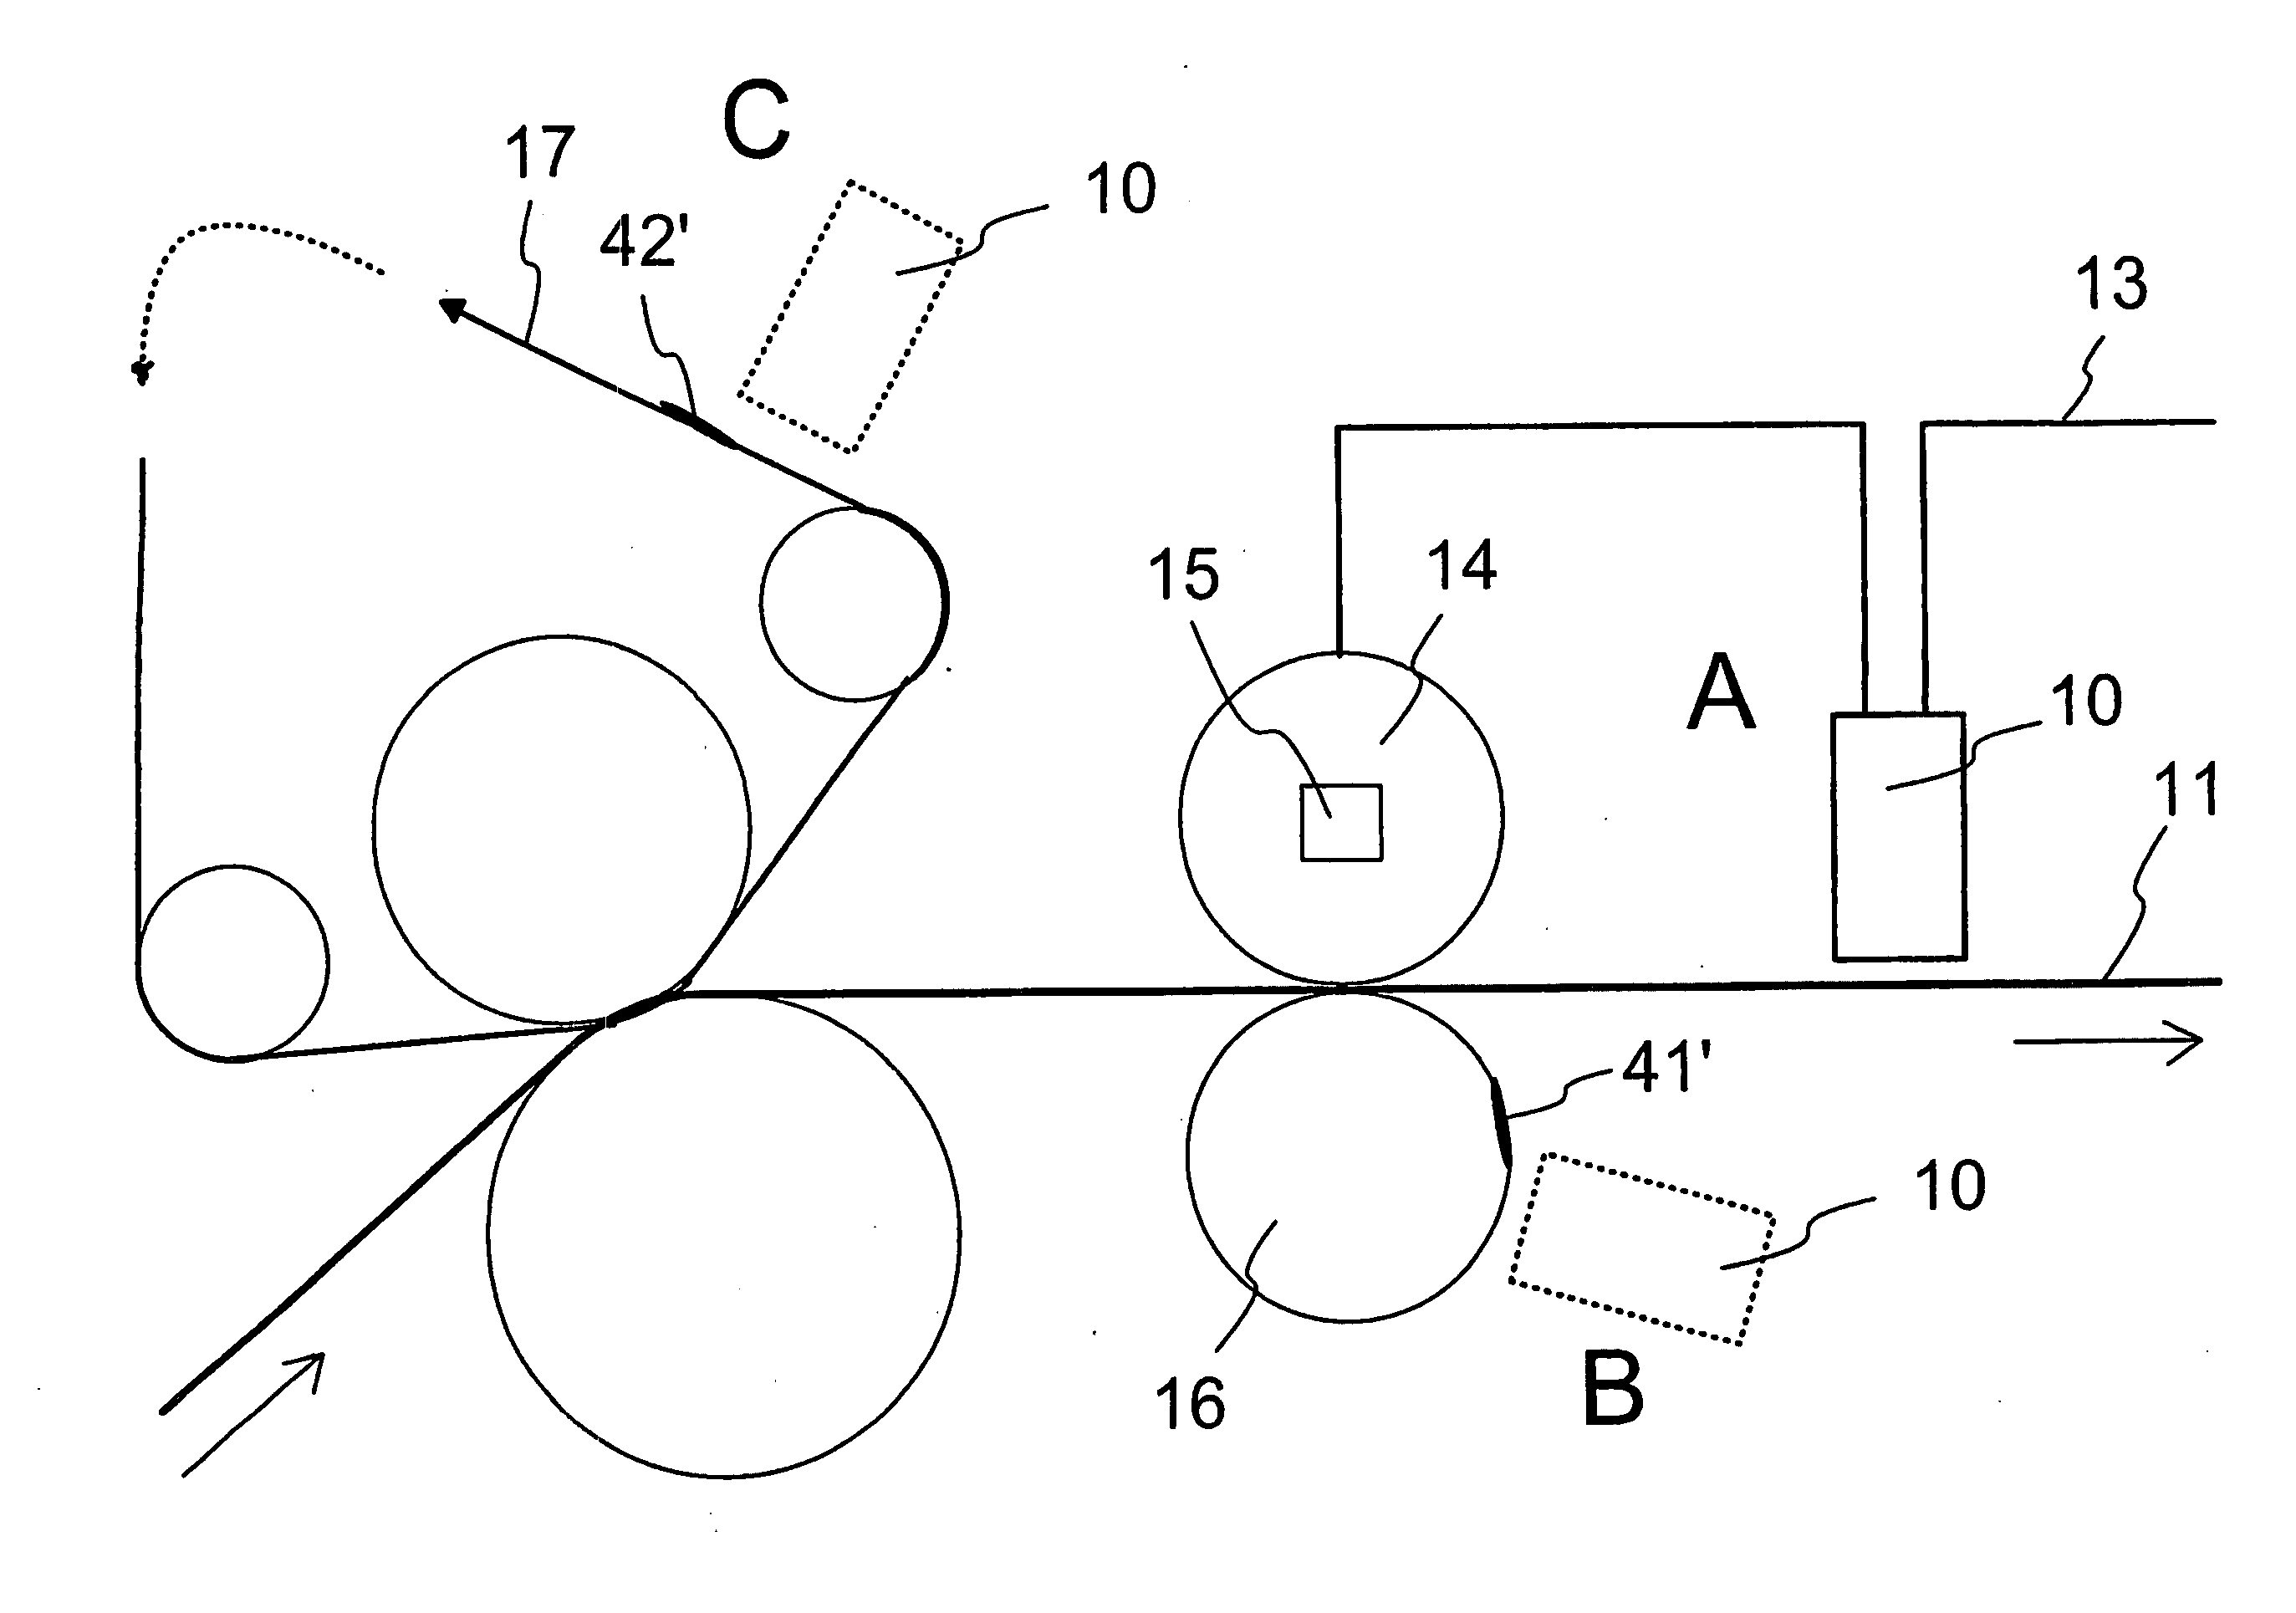
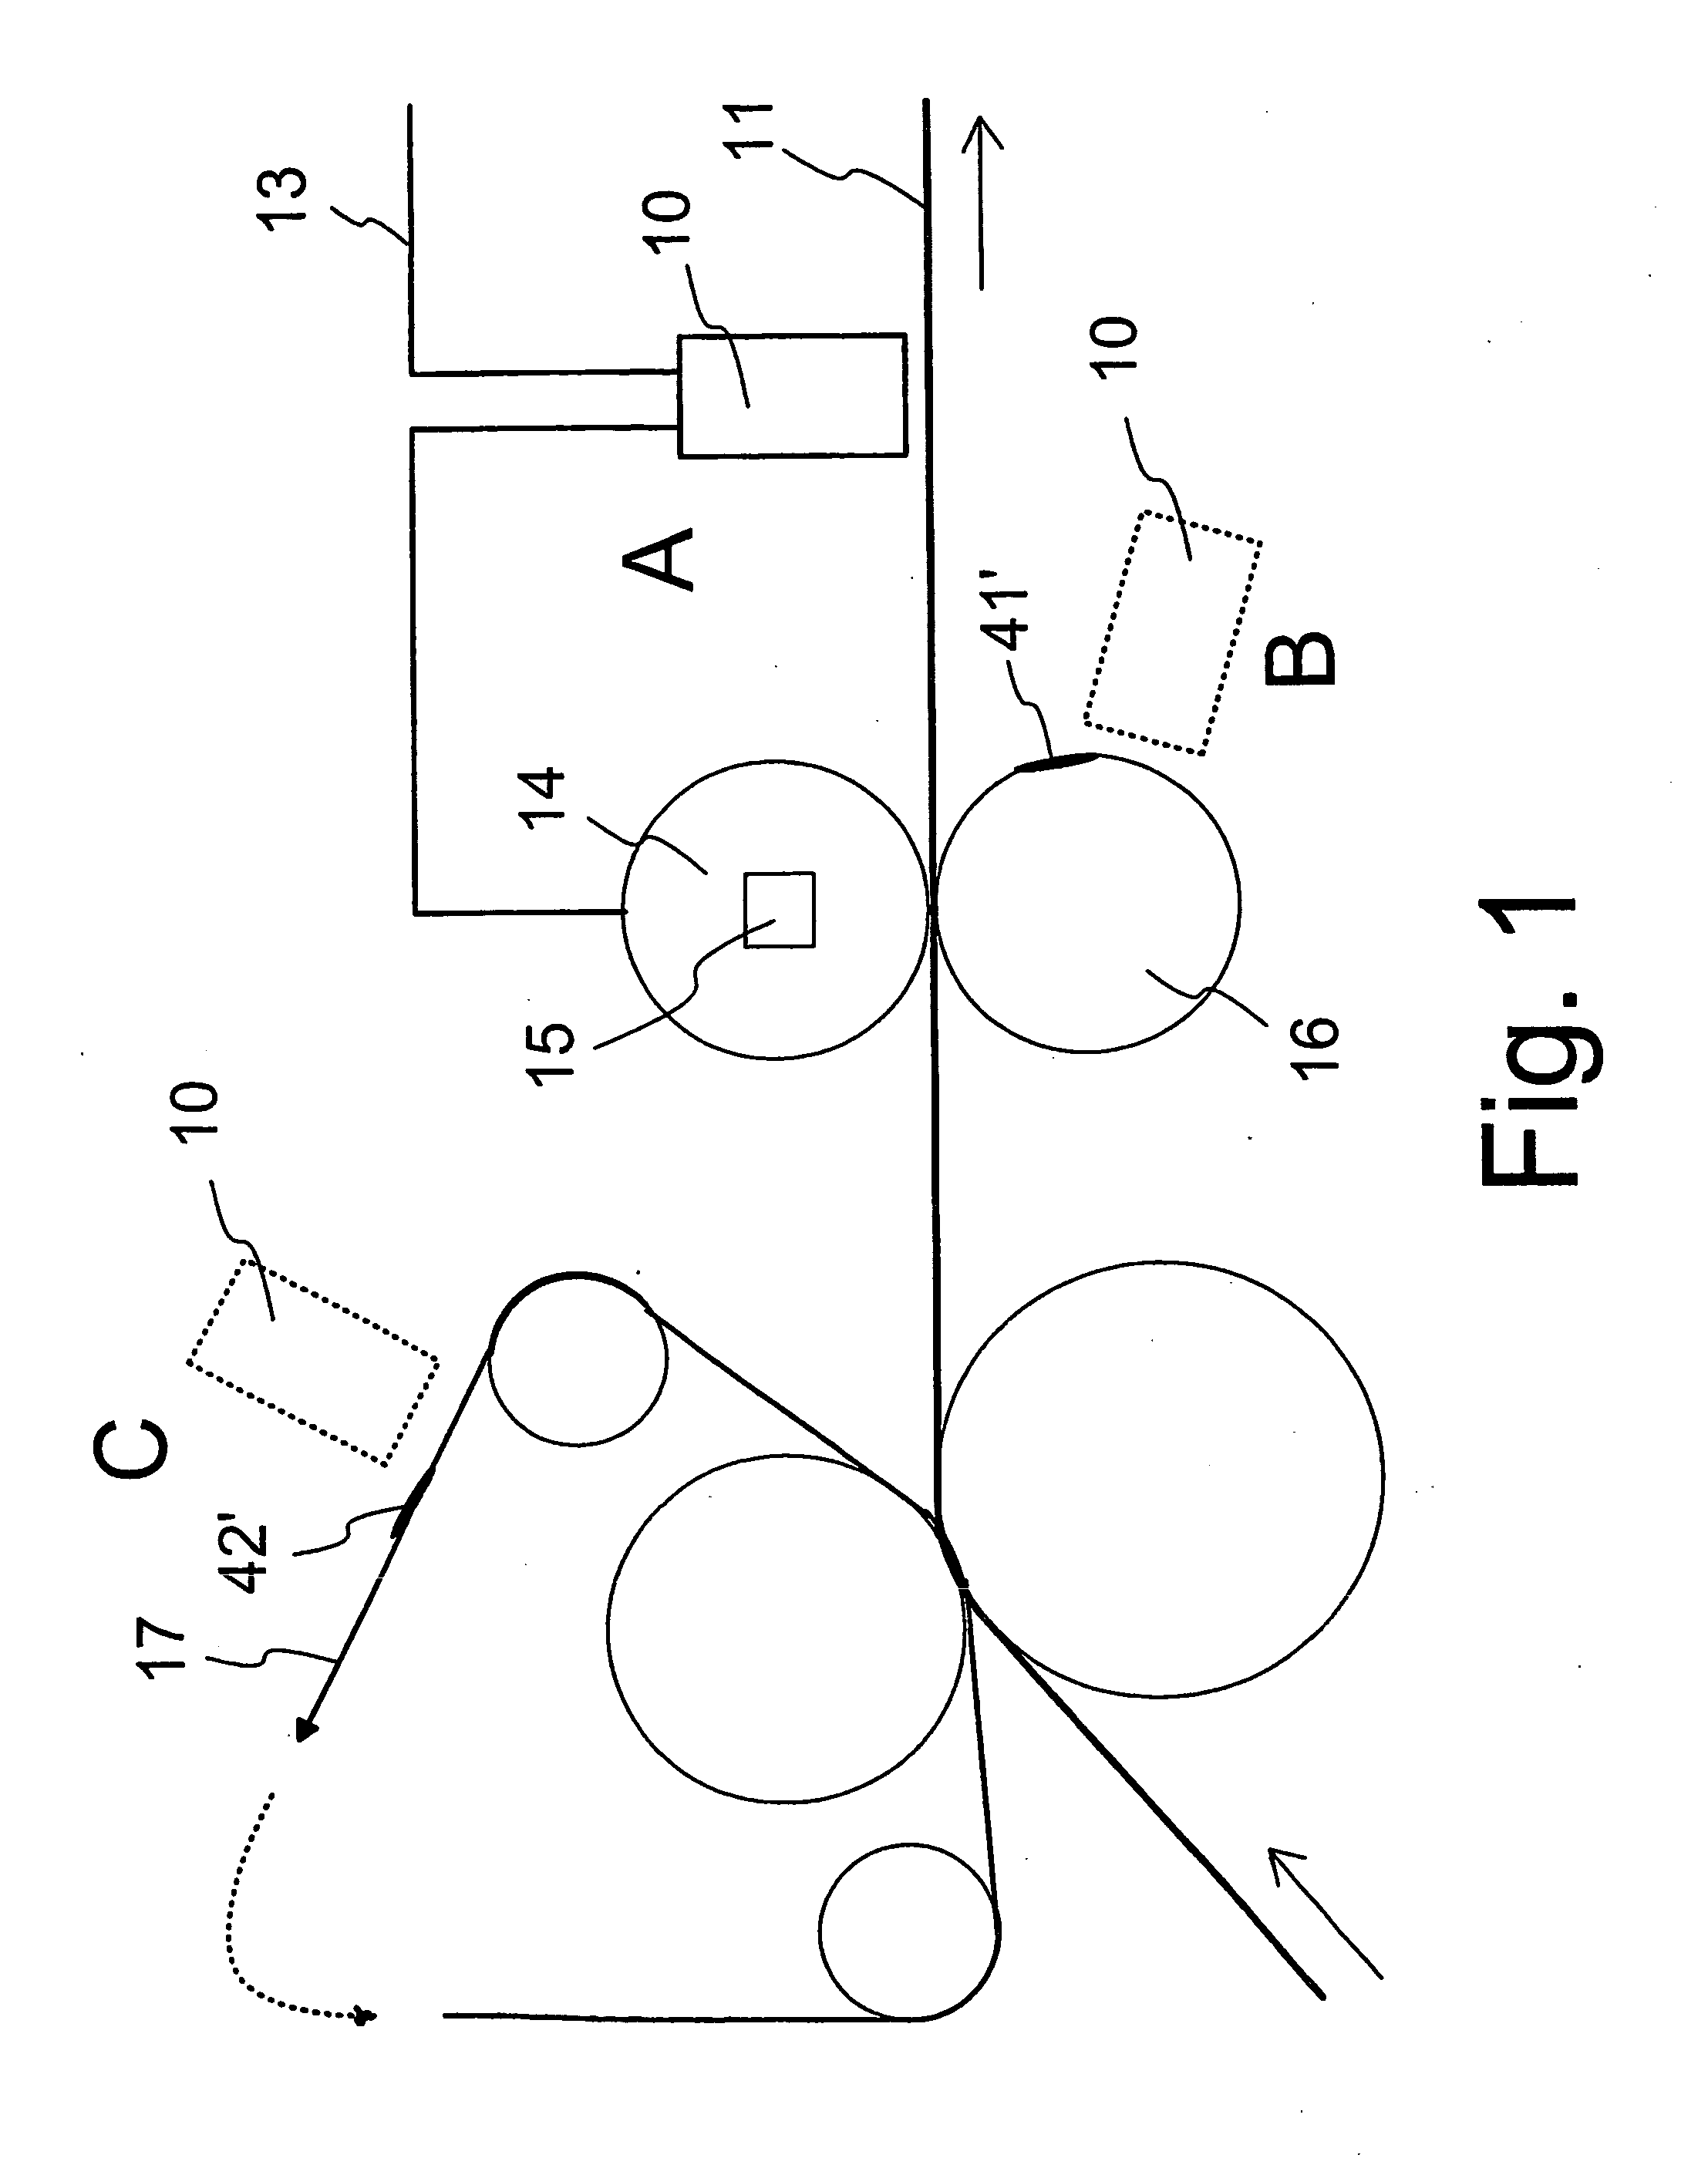
[0040]FIG. 1 shows, in principle, some possible embodiments, which correspond to the different placements A, B, C of the spectrum separating measurement device marked in FIG. 1. The invention will be discussed in the following by using the placement A marked in FIG. 1 as an example and the moisture level of web 11 as the quality variable being examined.

[0041] A spectrum separating measurement device 10 placed in position A is arranged to collect spectral data from the moving web 11 being measured in order to form a continuous quality variable chart of the web 11 according to the invention. The web 11 can be a fibre web, which can appear in different forms in paper or board manufacturing, and which can, depending on the measuring point be supported from the measuring point also in relation to the measurement device 10 from the opposite side by means of a wire, a roll or another element.

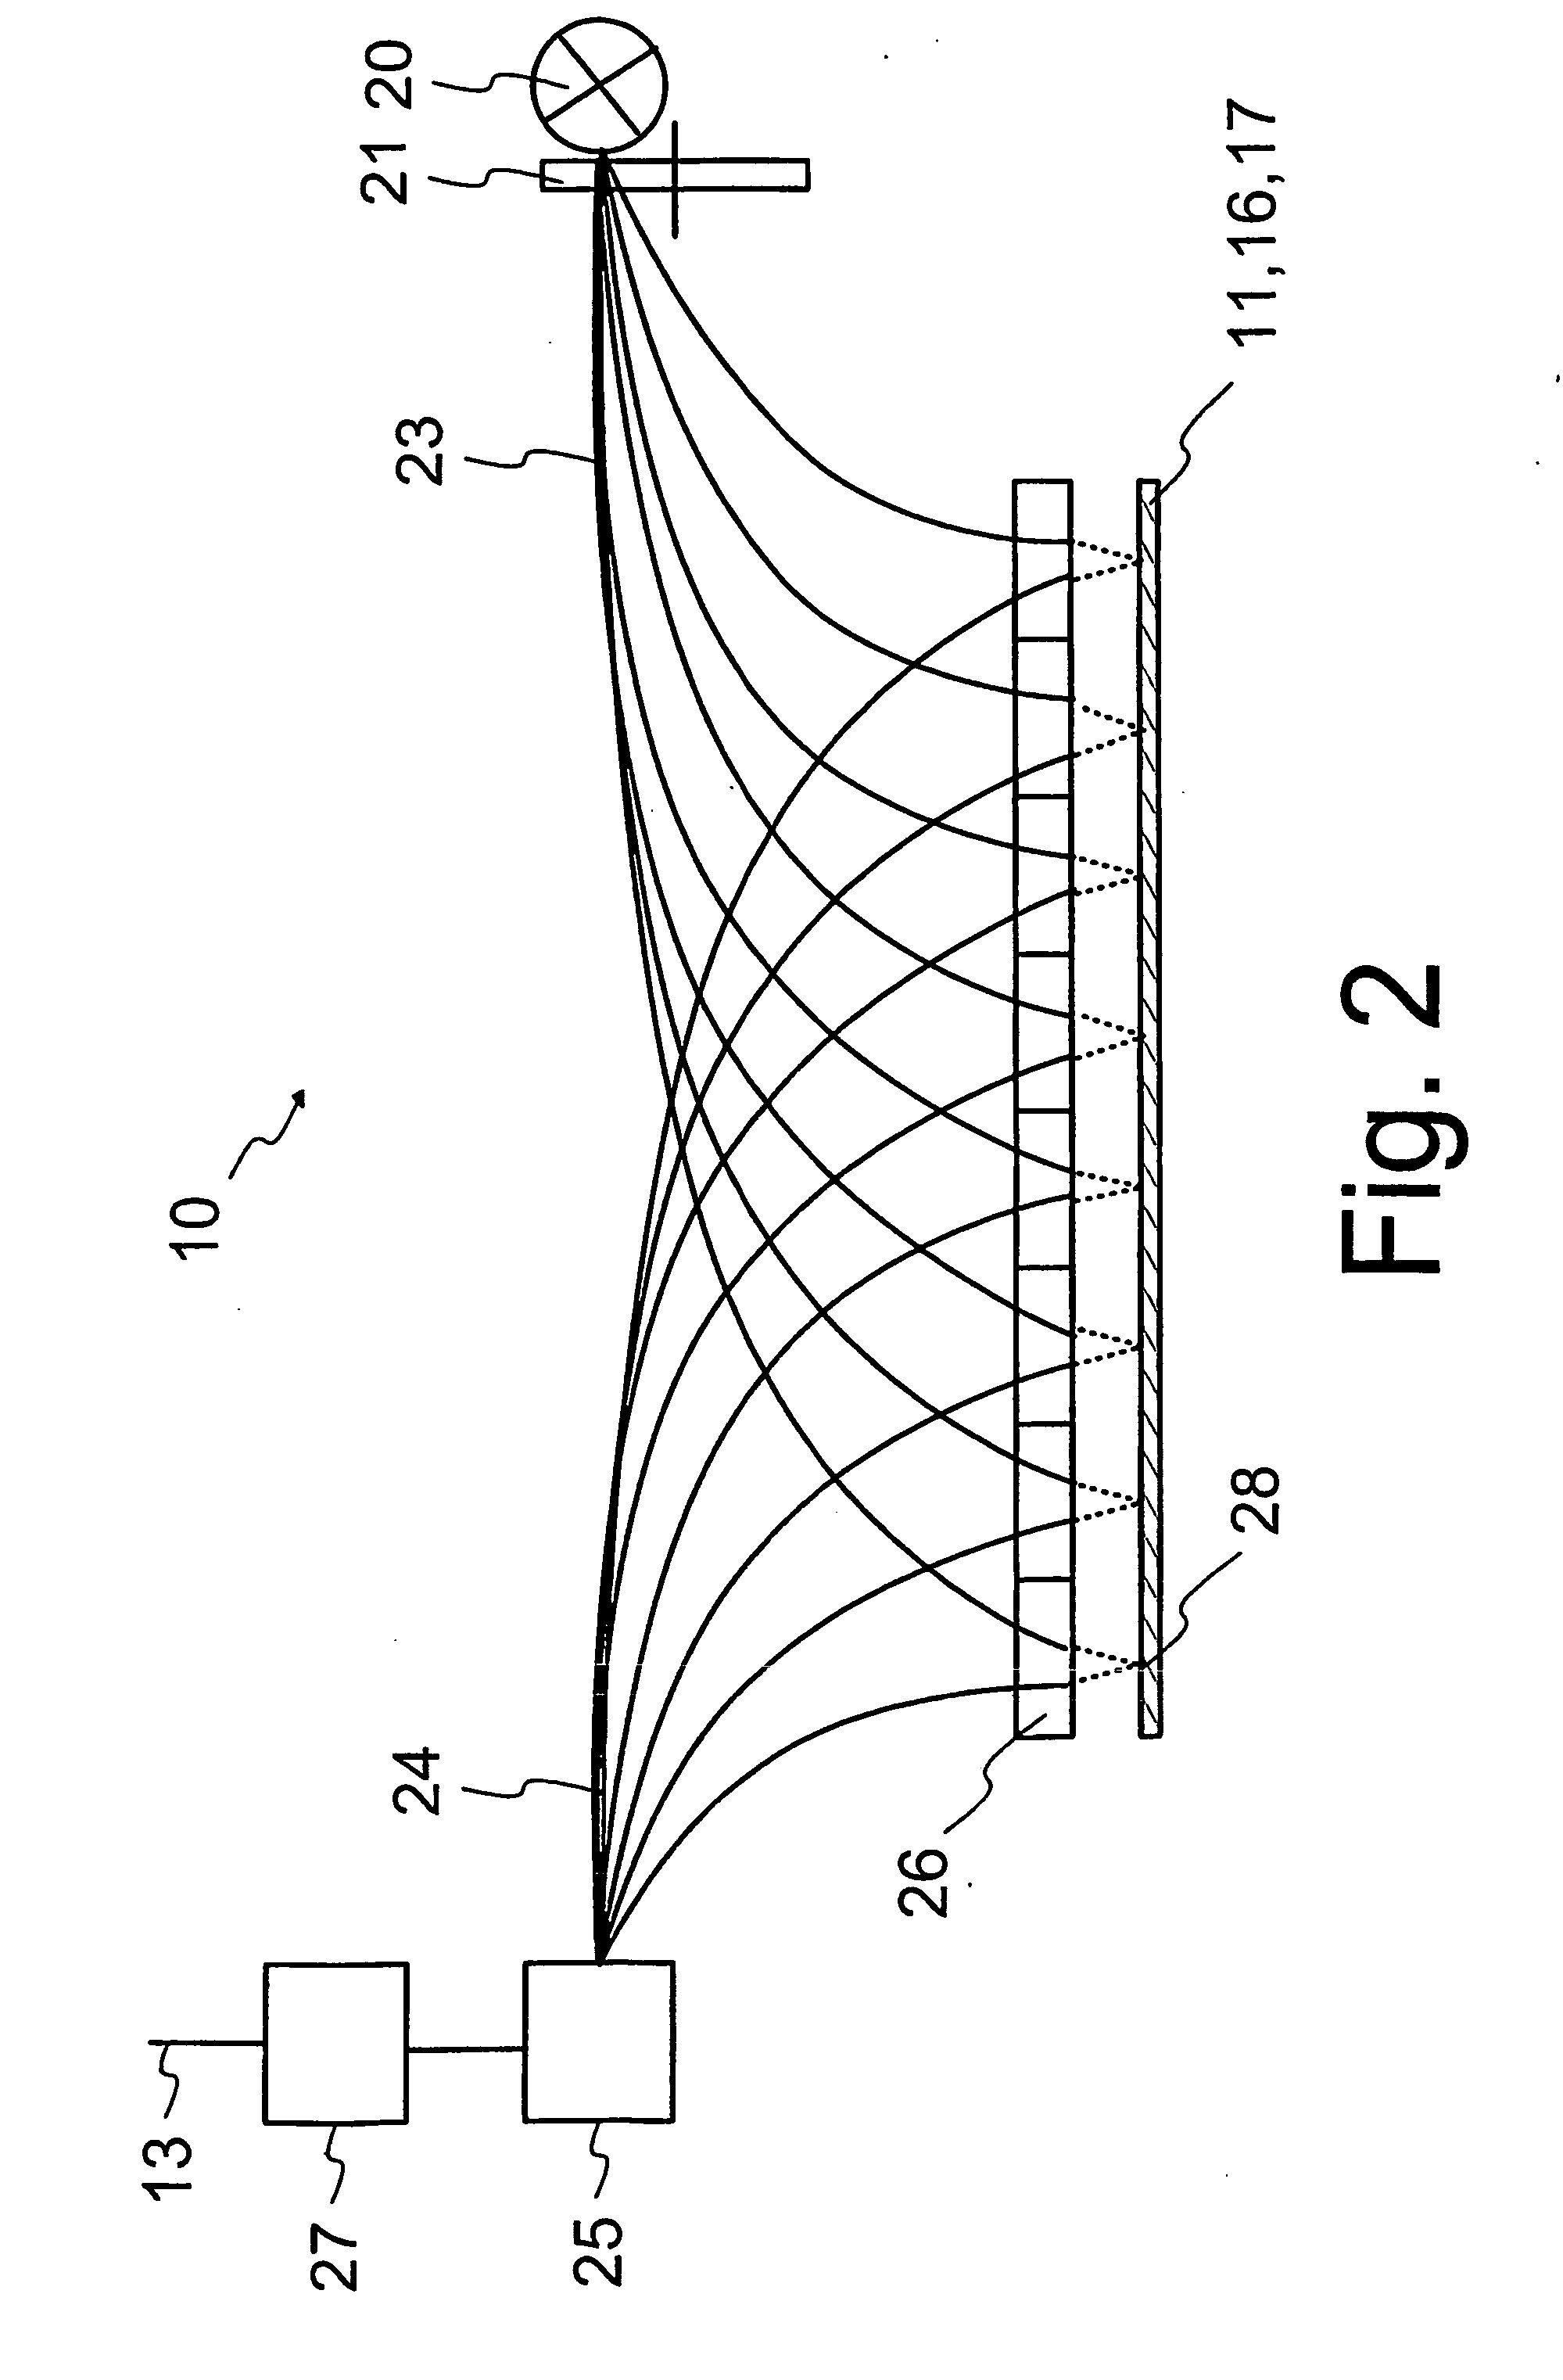
[0042]FIG. 2 shows a possible embodiment of a spectrum separating measurement device 10 in princi...


PUM

PropertyMeasurementUnit
wavelengthaaaaaaaaaa
wavelength rangeaaaaaaaaaa

Abstract

The invention relates to a method in the process of manufacturing and / or finishing a fibre web, in which method said continuous and moving web, and / or a moving means related to the processing of the web, is monitored by at least one optical spectrum separating measurement device to determine at least one quality variable of said object for the purpose of controlling the quality or condition. According to the invention, spectral data is collected in synchronization with the movement from the object which is being examined and is in a progressive and / or rotating movement, by measuring electromagnetic radiation, which has been transmitted, reflected, or otherwise emitted by the object, in a temporally and spatially resolved manner. On the basis of this spectral data, a two-dimensional quality variable chart is formed, which is substantially continuous in the direction of movement of the object and presents at least one quality variable of the object, and in order to determine the characteristics of the object and / or to detect defects in the object from said continuous quality variable chart, local deviations and / or discontinuities are detected in said continuous quality variable chart, especially in the direction of movement. The cause of these deviations and / or discontinuities is identified on the basis of the periodicity of said phenomena in the direction of movement.

Description

FIELD OF THE INVENTION [0001] The invention relates to a method for controlling quality and condition on the basis of spectrum separating measurement, to be used in connection with processes of manufacturing or finishing a continuous fibre web, particularly a paper web, according to the preamble of the appended claim 1. BACKGROUND OF THE INVENTION AND PRIOR ART [0002] In the manufacturing and finishing processes of paper, paperboard and other corresponding web-like materials, the significance of methods and systems monitoring the web as such and / or the process in real time increases continuously when the aim is to achieve as high a production capacity as possible and a high and equal quality of the product. [0003] The use of optical methods is a method, which has been found to be very efficient in implementing real-time monitoring of a rapidly moving fibre web and its path. Advantages of optical methods include, for example, the possibility to perform measurements of the object in a...

Claims


Application Information

Patent Timeline
Patent Type & Authority Applications(United States)
IPC IPC(8): D21G9/00G01N21/89G01N33/34
CPCD21G9/0009G01N33/346G01N21/8915G01N21/86G01N21/8914G01N21/8922
Inventor MANTYLA, MARKKUKUKKURAINEN, MATTIKOMULAINEN, ANTTI
Owner METSO AUTOMATION OY
Why Eureka
Try Eureka