Product card generation, labeling, inspection, and/or authentication system
- Summary
- Abstract
- Description
- Claims
- Application Information
AI Technical Summary
Benefits of technology
Problems solved by technology
Method used
Image


Examples
example 1
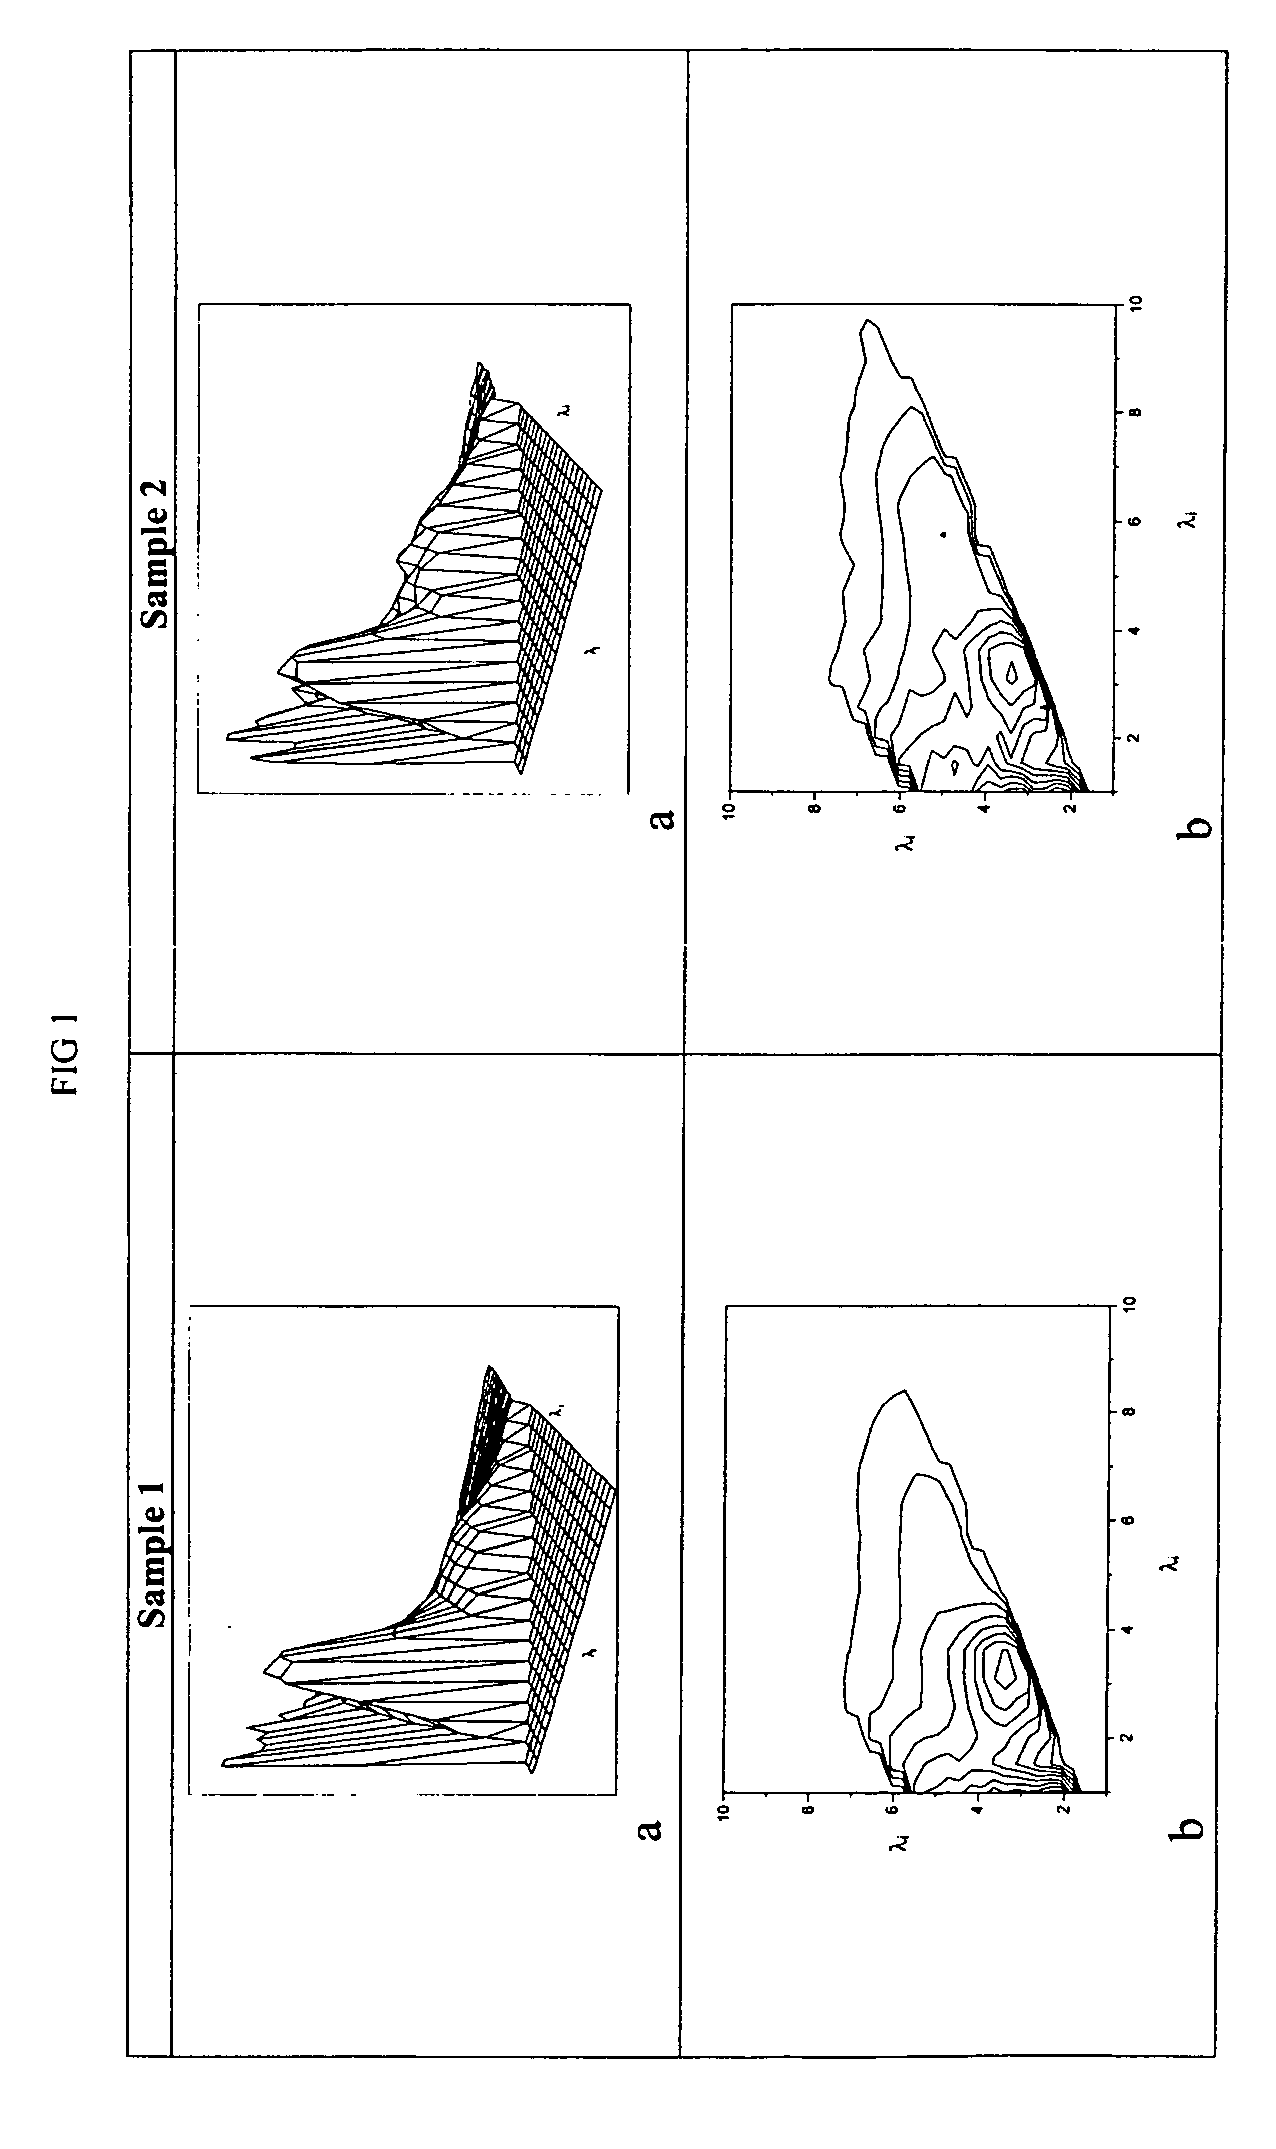
In order to demonstrate the sensitivity of the proposed method to variations in the micro-component composition of the products, FIGS. 1 and 2 show graphic presentations of the generalized optical images of various products of natural and industrial origin.
FIG. 1 shows graphic presentations of the generalized optical images as a 3D image (“portrait”) and a “fingerprint,” which is a topographical cross-section (a horizontal projection of the family of equidistant cross-sections of the 3D image) for two samples of mineral water of the same type supplied by different manufacturers. As can be seen from the figure, the specimens have generally similar 3D images but, at the same time, they drastically differ in details, which is especially noticeable in graphic images presented as “fingerprints.”
FIG. 2 shows “fingerprints” for various type of industrial products: an alcohol product (vodka) of two identical brands produced by different manufacturers and automotive gasolines of various br...
example 2
In order to demonstrate the average experimental values of the level of agreement and magnitude of error for the characteristic generalized optical images obtained for individual commercial lots of various goods, the following products were selected: 1)—brand 1 automotive gasoline; 2)—brand 2 automotive gasoline; 3)—mineral water; 4)—alcoholic beverage (vodka); 5)—bakery yeast (powder); 6)—shampoo (gel); 7)—dish detergent (gel); 8)—powdered laundry detergent.
Analyses were conducted for series consisting of 5-10 specimens of each type of the above products manufactured in one and the same technological cycle. The results of those analyses are presented in Table 1. As that table shows, the magnitude of error δ was several percentage points and practically all of it was determined by the experimental error of measuring the characteristic intensities
TABLE 1Category of productGasolineFoodstuffsChemicals12345678A0.960.950.950.980.940.970.980.94±δ0.040.050.050.020.060.030.020.06
example 3
In order to demonstrate the levels of agreement for the optical images of homonymous products from an individual manufacturer, three specimens of shampoo of the same brand were sampled; the shampoos were produced in various technological cycles with a time interval of several months. The results of comparison are presented in Table 2. As can be seen from that table, only insignificant variations in the level of agreement due to random measurement errors were observed in products made of identical raw materials in one and the same technological cycle. On the other hand, the level of agreement was substantially lower in specimens from different technological lots.
TABLE 2Lot 1Lot 21-11-21-32-12-22-3Lot 11-110.970.950.820.790.821-20.9710.980.860.850.81-30.950.9810.880.820.85Lot 22-10.820.860.8810.940.992-20.790.850.820.9410.962-30.820.80.850.990.961
PUM
 Abstract
Description
Claims
Application Information
 - R&D
- Intellectual Property
- Life Sciences
- Materials
- Tech Scout
- Unparalleled Data Quality
- Higher Quality Content
- 60% Fewer Hallucinations
Browse by: Latest US Patents, China's latest patents, Technical Efficacy Thesaurus, Application Domain, Technology Topic, Popular Technical Reports.
© 2025 PatSnap. All rights reserved.Legal|Privacy policy|Modern Slavery Act Transparency Statement|Sitemap|About US| Contact US: help@patsnap.com