
Method and system for determining and monitoring dispensing point flow rates and pump flow capacities using dispensing events and tank level data

a technology of pump flow rate and event, which is applied in the direction of liquid transferring device, process and machine control, instruments, etc., can solve the problems of reducing the throughput efficiency of the fuel dispenser, not delivering the maximum throughput or flow rate of fuel, and fuel dispensers, so as to improve the accuracy of the estimated flow rate and reduce the time

Active Publication Date: 2005-05-12
VEEDER ROOT
View PDF8 Cites 12 Cited by
  • Summary
  • Abstract
  • Description
  • Claims
  • Application Information

AI Technical Summary

Benefits of technology

[0039] A set of aggregate flow rates of multiple concurrent dispensing event periods on multiple dispensing points may be combined with singly active dispensing point dispensing event periods and further analyzed to improve the accuracy of the estimated flow rate on a dispensing point or to reduce the time required to accumulate adequate data for an analysis on a dispensing point.

Problems solved by technology

Also, if the submersible turbine pump (not shown) that pumps fuel from the underground storage tank 34 to the fuel dispensers 32 is suffering from reduced performance and / or pumping rate, this may result in fuel dispensers 32 not delivering the maximum throughput or flow rate of fuel.
Any decline in the submersible turbine pump performance, a blockage in the fuel supply piping 47, or a blockage in components located inline to the fuel supply piping 47 may cause the fuel dispenser 32 to either not deliver fuel at all or at a reduced rate, thereby reducing the throughput efficiency of the fuel dispenser 32 and possibly requiring a customer to spend more time refueling a vehicle.
The customer may be frustrated and therefore not visit the same service station for his or her fueling needs.
The reduced throughput of the fuel dispenser 32 may also cause other customers to wait longer for a fueling position thereby resulting in lost revenue in terms of lost opportunity revenues.
If a number of motorists dispense fuel simultaneously, the performance of the pump (not pictured) or fuel supply piping 47 may not be sufficient to deliver fuel to the fuel dispenser 32 at all or may cause fuel to be delivered at a reduced rate and possibly require a customer to spend more time refueling a vehicle.
The customer may be frustrated and therefore not visit the same service station for his or her fueling needs.
The reduced throughput of the fuel dispenser 32 may also cause other customers to wait longer for a fueling position thereby resulting in lost revenue in terms of lost opportunity revenues.
When the flow rate is calculated at a fuel dispenser 32, a reduced flow rate may be caused by a blockage in the fuel supply piping 47, a problem in performance with a fuel pump, or simply human behavior of a motorist dispensing fuel slowly.
However, with these techniques, several issues can occur which will inaccurately reduce the measured flow rate from the true maximum flow rate capability of the fuel dispenser 32.
For example, the nozzle may not be fully engaged during the entire dispensing event thereby reducing the volume throughput and also the calculated flow rate.
Therefore, it is not possible to ensure that a reduced flow rate measured by using the “Dispense Start” and “Dispense End” messages is caused by a blockage in the fuel supply piping 47 or a problem in performance with a fuel pump, rather than such reduced flow rate, as measured, occurring as a result of dead time during a dispensing event by any or all of the aforementioned causes.

Method used


Image

  • Method and system for determining and monitoring dispensing point flow rates and pump flow capacities using dispensing events and tank level data
  • Method and system for determining and monitoring dispensing point flow rates and pump flow capacities using dispensing events and tank level data
  • Method and system for determining and monitoring dispensing point flow rates and pump flow capacities using dispensing events and tank level data

Examples


Embodiment Construction

[0055] The embodiments set forth below represent the necessary information to enable those skilled in the art to practice the invention and illustrate the best mode of practicing the invention. Upon reading the following description in light of the accompanying drawing figures, those skilled in the art will understand the concepts of the invention and will recognize applications of these concepts not particularly addressed herein. It should be understood that these concepts and applications fall within the scope of the disclosure and the accompanying claims.

[0056] This patent application claims priority to U.S. Provisional Patent Application No. 60 / 510,796 entitled, “Method And System For Determining And Monitoring Dispensing Point And Pump Flow Rates Using Tank Level Data,” filed on Oct. 11, 2003 and incorporated herein by reference in its entirety.

[0057] One solution to this problem is found in co-pending patent application Ser. No. 10 / 684,258, filed by the assignee of the prese...


PUM


Abstract

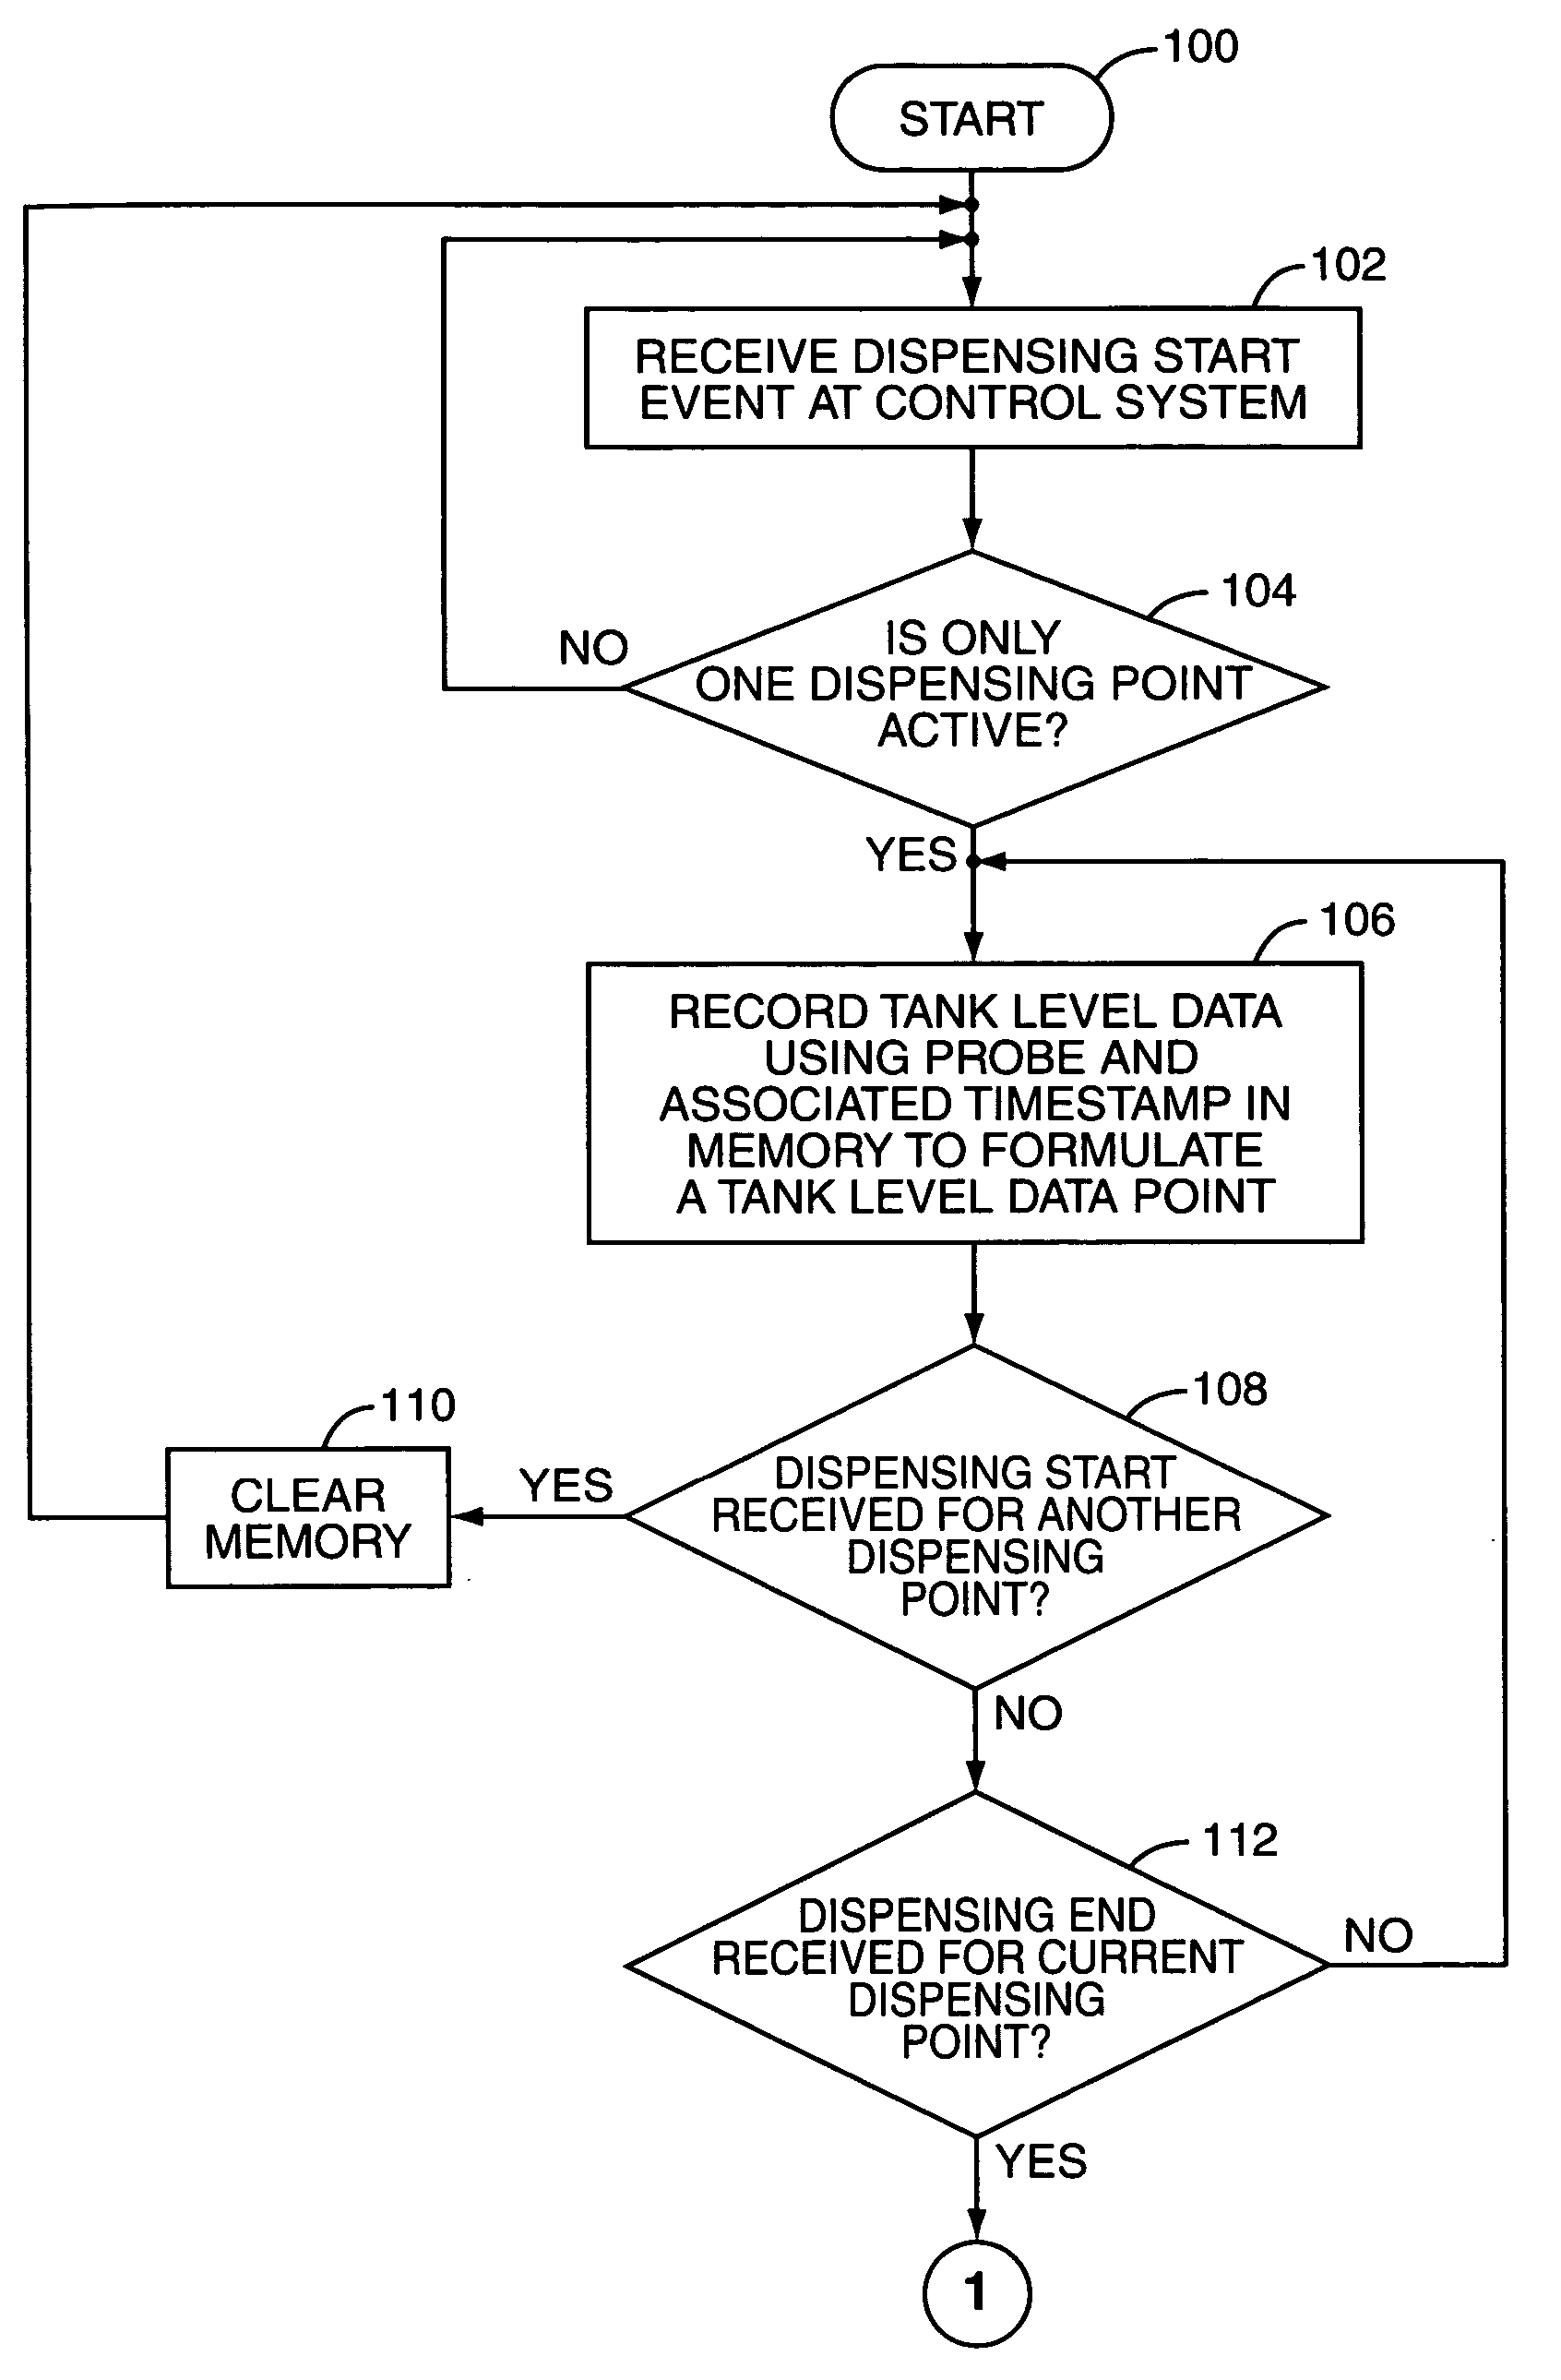
A system and method for calculating the flow rate of a dispensing point or flow capacity of a pump and fuel delivery system and determining if the dispensing point or fuel delivery system has a blockage and / or a performance problem if the calculated dispensing point flow rate is other than expected. The calculated dispensing flow rate is calculated by collecting fuel tank level data points for a dispensing point that fall within start and stop events of the dispensing event. The slope of a fitted line to the fuel tank level data points is used as the indication of the flow rate of the dispensing point. Different mathematical techniques may be used to improve the flow rate calculation to compensate for the minimum resolution of collecting fuel tank level data and the dead time included in the data of a dispensing transaction.

Description

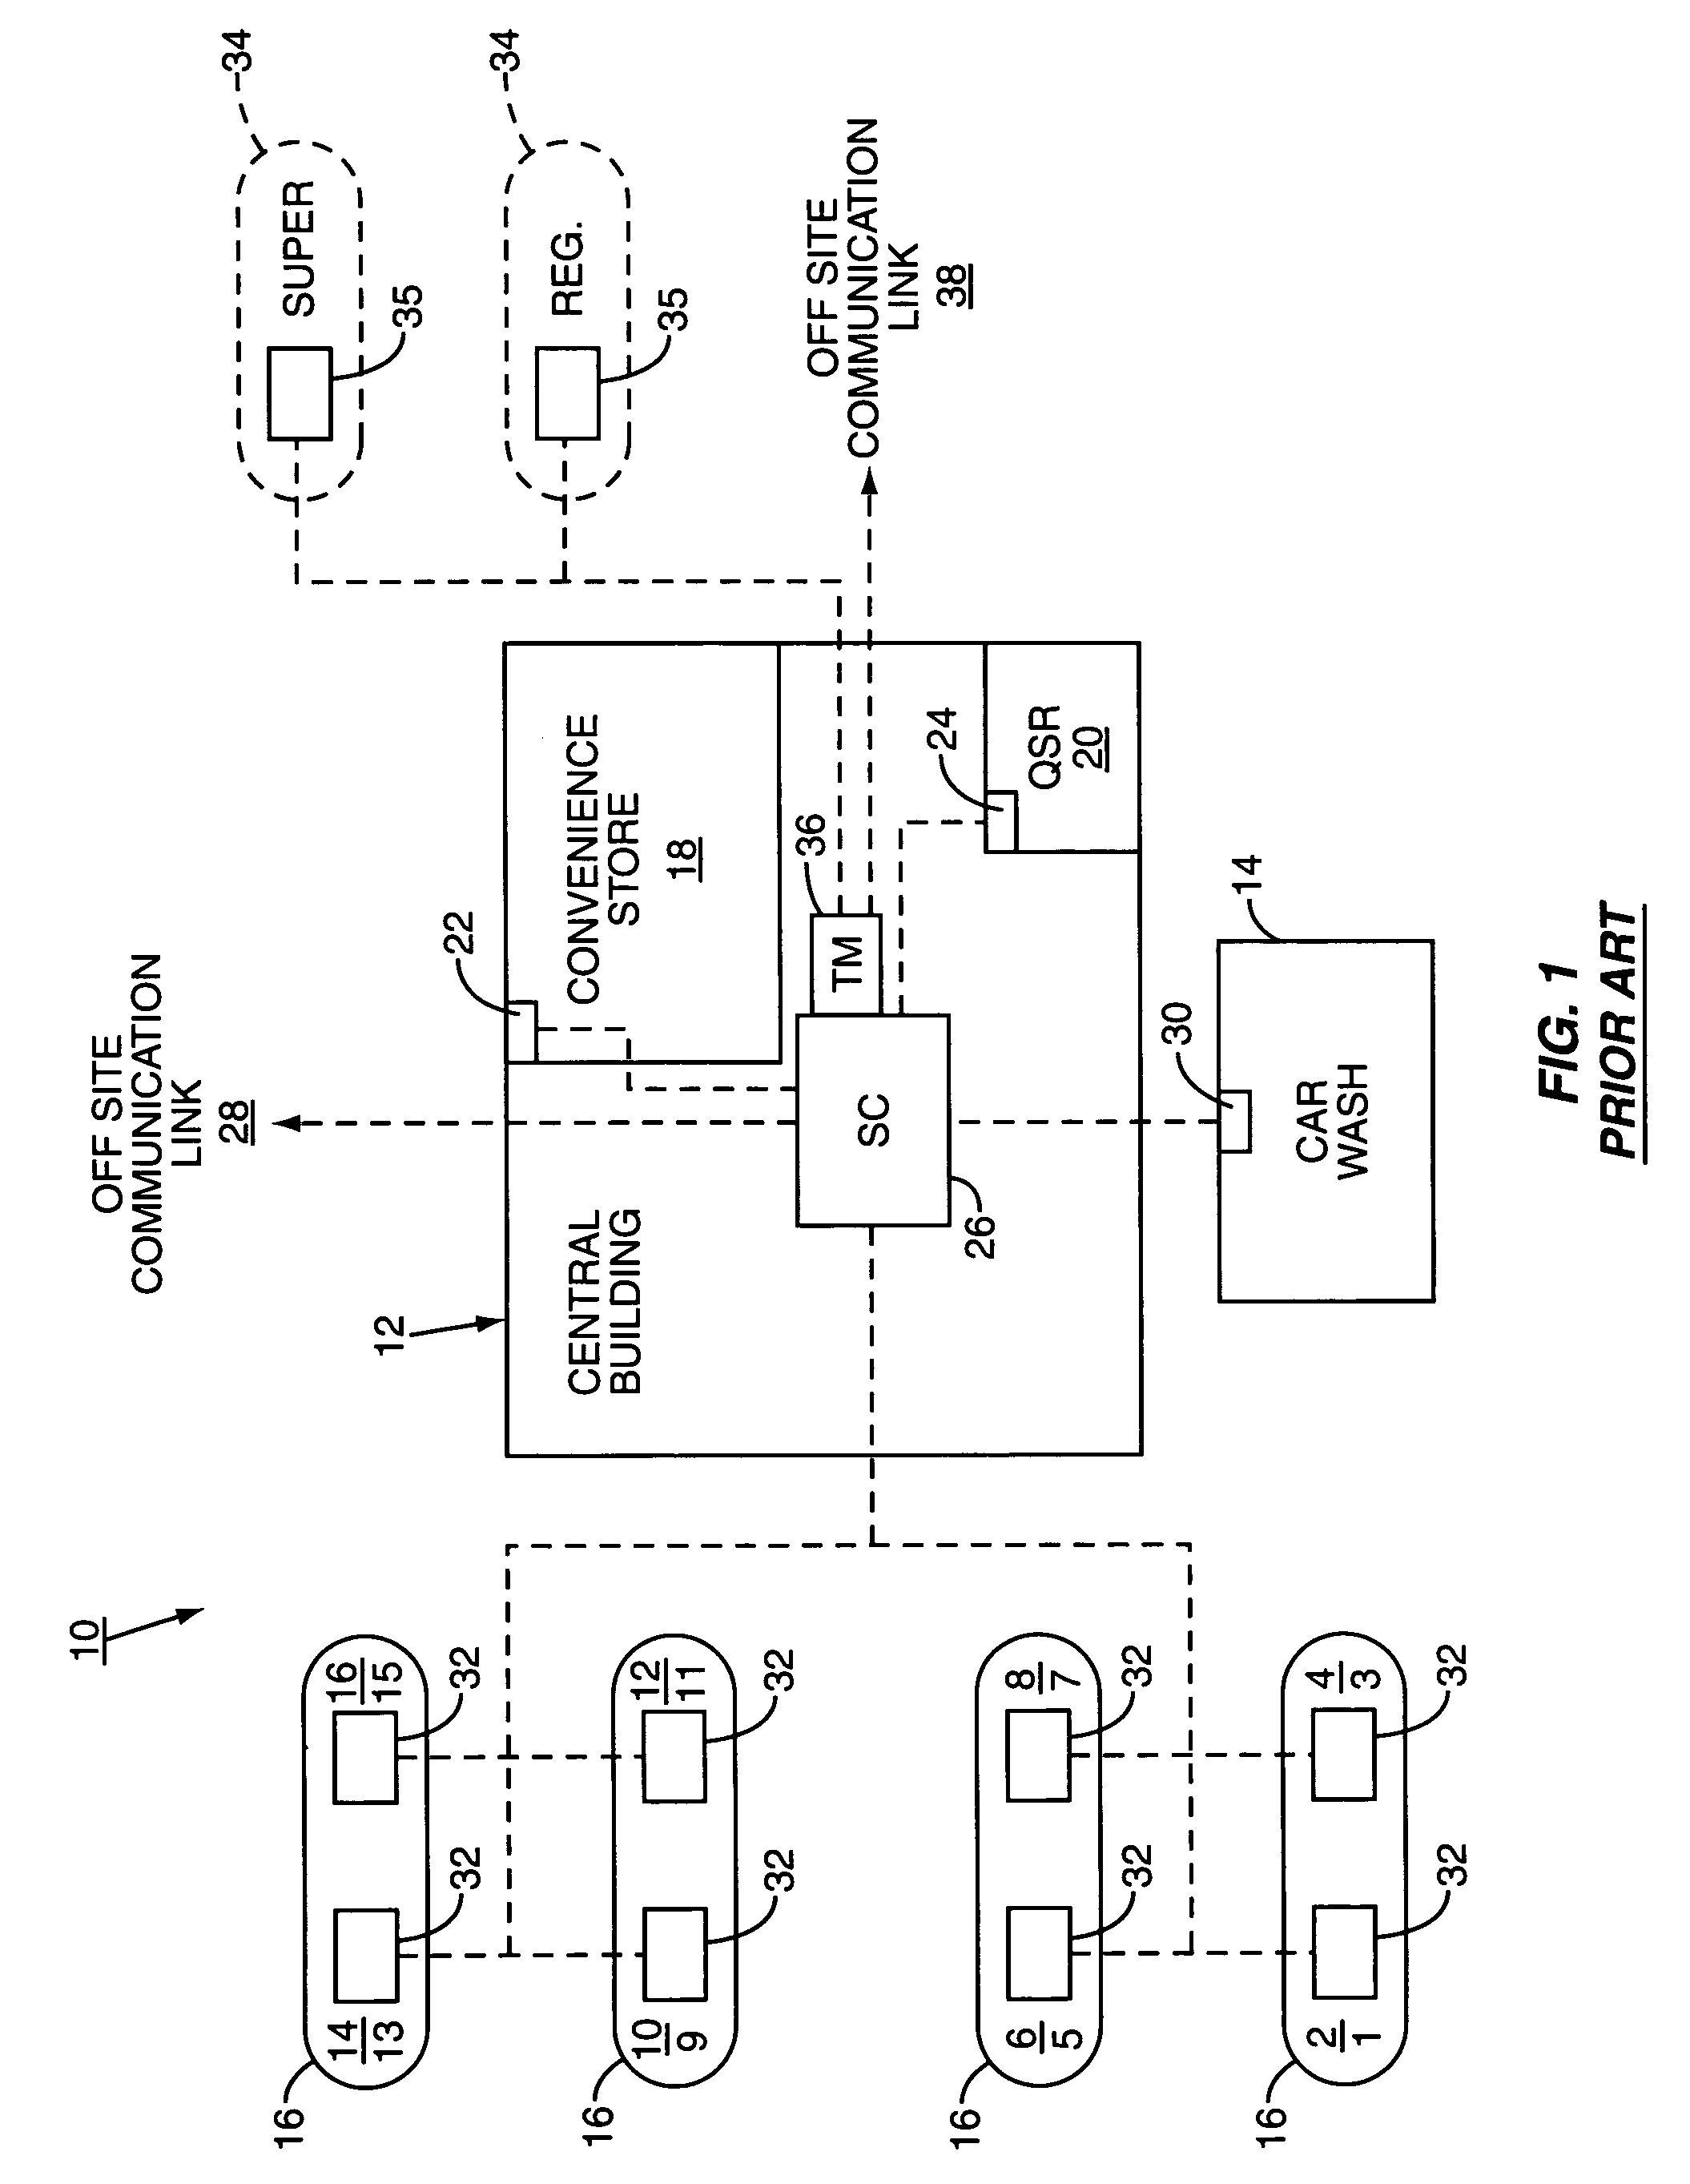
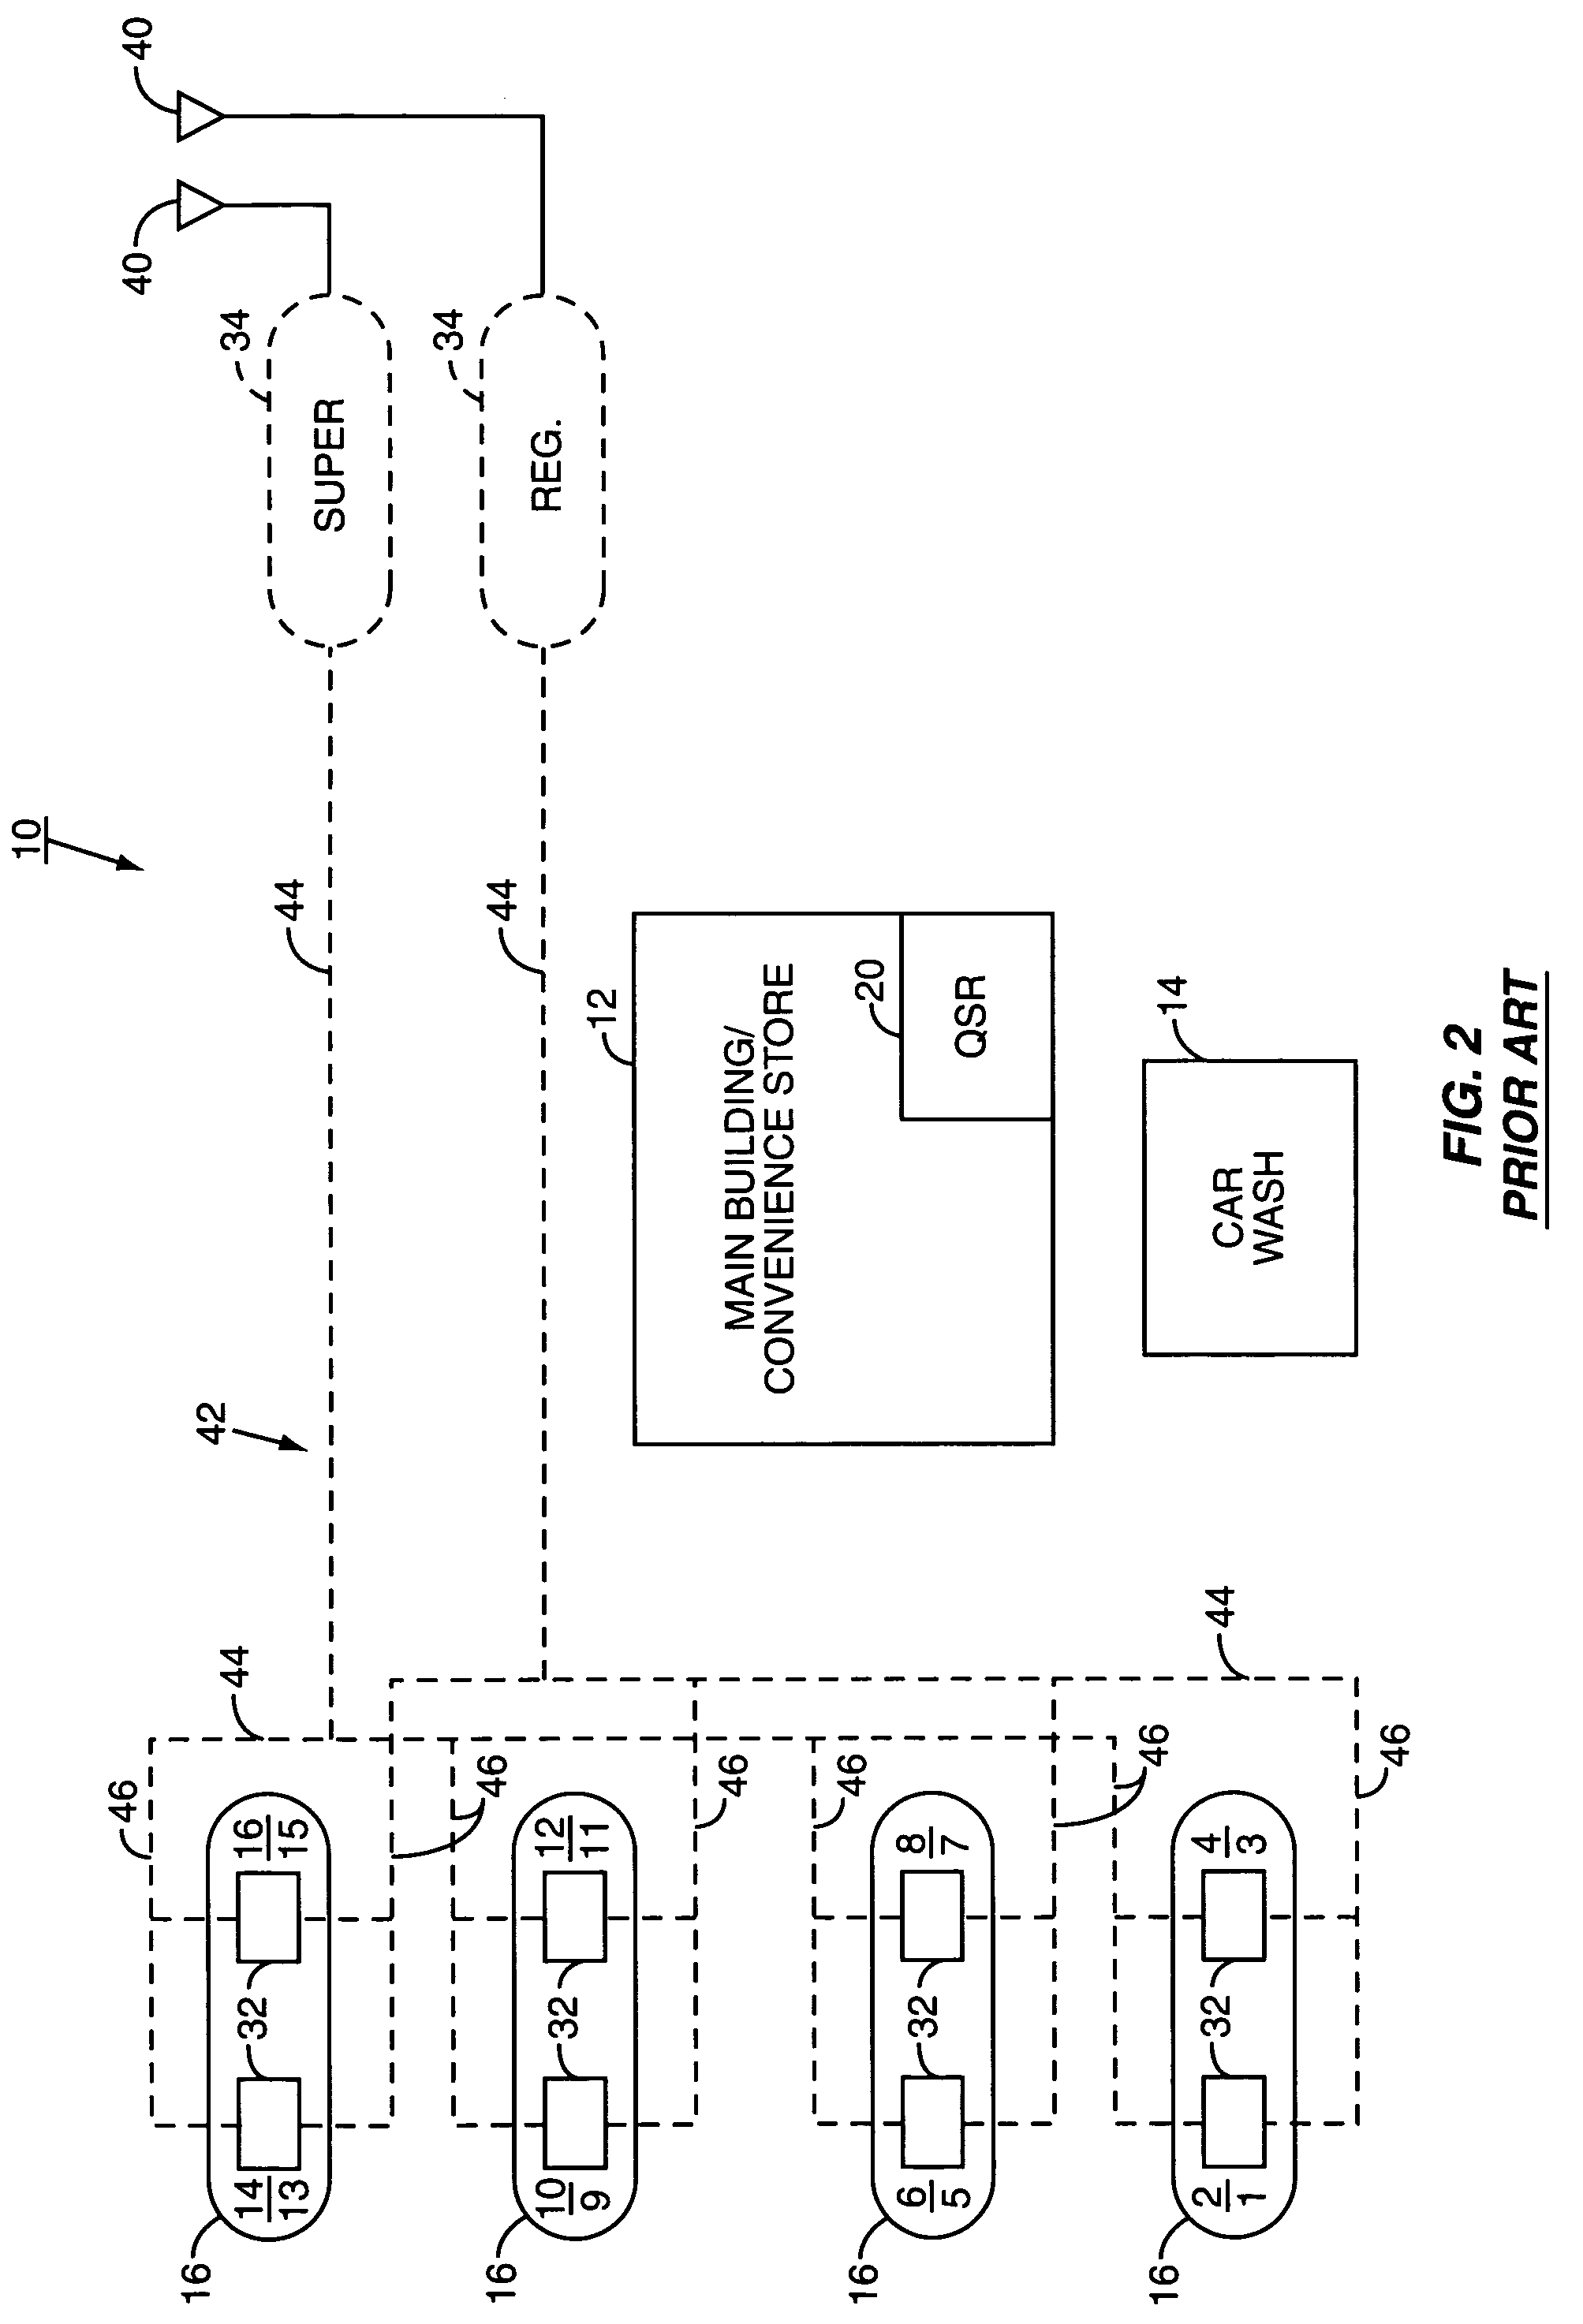
RELATED APPLICATION [0001] This patent application claims priority to U.S. Provisional Patent Application No. 60 / 510,796 entitled, “Method and system for determining and monitoring dispensing point and pump flow rates using tank level data,” filed on Oct. 11, 2003 and incorporated herein by reference in its entirety.FIELD OF THE INVENTION [0002] The present invention relates to a system and method for determining the flow rate of a dispensing point for a fuel dispenser and pump capacities using tank level data in a service station environment to determine if a dispensing point contains a blockage and / or performance problem. BACKGROUND OF THE INVENTION [0003] Service stations are comprised of a plurality of fuel dispensers that dispense fuel to motor vehicles. A conventional exemplary fueling environment 10 is illustrated in FIGS. 1 and 2. Such a fueling environment 10 may comprise a central building 12, a car wash 14, and a plurality of fueling islands 16. [0004] The central buildin...

Claims


Application Information

Patent Timeline
IPC IPC(8): B67D7/08B67D7/22B67D7/32B67D99/00G01F1/00G01F25/00G05D7/06
CPCB67D7/085B67D7/222B67D7/28B67D7/303G05D7/06G01F1/007G01F25/0038G01F25/0092B67D2007/329G05D7/0688G01F25/17
Inventor REICHLER, DONALD S.BAGLIONI, ADRIANOZALENSKI, THOMAS C.HART, ROBERT P.LUCAS, RICHARD K.
Owner VEEDER ROOT
Learn More