Method and apparatus for enhanced estimation of an analyte property through multiple region transformation

US20050149300A1Active Publication Date: 2005-07-07GLT ACQUISITION

Image

  • Method and apparatus for enhanced estimation of an analyte property through multiple region transformation
  • Method and apparatus for enhanced estimation of an analyte property through multiple region transformation
  • Method and apparatus for enhanced estimation of an analyte property through multiple region transformation

Examples


example 1

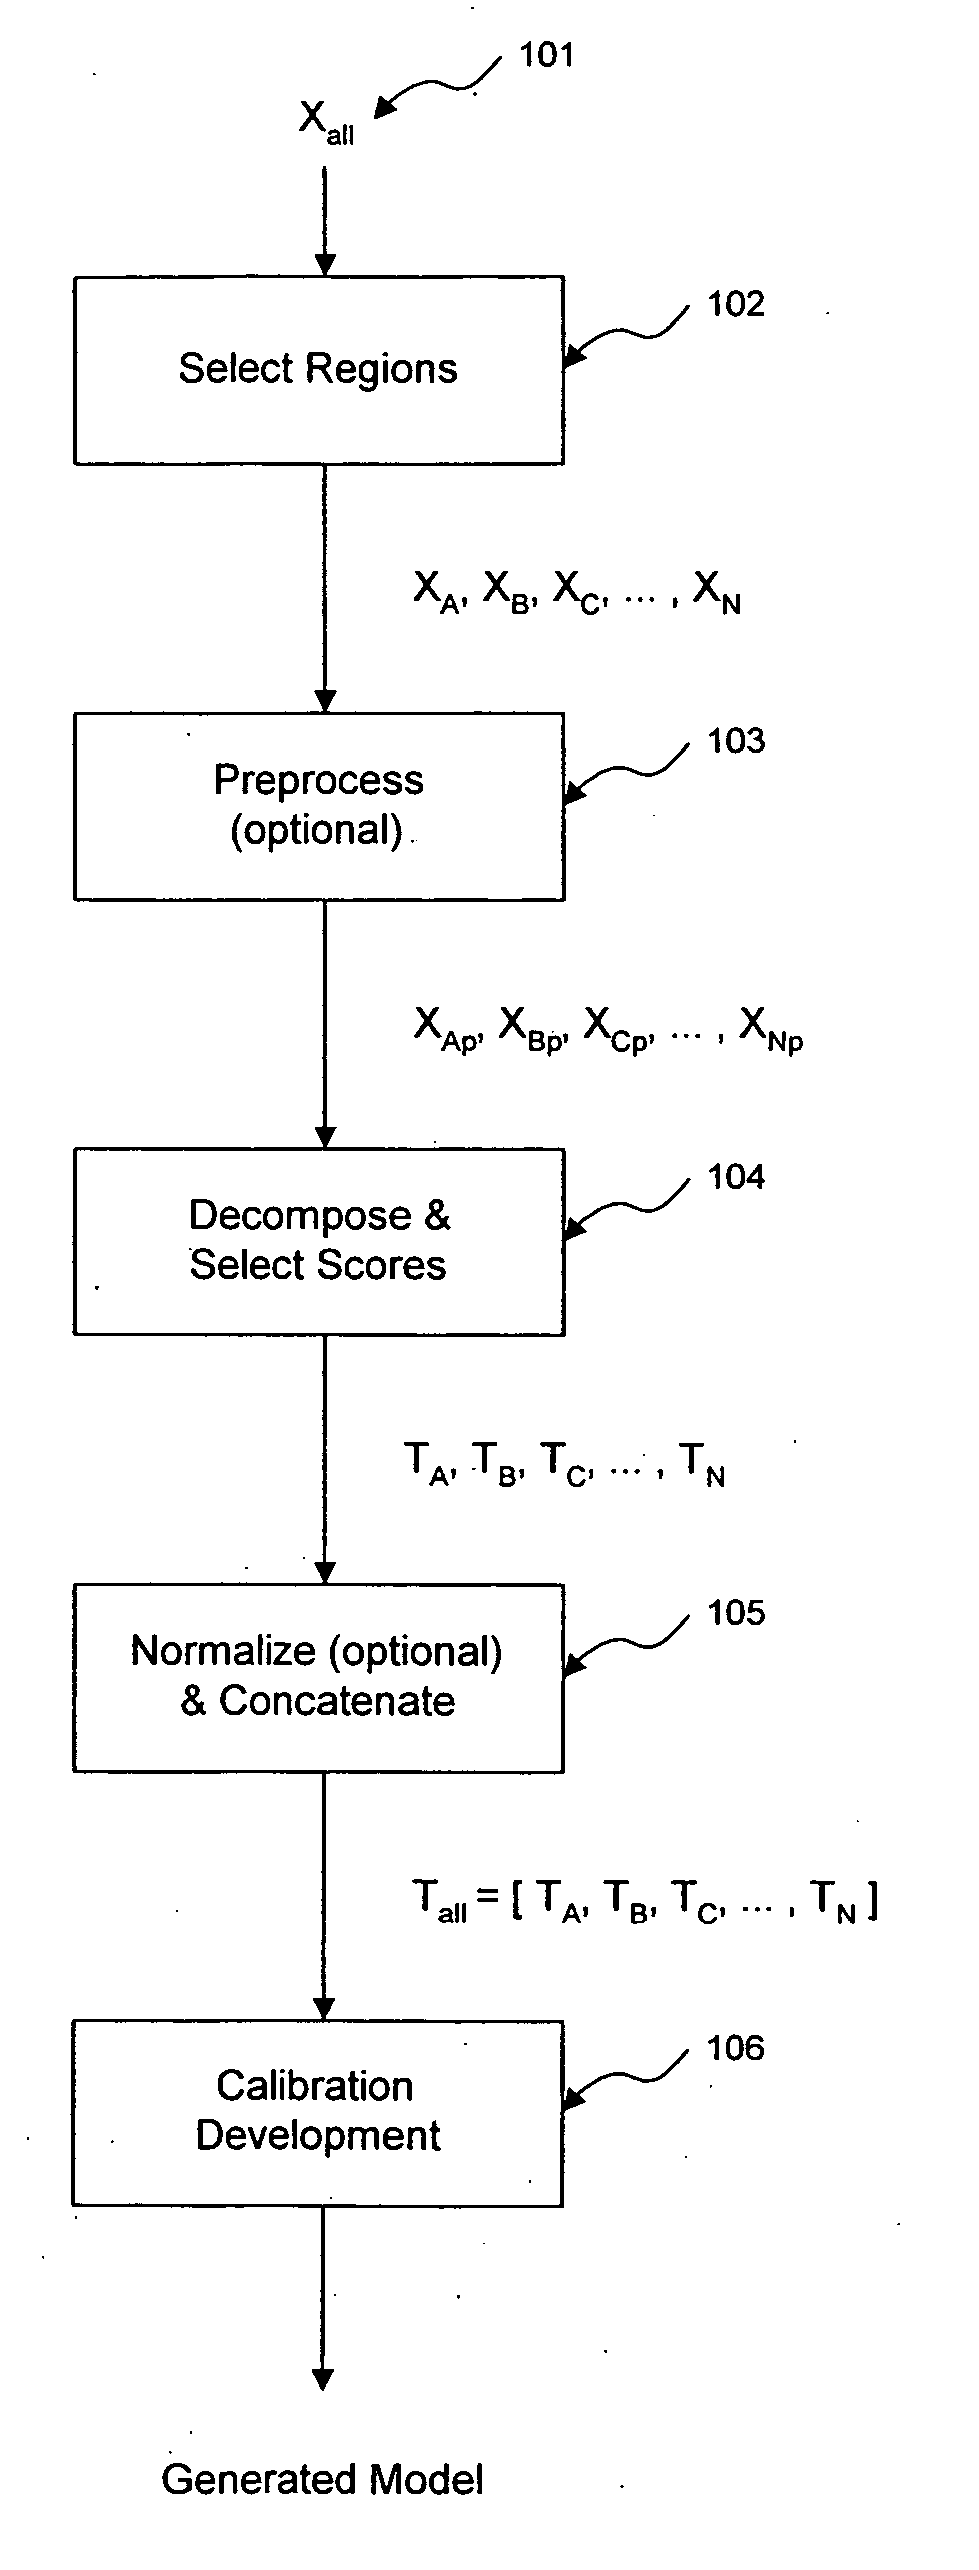
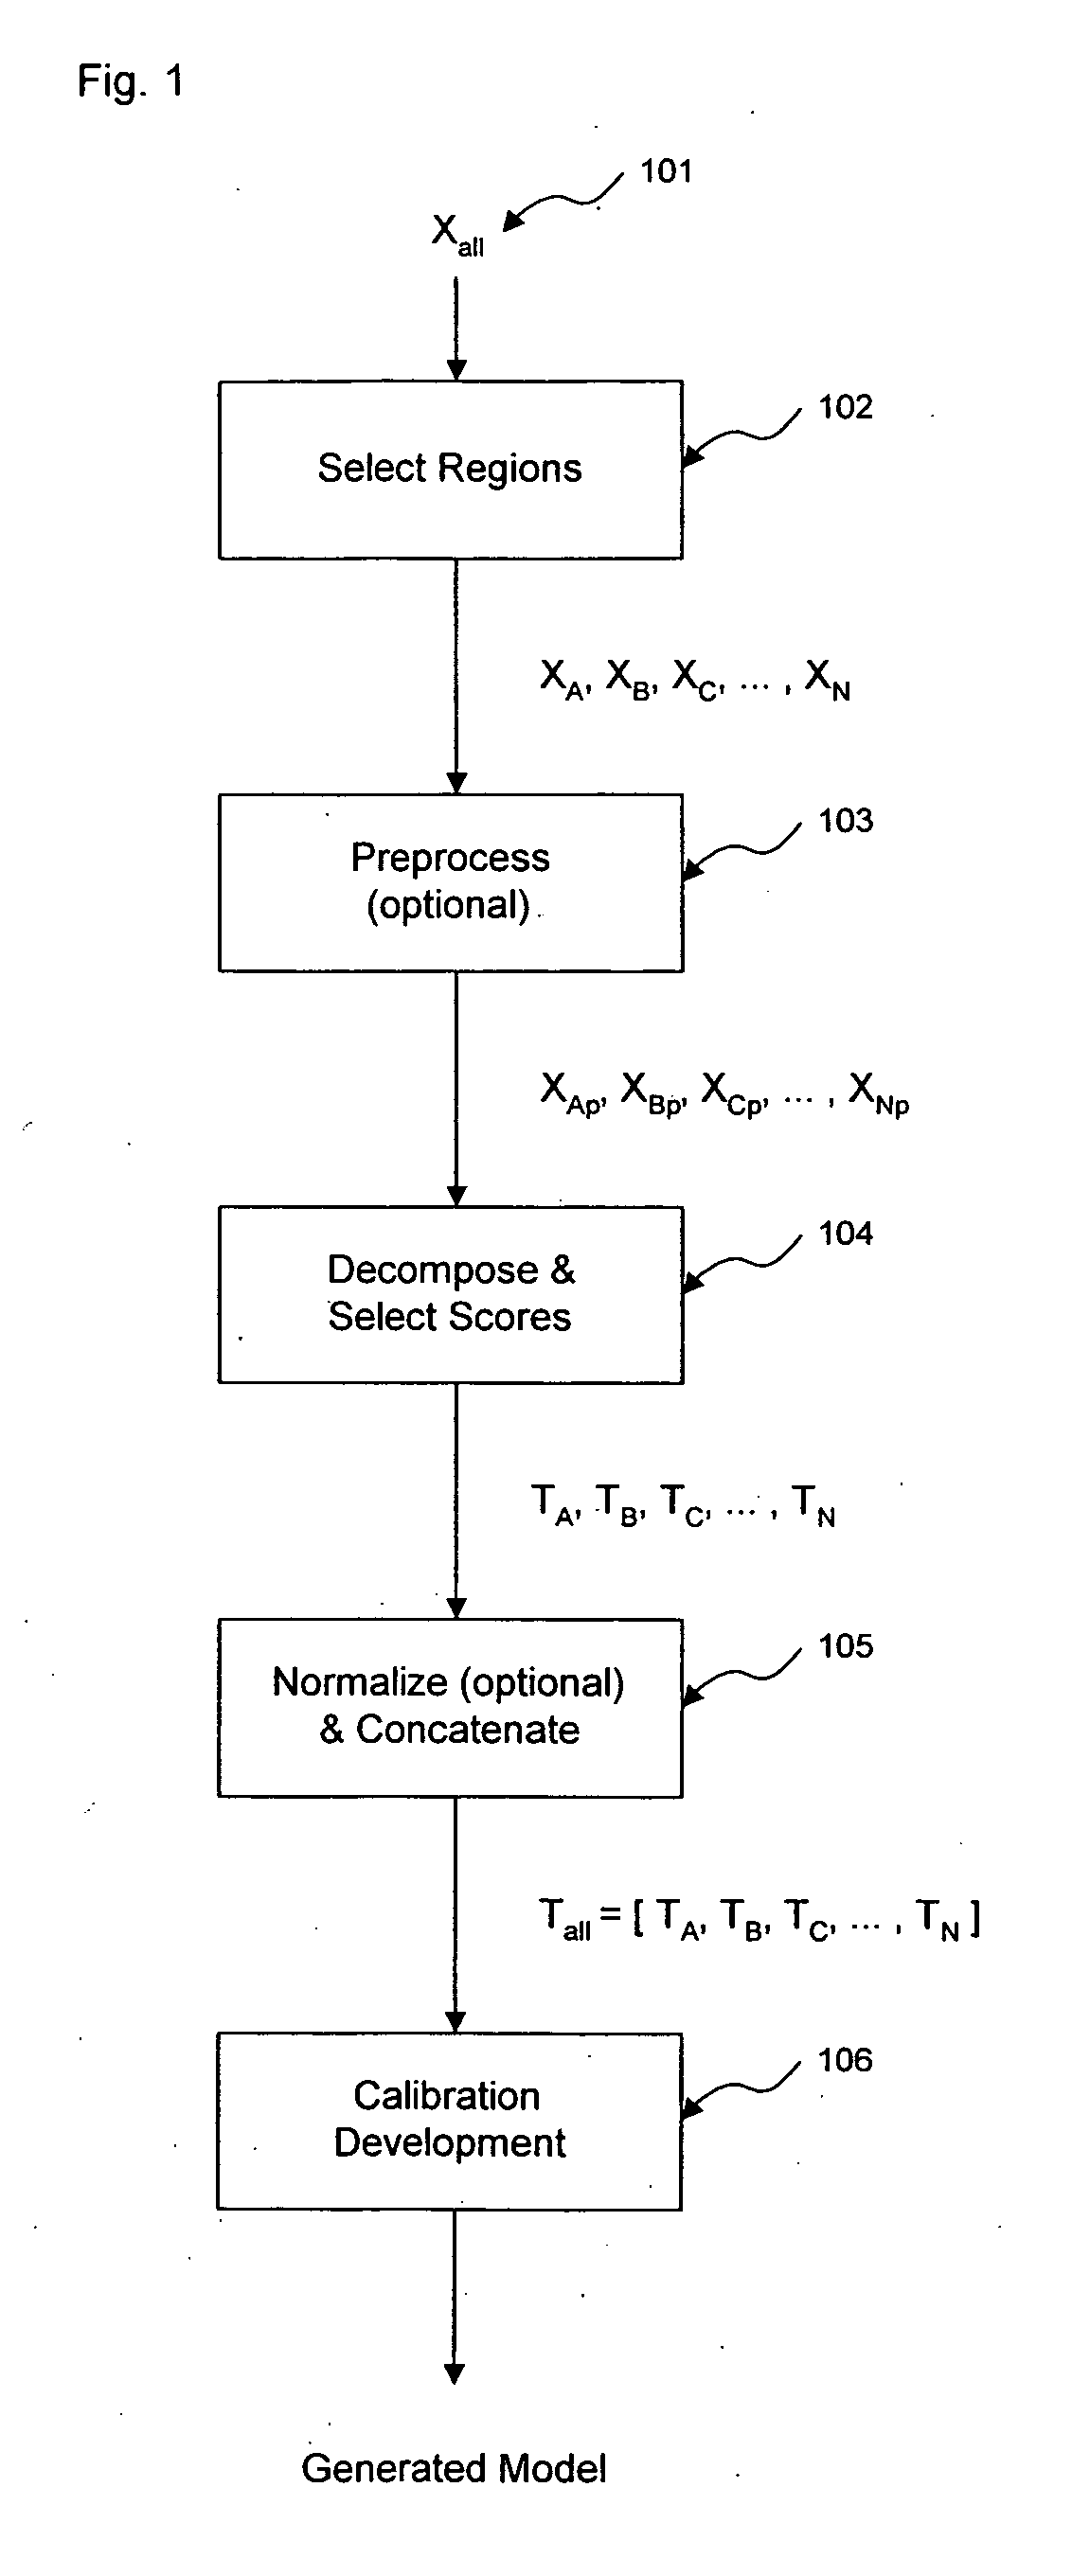
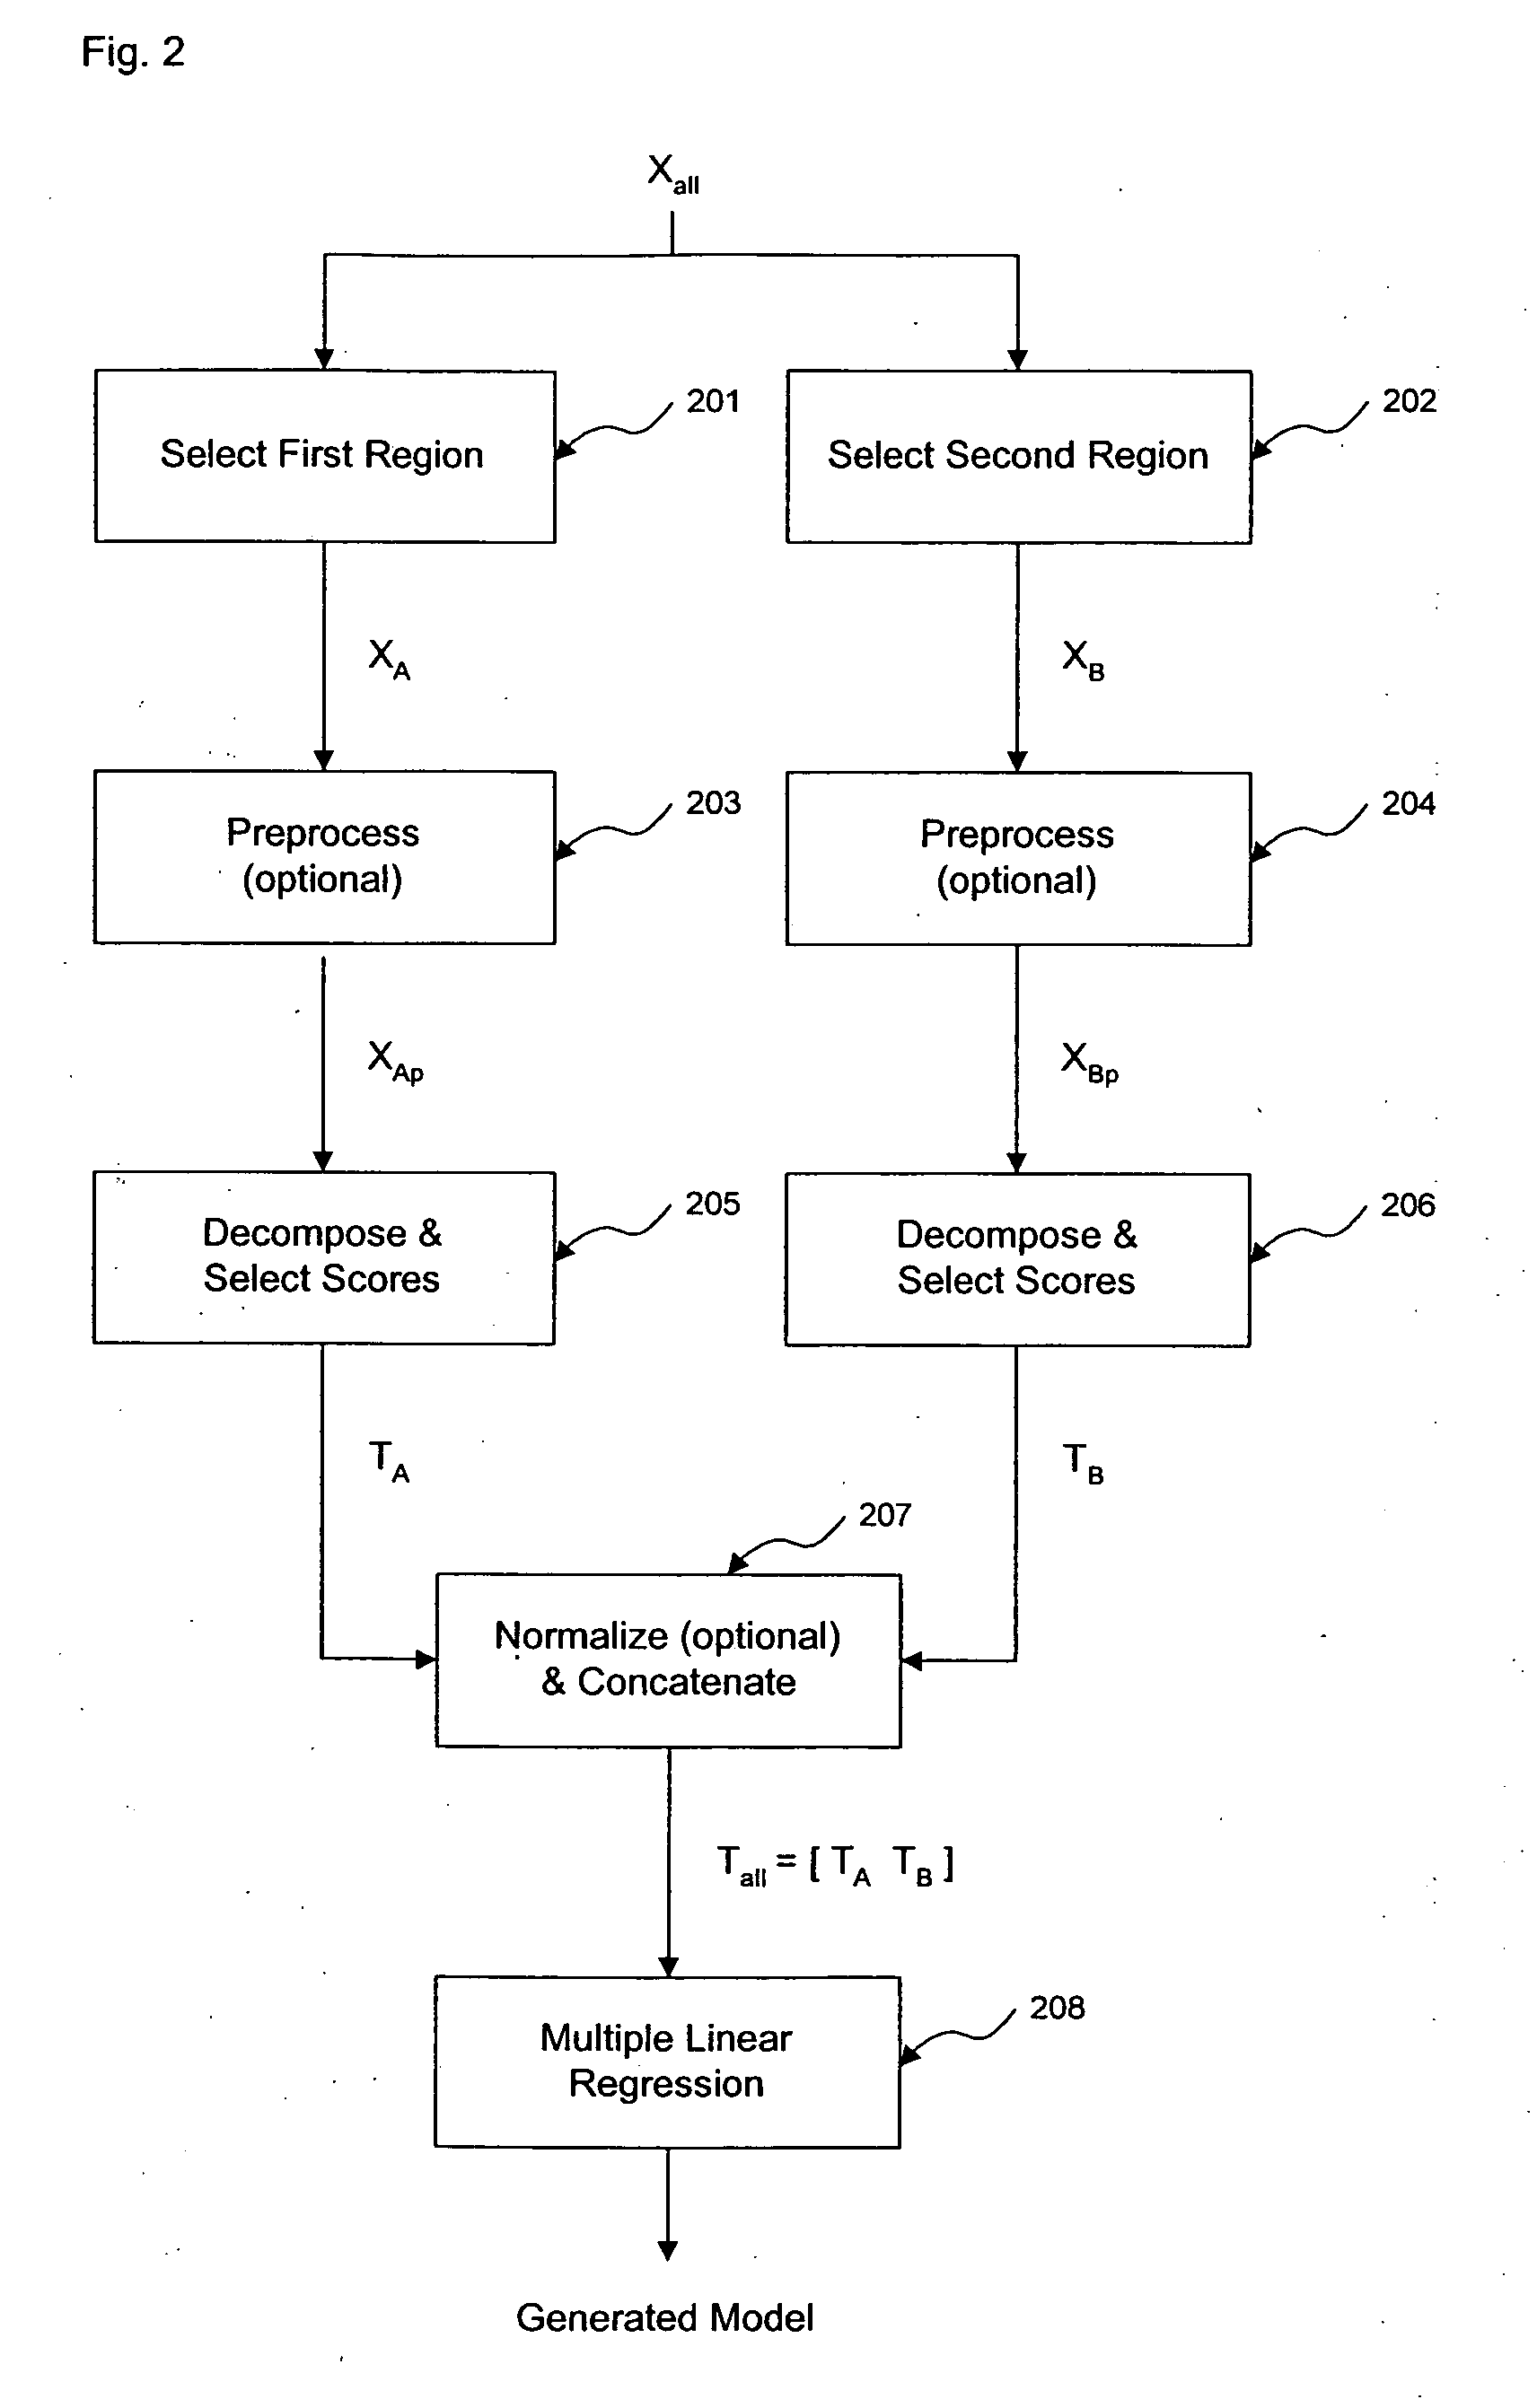
[0060] A specific example of separately decomposing two matrices with one of the matrices having a region of larger variance is provided. As described below, the example uses near-infrared (near-IR) spectra collected noninvasively to build a model subsequently used to estimate glucose concentrations. The initial matrix of spectra, Xall, are processed with a traditional single decomposition analysis for comparison with the two separate decomposition approach.

[0061] In this example, decomposition of two spectral regions of a data matrix of noninvasive spectra of human tissue is performed so that determination of blood glucose concentration is provided. For comparative purposes, a parallel analysis with a single decomposition is also performed. A detailed description follows.

[0062] It is determined that signal, noise, resolution, and pathlength considerations often dictate that the analysis of noninvasive near-IR spectra of aqueous solutions having small analytical signals, such as t...

example 2

[0076] The analyzers used in the first example were used to collect the data set used in this example. The single data matrix based decomposition uses a calibration matrix representing 2939 spectra collected on a total of six subjects using three analyzers over a five week period. The two decomposition approach uses a data set representing 846 spectra collected using five subjects on a total of six analyzers. For both the single and multiple decomposition calibrations, a single prediction data set is used. The prediction matrix represents 141 samples from five different subjects collected over a total of six visits on a single analyzer over a period of eight days collected roughly five months after the end of collection of the calibration data matrices.

[0077] The single decomposition approach applied to Xall in absorbance preprocesses the spectra in four steps: 1) a 41-point first derivative Savitsky-Golay smoothing convolution; 2) multiplicative scatter correction; 3) mean centeri...


PUM


Abstract

The invention provides for transformation of a section of a data block independently of the transformation of separate or overlapping data blocks to determine a property related to the original matrix, where each of the separate or overlapping data blocks are derived from an original data matrix. The transformation enhances parameters of a first data block over a given region of an axis of the data matrix, such as signal-to-noise, without affecting analysis of a second data block derived from the data matrix. This allows for enhancement of analysis of an analyte property, such as concentration, represented within the original data matrix. In a first embodiment of the invention, a separate decomposition and factor selection for each selected data matrix is performed with subsequent score matrix concatenization. The combined score matrix is used to generate a model that is subsequently used to estimate a property, such as concentration represented in the original data matrix. In a second embodiment, each data matrix is independently preprocessed. Demonstration of the invention is performed through glucose concentration estimation from noninvasive spectra of the body.

Description

CROSS REFERENCE TO RELATED APPLICATIONS [0001] This document claims priority to U.S. provisional patent application No. 60 / 558,610 filed Mar. 31, 2004 (attorney docket number SENS0007PR). This document also claims priority to U.S. patent application Ser. No. 09 / 630,201, filed Aug. 1, 2000 (attorney docket no. IMET0002CIP-2), which claims priority to U.S. patent application Ser. No. 09 / 610,789 filed Jul. 6, 2000 (attorney docket number IMET0002CIP) now abandoned, which claims priority to U.S. patent application Ser. No. 08 / 911,588, filed Aug. 14, 1997 (attorney docket number IMET0002), now U.S. Pat. No. 6,115,673. This document also claims priority to U.S. patent application Ser. No. 10 / 472,856, filed Sep. 18, 2003 (attorney docket no. SENS0011), which claims priority to PCT application number PCT / US03 / 07065, filed Mar. 7, 2003, which claims priority to U.S. provisional patent application No. 60 / 362,885, filed Mar. 8, 2002 (attorney docket number IMET0074PR). U.S. patent application ...

Claims


Application Information

Patent Timeline
07 Jul 2005
Publication
US20050149300A1
IPC
A61B5/00; G01N21/35; G06F17/10
CPC
A61B5/14532; A61B5/1455; G01N21/359; A61B2560/0223; A61B5/1495
Inventors
RUCHTI, TIMOTHY L.; LORENZ, ALEXANDER D.