

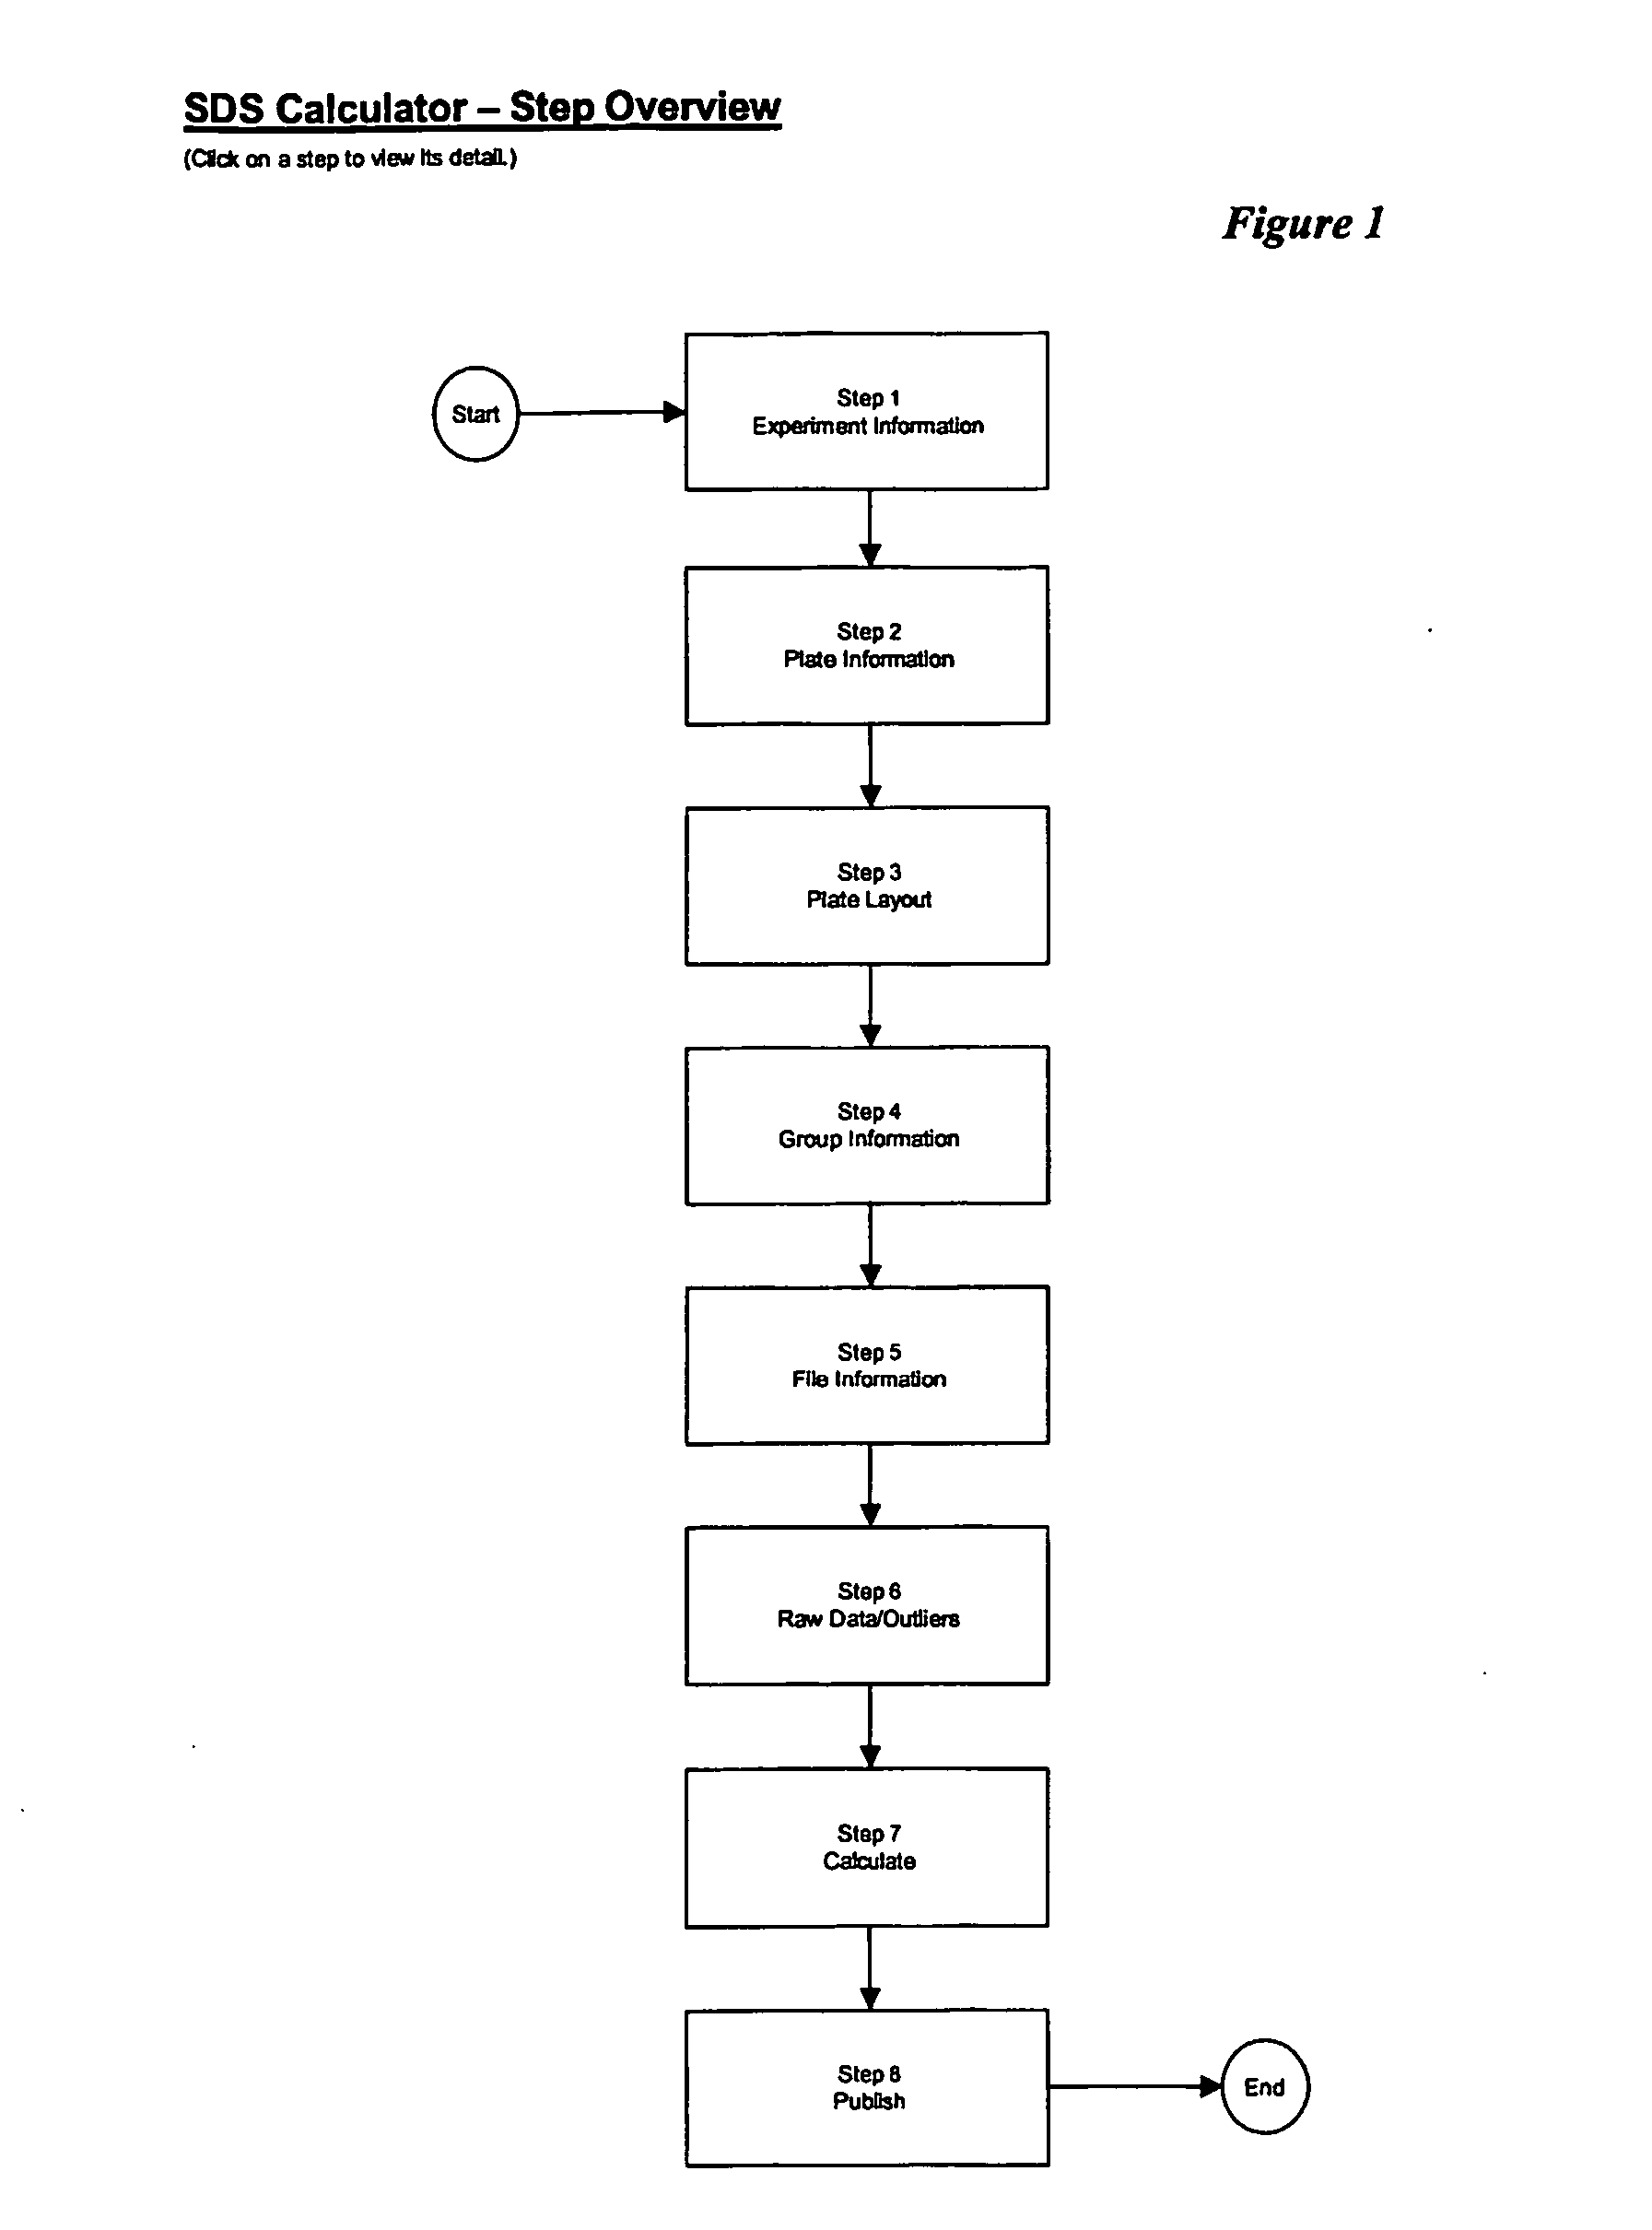
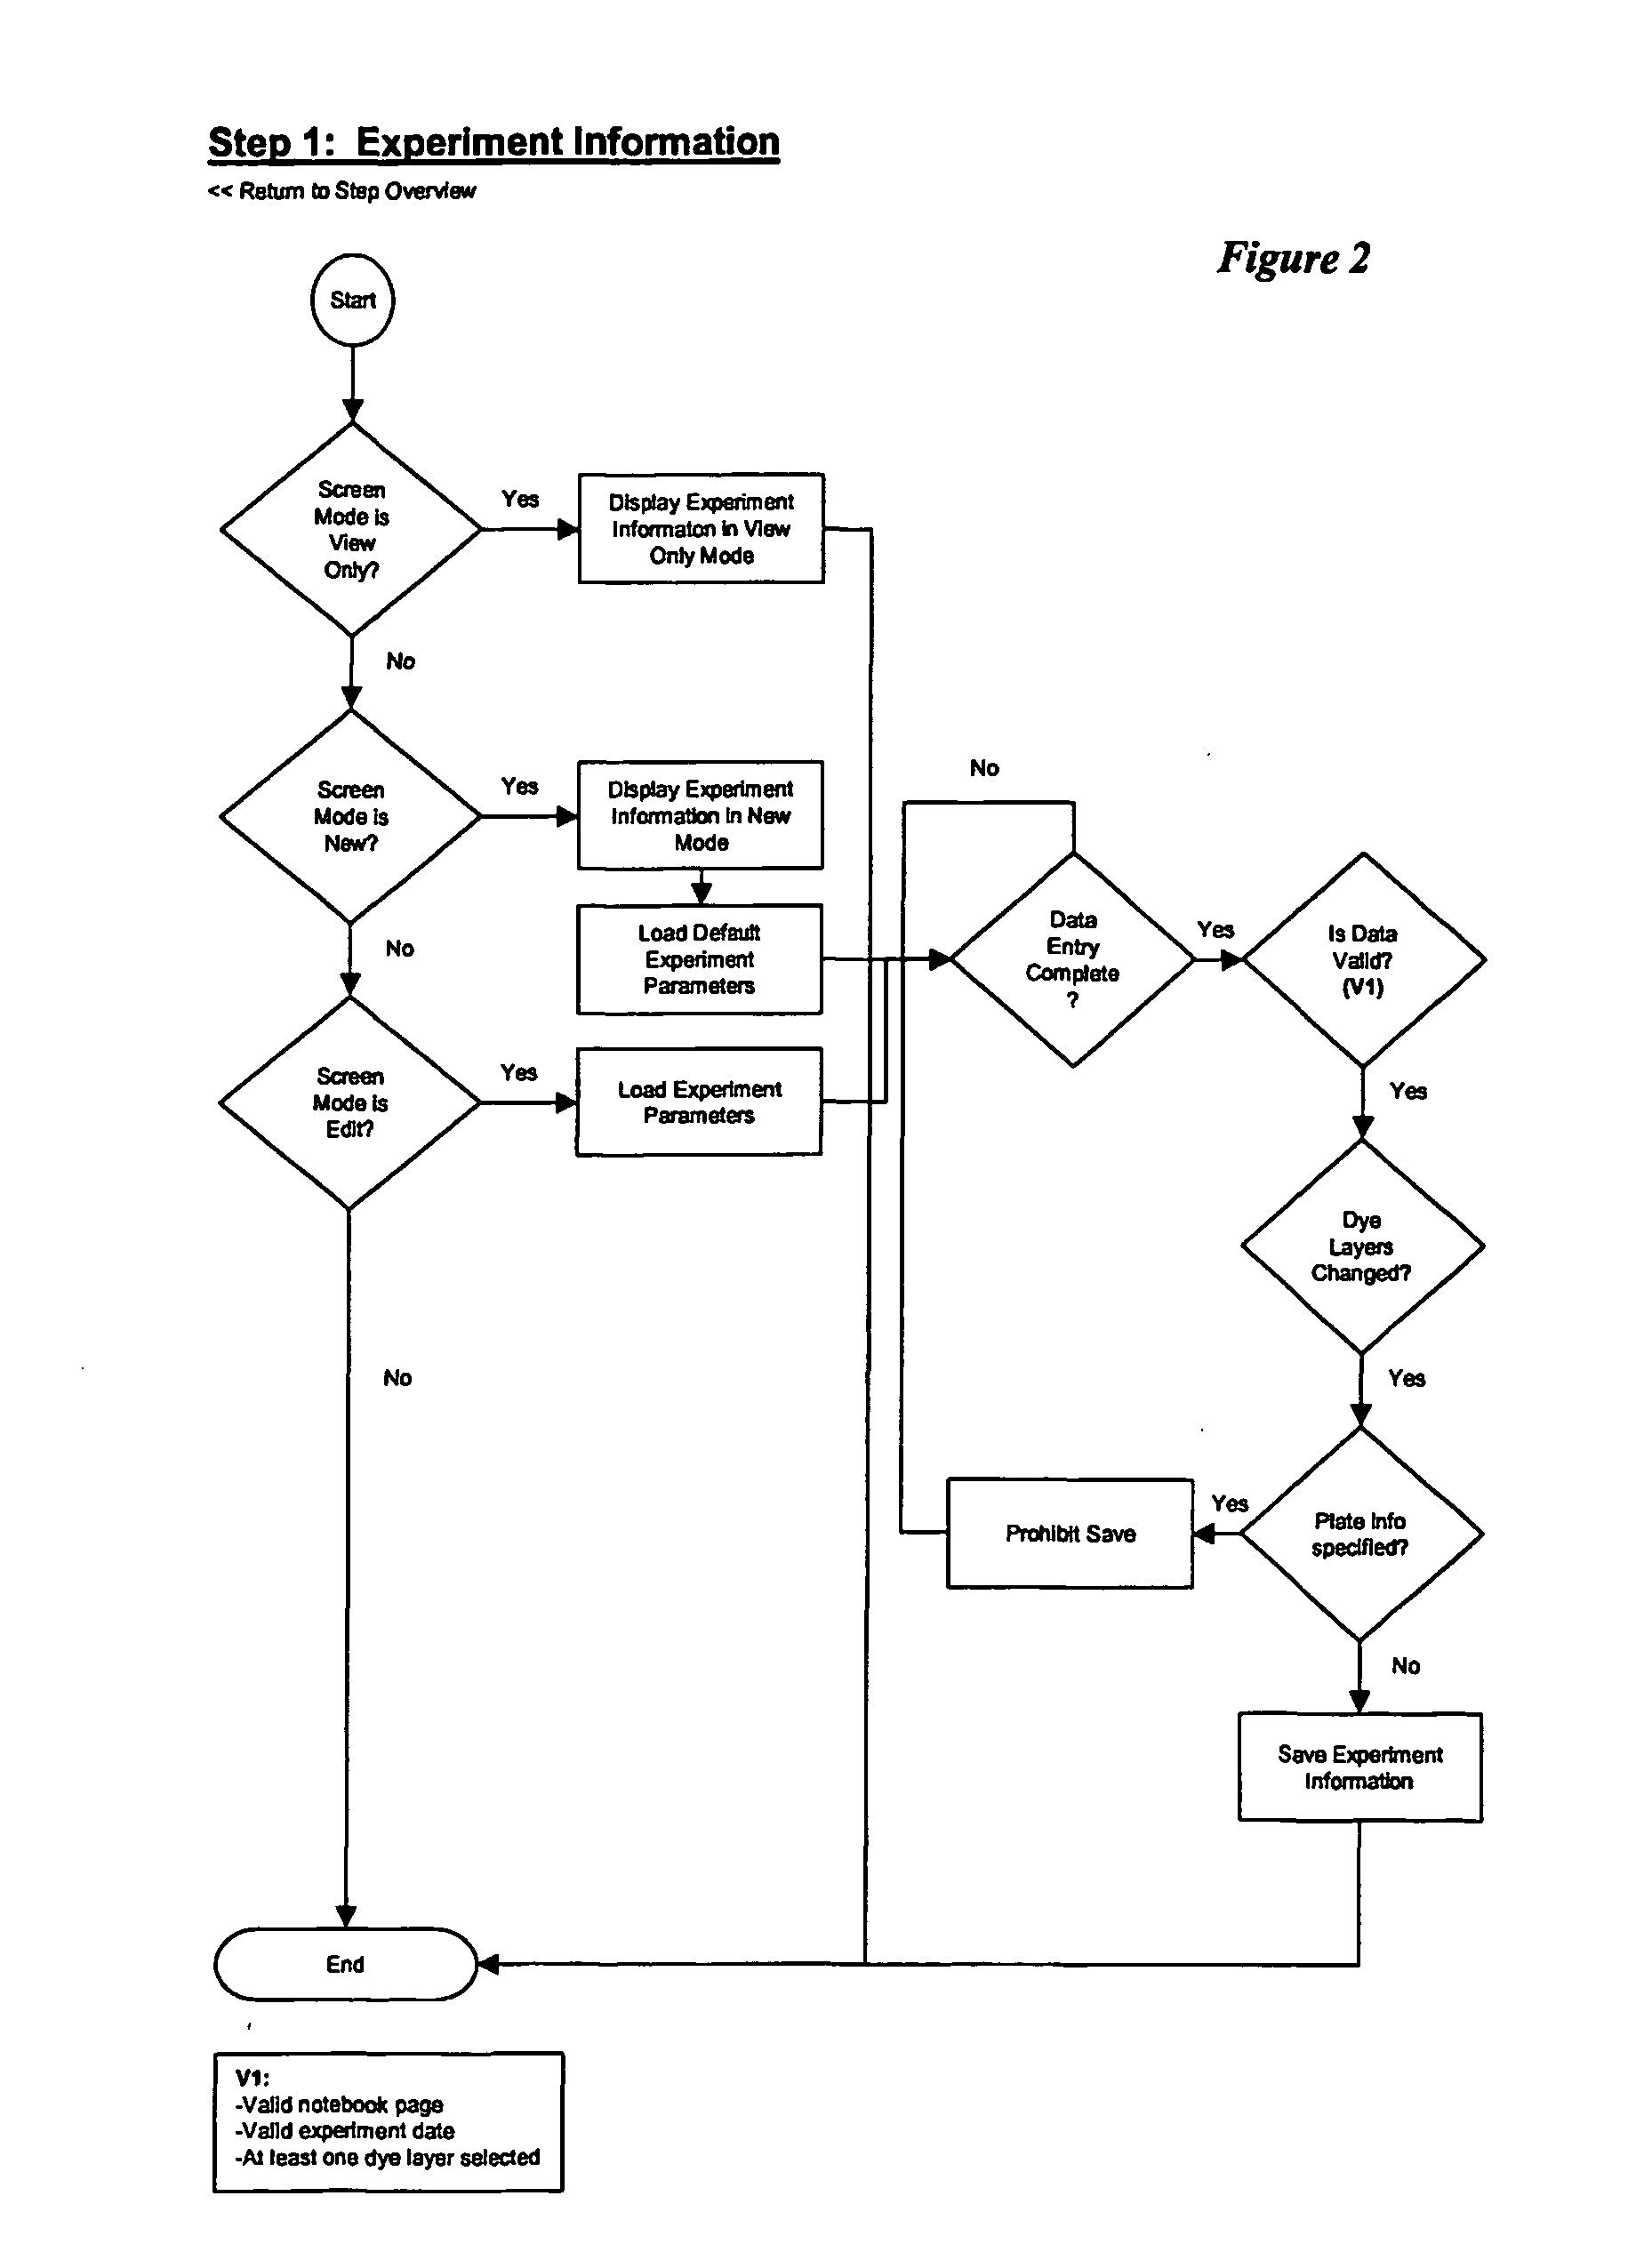
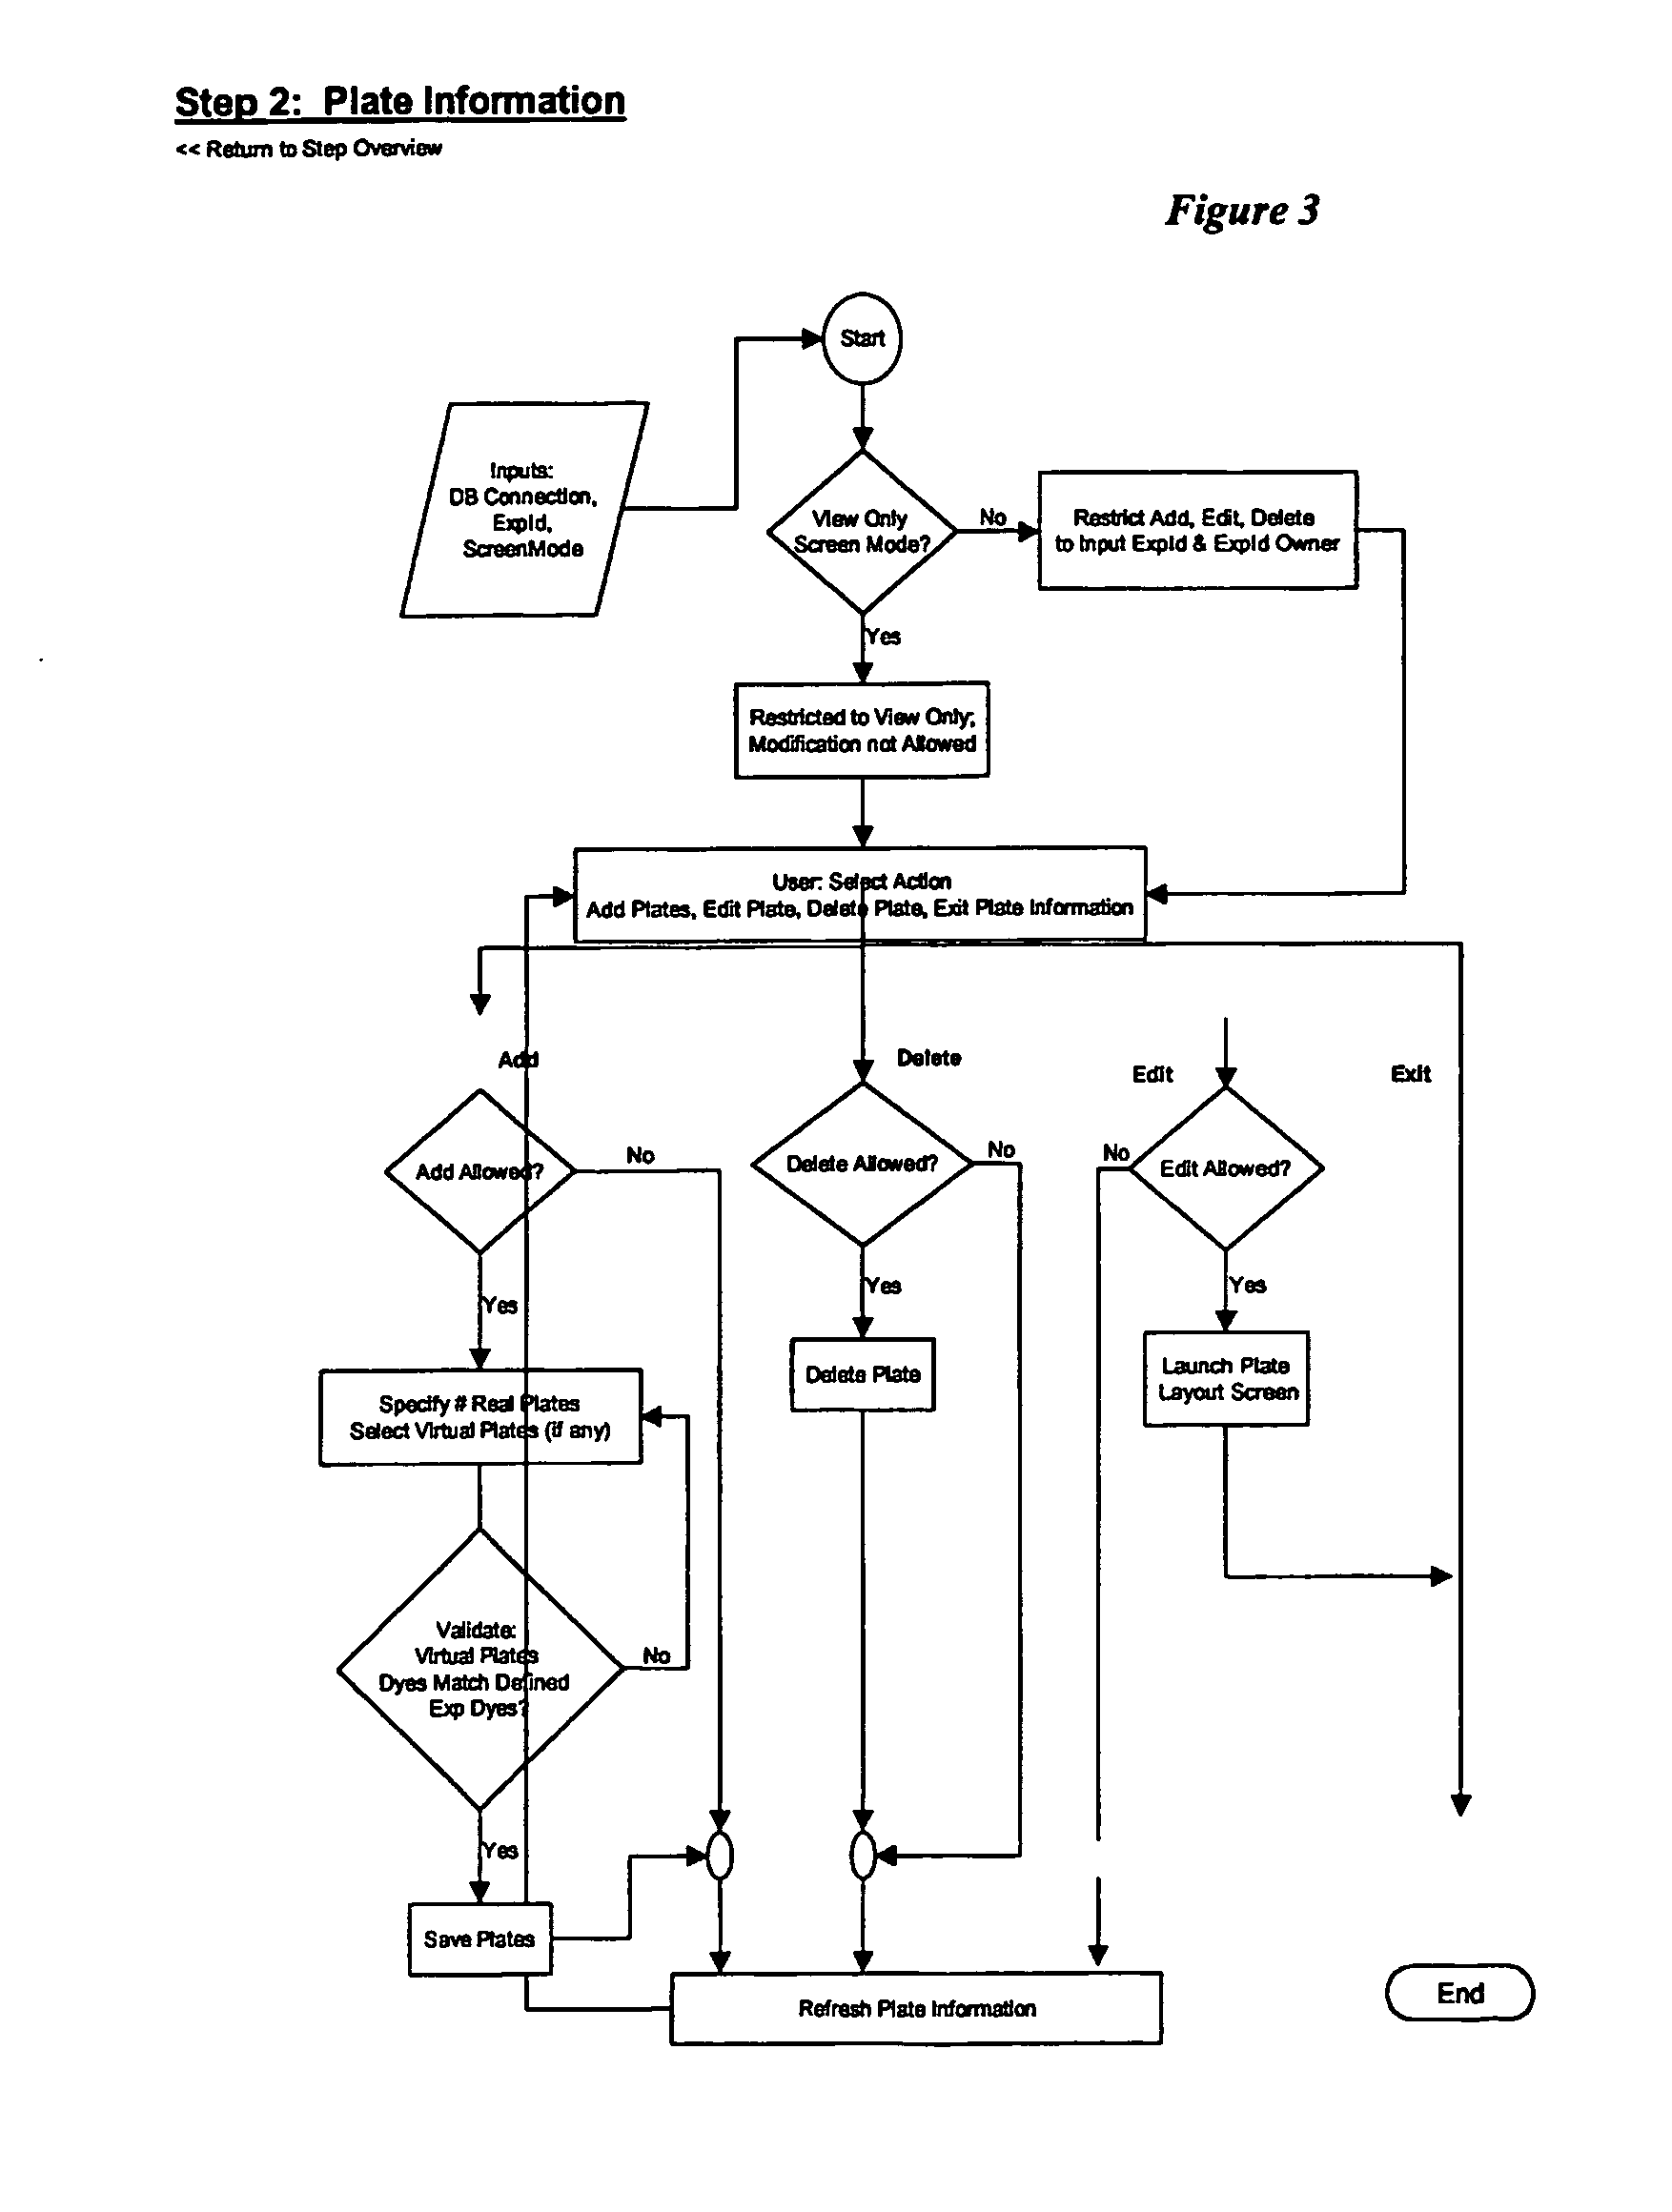
Sequence detection system calculator
- Summary
- Abstract
- Description
- Claims
- Application Information
AI Technical Summary
Benefits of technology
Problems solved by technology
Method used
Image

Examples
example 1
Experimental Analysis of the Expression of Four Genes in Three Groups
[0151] A gene expression experiment was performed analyzing the effects of two different experimental conditions (Groups A and B) relative to a control (Group V) on the expression of five different genes (Genes 1-5). RNA was isolated from seven replicates for the control and nine replicates for the experimental conditions. After isolation, samples are subjected to reverse transcriptase PCR analysis. Each sample was amplified with an endogenous control FPR as well as the FPR's for each of the five genes. Note, this example is not multiplex; multiplex has more than one set of primers and probes in the same reaction well with each probe labeled with a different fluorescent reporter dye. The analysis was performed in duplicate for each sample, requiring a total of four plates to perform all amplifications.
[0152] The analysis was initiated for five different genes under three separate experimental conditions. Each exp...
PUM
| Property | Measurement | Unit |
|---|---|---|
| Fraction | aaaaa | aaaaa |
| Fraction | aaaaa | aaaaa |
| Fraction | aaaaa | aaaaa |
Abstract
Description
Claims
Application Information