Condition monitoring in technical processes

Active Publication Date: 2005-08-04
RENNER PETER
5 Cites 16 Cited by

AI-Extracted Technical Summary

Problems solved by technology

Changes in machines, apparatuses and installations are caused by wear, corrosion, deposits, plugging, contamination, and nonspecifically occurring operational malfunctions.
They have the disadvantage that a very great cost expenditure is occasioned because the application in question must be trained.
The results obtained are rather meager.
Other methods also address only partial aspects and have not met with total success.
The dif...

Benefits of technology

[0004] It is an object of the invention to make a contribution in order that machines and installations are better utilized, their service life is extended, reliability is improved, the loss of valuable materials is avoided, test results are optimized, and energy con...

Abstract

The invention makes a contribution in order that machines and installations are better utilized, their service life is extended, reliability is improved, the loss of valuable materials is avoided, test results are optimized, and energy consumption is diminished. It is an expert system that acquires and assesses the condition of installations, machines and apparatuses. The mechanism proceeds from a normal condition and permanently observes short-term, medium-term and long-term changes. If variations in the normal condition are detected promptly, major instances of damage can be avoided by promptly performing corrective actions before major instances of damage associated with prolonged downtimes occur.

Application Domain

Technology Topic

Condition monitoringNormal conditions +7

Image

  • Condition monitoring in technical processes
  • Condition monitoring in technical processes
  • Condition monitoring in technical processes

Examples

  • Experimental program(1)

Example

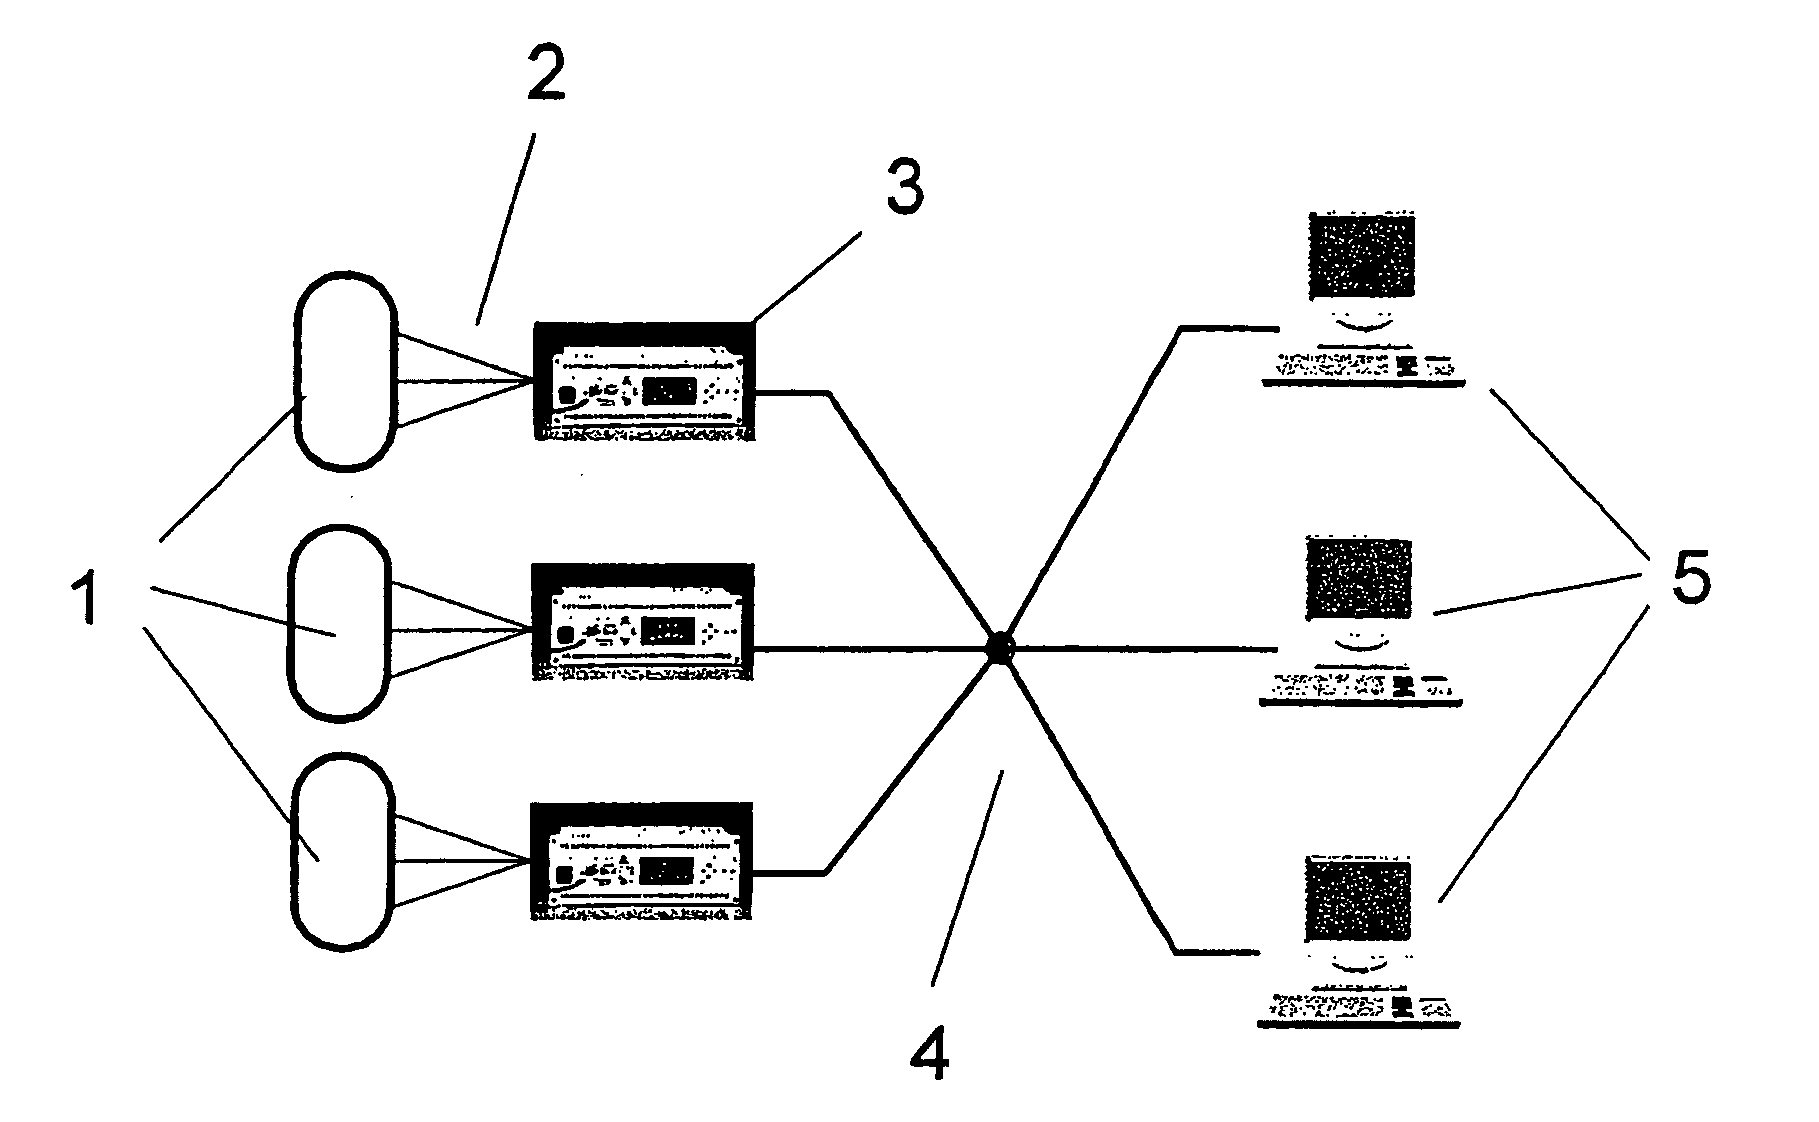
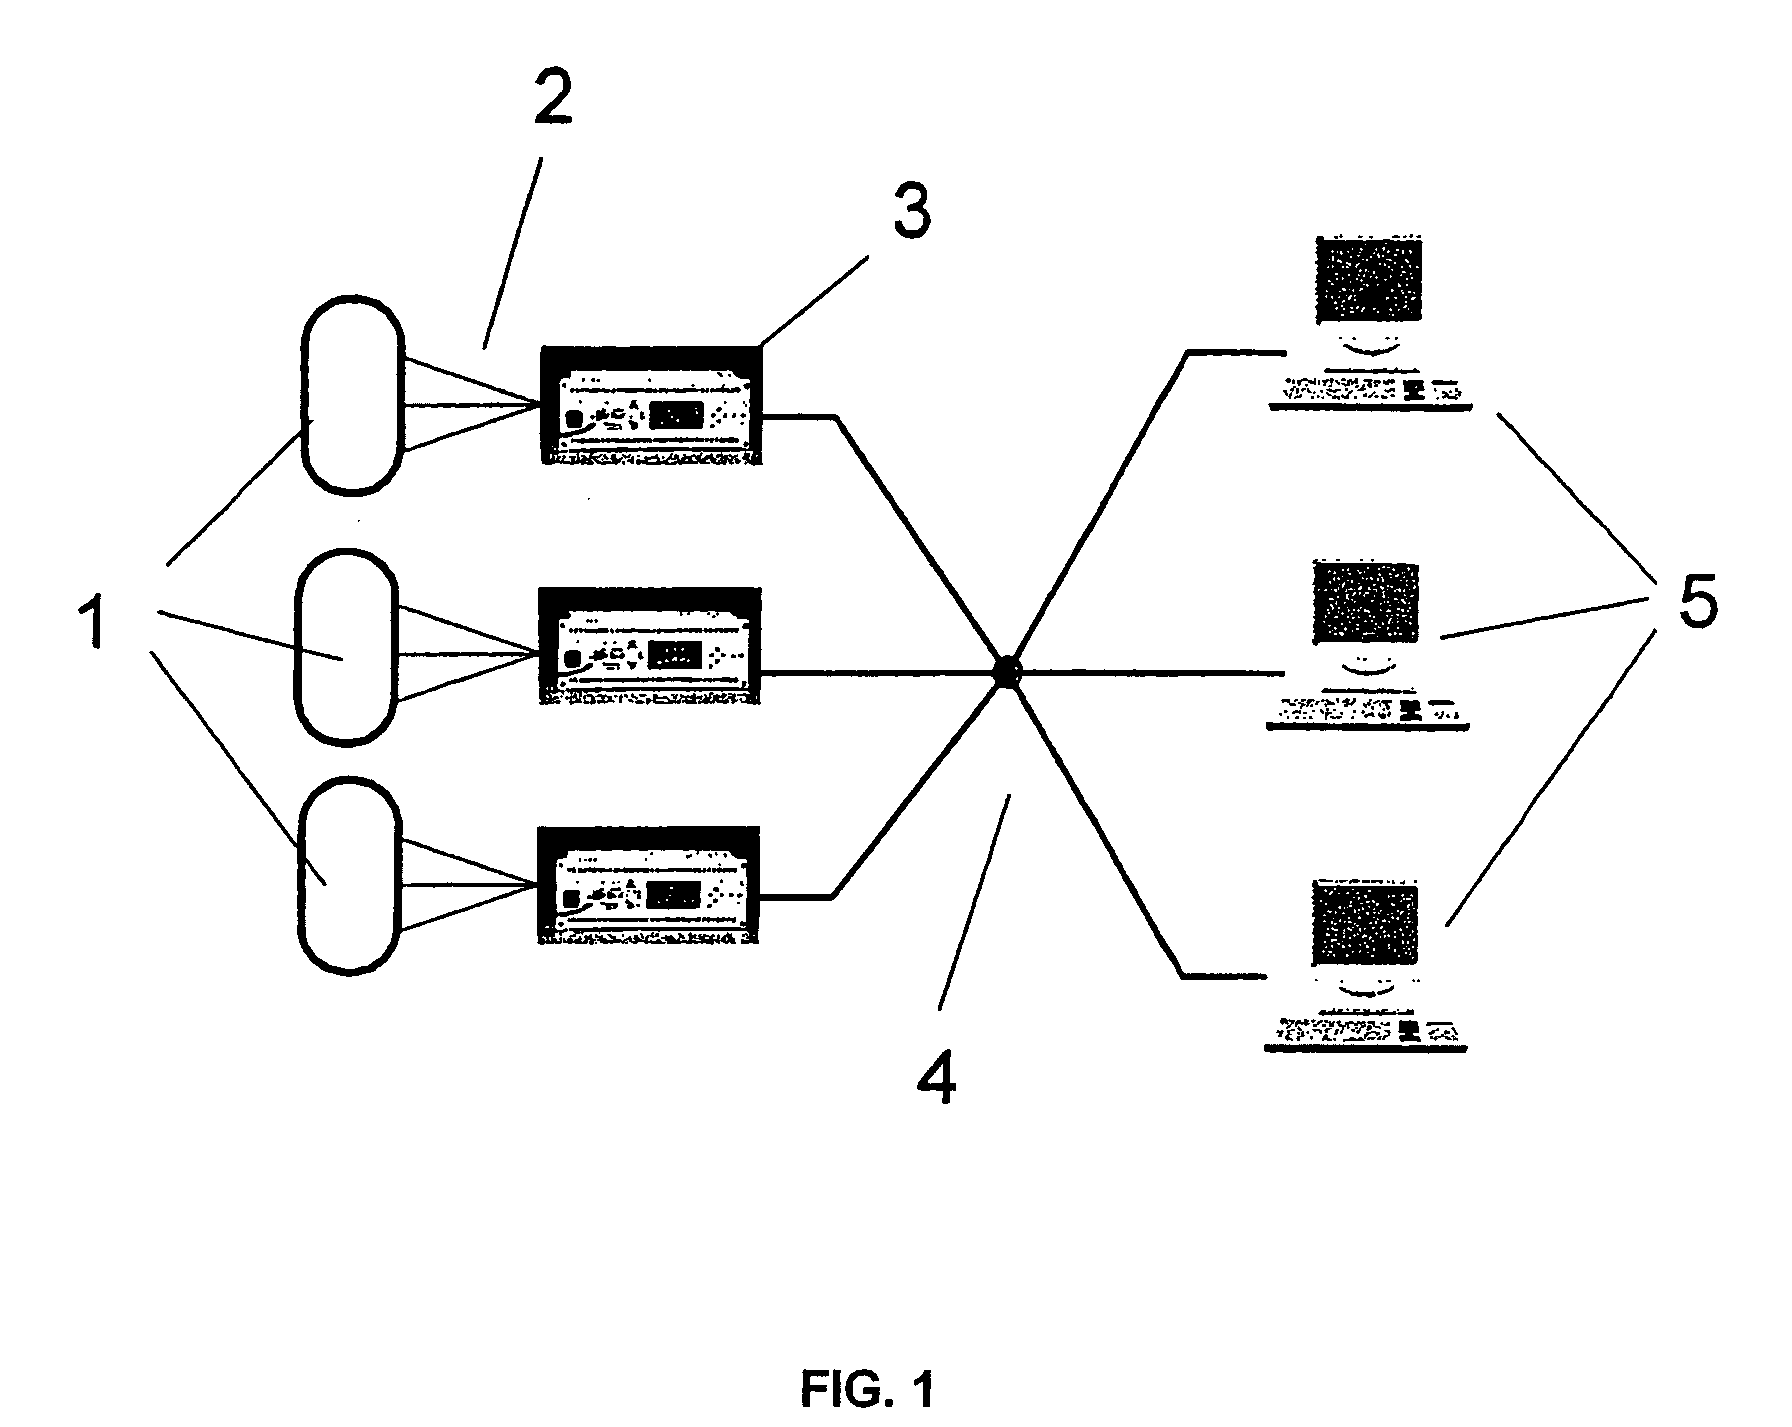
[0036] The reference characters in FIG. 1 have the following meanings: [0037] 1 processes that are being monitored; [0038] 2 lines serving as connections between the sensors of the processes and measurement units; [0039] 3 measurement units as interfaces between the processes and the PCs; [0040] 4 a data network serving as data connection between the measurement units and the PCs; and [0041] 5 PCs on which the monitoring software is installed.
[0042] The function according to FIG. 1 is next described. Measurement units 3 serve as interface between processes 1 whose condition is to be monitored. In processes 1 there are sensors, which are connected to measurement units 3 via connecting lines 2. Measurement units 3 are in turn connected to PCs 5 via data network 4. In this way, analog and digital signals of the sensors can be conveyed to the PCs. The governing software, which carries out monitoring tasks in combination with the functions of the measurement units, is installed on PCs 5.
[0043] The reference characters in FIG. 2 have the following meanings: [0044] 7 a drive shaft; [0045] 8 to 13 bearing positions of the drive shaft; [0046] 14 to 19 sensors that acquire the temperature of the bearing positions; [0047] 20 a drive motor; [0048] 21 and 22 gears for driving connected equipments, for example air compressors; [0049] 23 a measurement unit as interface between the temperature sensors; and [0050] 24 PCs for machine monitoring and process control.
[0051] The function according to FIG. 2 is next described. Such a drive can serve to drive large pumps, compressors and the like via gears 21, 22. Electric motor 20 drives shaft 7. Shaft 7 is provided with six bearings at bearing positions 8, 9, 10, 11, 12, 13. Sensors 14, 15, 16, 17, 18, 19 serve to acquire the temperatures of the individual bearing positions. The temperature signals are supplied to a measurement interface 23 via lines. Depending on the design of measurement interface 23, it can take over a number of tasks. If temperature sensors 14, 15, 16, 17, 18, 19 are of thermocouple type, they deliver millivolt signals. Measurement interface 23 transforms these signals into digital measured values in degrees Celsius. The measured temperature values pass via a data network to PCs 24. The governing software for tracking small changes, in this case variations in the temperature values of bearing positions 8 to 13, is installed on one of these PCs 24. Such temperature values are not constant. They vary with the rotation speed of the shaft, the radial force acting on individual bearing positions 8 to 13, and the ambient temperature. It appears impossible to track small changes that are relevant to the condition of bearings 8 to 13. Small changes in the temperature values of individual bearings 8 to 13 are significant for the anticipated service life. Progressive temperature variations, even if they are small, point to a failure of the bearing in the near future. In case of abrupt changes, a crash is immediately imminent. In order to track small changes, the internal relationship through the common shaft rotation speed of shaft 7 is utilized.
[0052] The reference characters in FIG. 3 denote the following things: [0053] 25 a measuring device serving as interface between the process and the PCs; [0054] 26 a module (acquire and group measurement data). The measurement data are read by the interface and the measurement channels are combined into reference groups; [0055] 27 a module in which the channels of the reference groups are split into identification channels and condition channels; [0056] 28 a further module (identification of quasi-static phase of operation) tests whether a process is in the quasi-static phase of operation; [0057] 29 a module that makes sure dummy values replace real measured values in the measurement series if the result in 28 is negative; [0058] 30 a module in which the measured values and the dummy values are compressed into statistical values; [0059] 31 a module in which the statistical values of the time series are combined into test blocks; [0060] 32 a module in which a test is performed to ascertain whether, within a test block, there is a percent change in the compressed measured values that exceeds a limiting value. If this is the case, the percent change in this test block is compared with the mean of the changes in the other test blocks. If the difference exceeds a limiting value, the shape of the curve of the test block is tested in the subsequent evaluations; [0061] 33 a module in which a test is performed to ascertain whether the changes in the values of the test block took place in linear or progressive fashion; [0062] 34 a module in which a test is performed to ascertain whether the trend, if it is linear, is rising or falling; [0063] 35 a module in which a test is performed to ascertain whether the trend, if it is progressive, is rising or falling; [0064] 36 observation lists, which supply the service personnel with information items concerning developing malfunctions that are less severe; [0065] 37 warning lists, which supply the service personnel with information items concerning developing severe malfunctions.
[0066]FIG. 3 shows the flowchart for the processing of data for a reference group. A plurality of reference groups can be dealt with at the same time. The system is not restricted to temperature measurements. For example, groups for pressure courses in the case of pumps and compressors, flow rates of liquid or gaseous media, etc., can be provided as reference groups. All available measurement data that reflect the effect of wear, contamination, corrosion and operational malfunctions can be incorporated into the system. Thus the user obtains an overall picture of the machine condition and can now assess the condition of the machines or installations: Reported operational malfunctions are tightly limited on the basis of the error that has occurred. Developing failures (crashes) are reported. Optimal times for corrective work, which reflect the condition of the installation, can be established by the service personnel.
[0067] The function according to FIG. 3 is not described. Measuring device 25 serves as interface between the process and the PCs. Here the sensor signals are conditioned and converted to physical variables such as pressures, temperatures, flow rates, vibration intensities. Further, computed values can be formed, which in turn serve as (virtual) measurement channels and are equivalent to the true measurement channels. A simple example would be a temperature difference where heat transfer is to take place with the lowest possible losses. These measured data are transduced and passed on to PCs as digital information items via data network.
[0068] What is more, the tests and data-processing operations described in what follows could already be executed in measuring device 25, so that the task of the PCs is reduced to a man-machine interface. Such an approach is far less susceptible to malfunctioning, since measuring instrument 25 is conceived, in terms of design, as a field instrument. Failures of the data network and of the PCs would then not be such as to interrupt the continuing checks.
[0069] In module 26 the designer of a monitoring apparatus for a special machine has the opportunity to combine given associated measurement channels into reference groups. The expression measurement channels, or briefly channels, denotes measurement chains formed from sensors, lines and measurement electronics. Here such channels are combined into reference groups as have measured values showing mutually dependent tendencies. Such measured values are for example temperatures, pressures, flow rates, rotation speeds, etc. The expression dependent measured variables refers to such as bear an internal relationship to the function or design of a machine or installation.
[0070] For example, the individual exhaust temperatures of a large diesel engine with a plurality of cylinders are in an internal relationship. They fluctuate in dependence on external parameters, the fluctuation being roughly proportional. It is governed by the engine rotation speed and engine power.
[0071] In module 27, the channels of the reference group are split into identification channels and condition channels. The identification channels serve to identify the quasi-static phase of operation. In the case of the diesel engine, the temperature of the coolant can be employed. Here it is possible to proceed in such fashion that a condition of a steady state is determined. This condition is characterized in that, during a certain time, the water temperature may fluctuate only within a tolerance band. Thus the quasi-static phase of operation can be identified by the fact that the engine is running and the coolant temperature remains constant within 4° C. during 10 minutes. The condition channels of the reference group define the condition of the installation or of a portion of the installation. In the case of monitoring of the engine, the exhaust temperatures, the cylinder pressures and cylinder head temperatures can be employed.
[0072] In module 28, a test is performed to ascertain whether the process is in the quasi-static phase of operation or in a transient dynamic condition. The identification conditions are tested continually. Only if the result is true do the measured values become the basis for further investigations.
[0073] Module 29 is executed if the result of the test in module 28 is false and thus the dynamic condition prevails. In module 29, dummy values are inserted into the measurement series in place of real measured values. Thus the times of dynamic conditions are bridged over with dummy values. The dummy values take on the value of the real measured value last measured. Because of the dummy values, an examiner of trend charts sees a quasi-continuous data stream, the times, dynamic conditions and stoppages being separately characterized.
[0074] In module 30, the measured values including the dummy values are compressed into statistical values (means). Thus the further evaluation has access to second, minute, hour, day and week means, which form statistical time series.
[0075] In module 31, the means of the time series are combined into test blocks. Such a test block has a fixed number of means. In the further tests, the test blocks are examined as a whole. The test blocks are set up in moving fashion. This means that the oldest value is dropped from the test block and the newest value is incorporated. The means are converted to percent values so that test blocks of different channels can be compared with one another.
[0076] In module 32, a test is performed to ascertain whether, within a test block, there is a percent change in the compressed measured values. The percent change in a test block is referred to as the swing. If the swing exceeds a limiting value, the swing is compared with the mean of the swings of the other test blocks (channels). If the difference exceeds a limiting value, then in the subsequent evaluations the shape of the curve of the test block is tested. If, on the other hand, the difference remains below the limiting value, then no further tests take place.
[0077] In module 33, a test is performed to ascertain whether the changes in the values of the test block have taken place in linear or progressive fashion. This is done mathematically with the aid of the second derivative. If the second derivative is tangent to or exceeds a limiting value, the curve of the measured values for the test block is assessed as progressive. If the value of the second derivative remains below the limiting value, the curve is assessed as linear. Progressive changes are rated as very much more severe than linear changes and lead, in what follows, to distinct warning instructions to the service personnel.
[0078] Module 34 is invoked if the curve shows a linear trend. Here it is investigated whether the trend is linearly rising or falling. In order to localize an instance of damage it may be advantageous to know whether the out-of-control measured value displays a rising or falling tendency. A rising temperature, for example, points to an instance of developing damage. On the other hand, if the tendency is falling, this might point to a malfunction of a sensor. Such linear malfunctions lead to entries in observation lists 36, because they are rated as less severe.
[0079] Module 35 is invoked if the curve shows a progressive trend. Here it is investigated whether the trend is progressively rising or falling. In order to localize an instance of damage, it may be advantageous to know whether the out-of-control measured value displays a rising or falling tendency. A progressively rising temperature, for example, points to an imminent crash. Such progressive modes of behavior lead to entries in warning lists 37.
[0080] The entries in observation lists 36 and in warning lists 37 have fixed and individually configurable components. For the prognosis of deviations that have occurred, a number of factors are decisive, such as the course (shape of the curve), the measured variable causing the deviation, and the time series. It makes a very great difference whether a deviation shows up on a scale of seconds or in the week means. Deviations on a scale of seconds indicate suddenly occurring operational malfunctions. Deviations on a scale of hours and days, especially if they are progressive, give reason to fear an imminent crash. Deviations on a scale of weeks point to natural wear.

PUM

no PUM

Description & Claims & Application Information

We can also present the details of the Description, Claims and Application information to help users get a comprehensive understanding of the technical details of the patent, such as background art, summary of invention, brief description of drawings, description of embodiments, and other original content. On the other hand, users can also determine the specific scope of protection of the technology through the list of claims; as well as understand the changes in the life cycle of the technology with the presentation of the patent timeline. Login to view more.

Similar technology patents

Linkage coupling apparatus

Owner:MCCLELLAND KENNETH RAE

Immobilization method for improving activity of microorganisms in well cementation cement paste

InactiveCN111393088AImproved compactness and impermeabilityExtend service lifeDrilling compositionWell cementingMineralogy
Owner:CHINA UNIV OF GEOSCIENCES (WUHAN)

System for manufacturing linear gear and the method thereof

InactiveUS20090158804A1Extend service lifeLow loadShaping toolsMetal-working feeding devicesGear toothHigh load
Owner:ILJIN LIGHT METAL CO LTD

Classification and recommendation of technical efficacy words

Why Eureka
Try Eureka