Method and apparatus for presentation of noninvasive glucose concentration information

a glucose concentration and information technology, applied in the field of non-invasive glucose concentration information presentation methods and apparatuses, can solve the problems of current monitoring techniques that discourage regular use, diabetes is a leading cause of death and disability worldwide, and the production and use of insulin are abnormal, etc., to achieve the effect of readily determined and used, and conveying the underlying information

Inactive Publication Date: 2005-09-22
GLT ACQUISITION
View PDF6 Cites 160 Cited by
  • Summary
  • Abstract
  • Description
  • Claims
  • Application Information

AI Technical Summary

Benefits of technology

[0055] The invention involves the extraction and / or presentation of glucose concentrations collected as a function of time into a format that more readily conveys the underlying information. The reduction of data into information allows diagnosis and treatment information to be more readily determined and used. The information presentation is useful for both the medical professional and the end user. The information presentation is preferably used with a noninvasive, implantable, semi-continuous, and / or continuous analyte analyzer, such as a glucose concentration analyzer.

Problems solved by technology

Diabetes is a chronic disease that results in abnormal production and use of insulin, a hormone that facilitates glucose uptake into cells.
Diabetes is a leading cause of death and disability worldwide.
However, current monitoring techniques discourage regular use due to the inconvenient and painful nature of drawing blood or interstitial fluid through the skin prior to analysis, The Diabetes Control and Complication Trial Research Group, supra.
Unfortunately, recent reports indicate that even periodic measurement of glucose by individuals with diabetes e.g. seven times per day is insufficient to detect important glucose fluctuations and properly manage the disease.
In addition, nocturnal monitoring of glucose concentrations is of significant value but is difficult to perform due to the state of existing technology.
Widely separated in time discrete glucose concentration determinations are less appropriate than a history of well timed glucose concentration determinations.
A major problem with widely separated or discrete glucose determinations is that the glucose concentration in the body may change rapidly, especially in diabetics or in pre-diabetics.
These glucose concentration analyzers are invasive or minimally invasive in nature.
Consequently, the limitations of the device include the potential for significant skin irritation, collection of a biohazard, and a limit of three readings per hour.
Inherent in these approaches are health risks due to the sensor implantation, infections, patient inconvenience, and measurement delay.
Notably, none of these technologies are noninvasive.
Further, none of these technologies offer continuous glucose concentration determination.
Finally, none of these technologies use data reduction to represent the glucose concentrations as presented herein.
A disadvantage of this system is that it does not efficiently collect diffusely reflected light and the alignment is problematic.
Some users act upon each discrete glucose concentration without the benefit of seeing long or medium term data.
A problem with this typical presentation of data in Table format is that underlying information is not readily apparent.
Deciding a treatment based upon the data as presented in Table 1 is difficult.
This problem becomes considerably more complex as the number of glucose concentrations determined in a day increases and / or as the total number of days recorded increases.
Many devices, such as a fingerstick meter, do not commonly distinguish between users.
Even a more advanced device that keeps track of user identification or of a tracking number may have difficulties in presenting the underlying information in the data.
Currently, methods of reducing large amounts of glucose data into more manageable information are not used in conjunction with noninvasive glucose meters, semi-continuous, or continuous glucose analyzers.
While a number of instruments and data processing approaches exist as described, supra, none of these reports describe methods of reducing the voluminous data into information that is readily absorbed by a professional or lay user in a short period of time.

Method used


Image

  • Method and apparatus for presentation of noninvasive glucose concentration information
  • Method and apparatus for presentation of noninvasive glucose concentration information
  • Method and apparatus for presentation of noninvasive glucose concentration information

Examples


example i

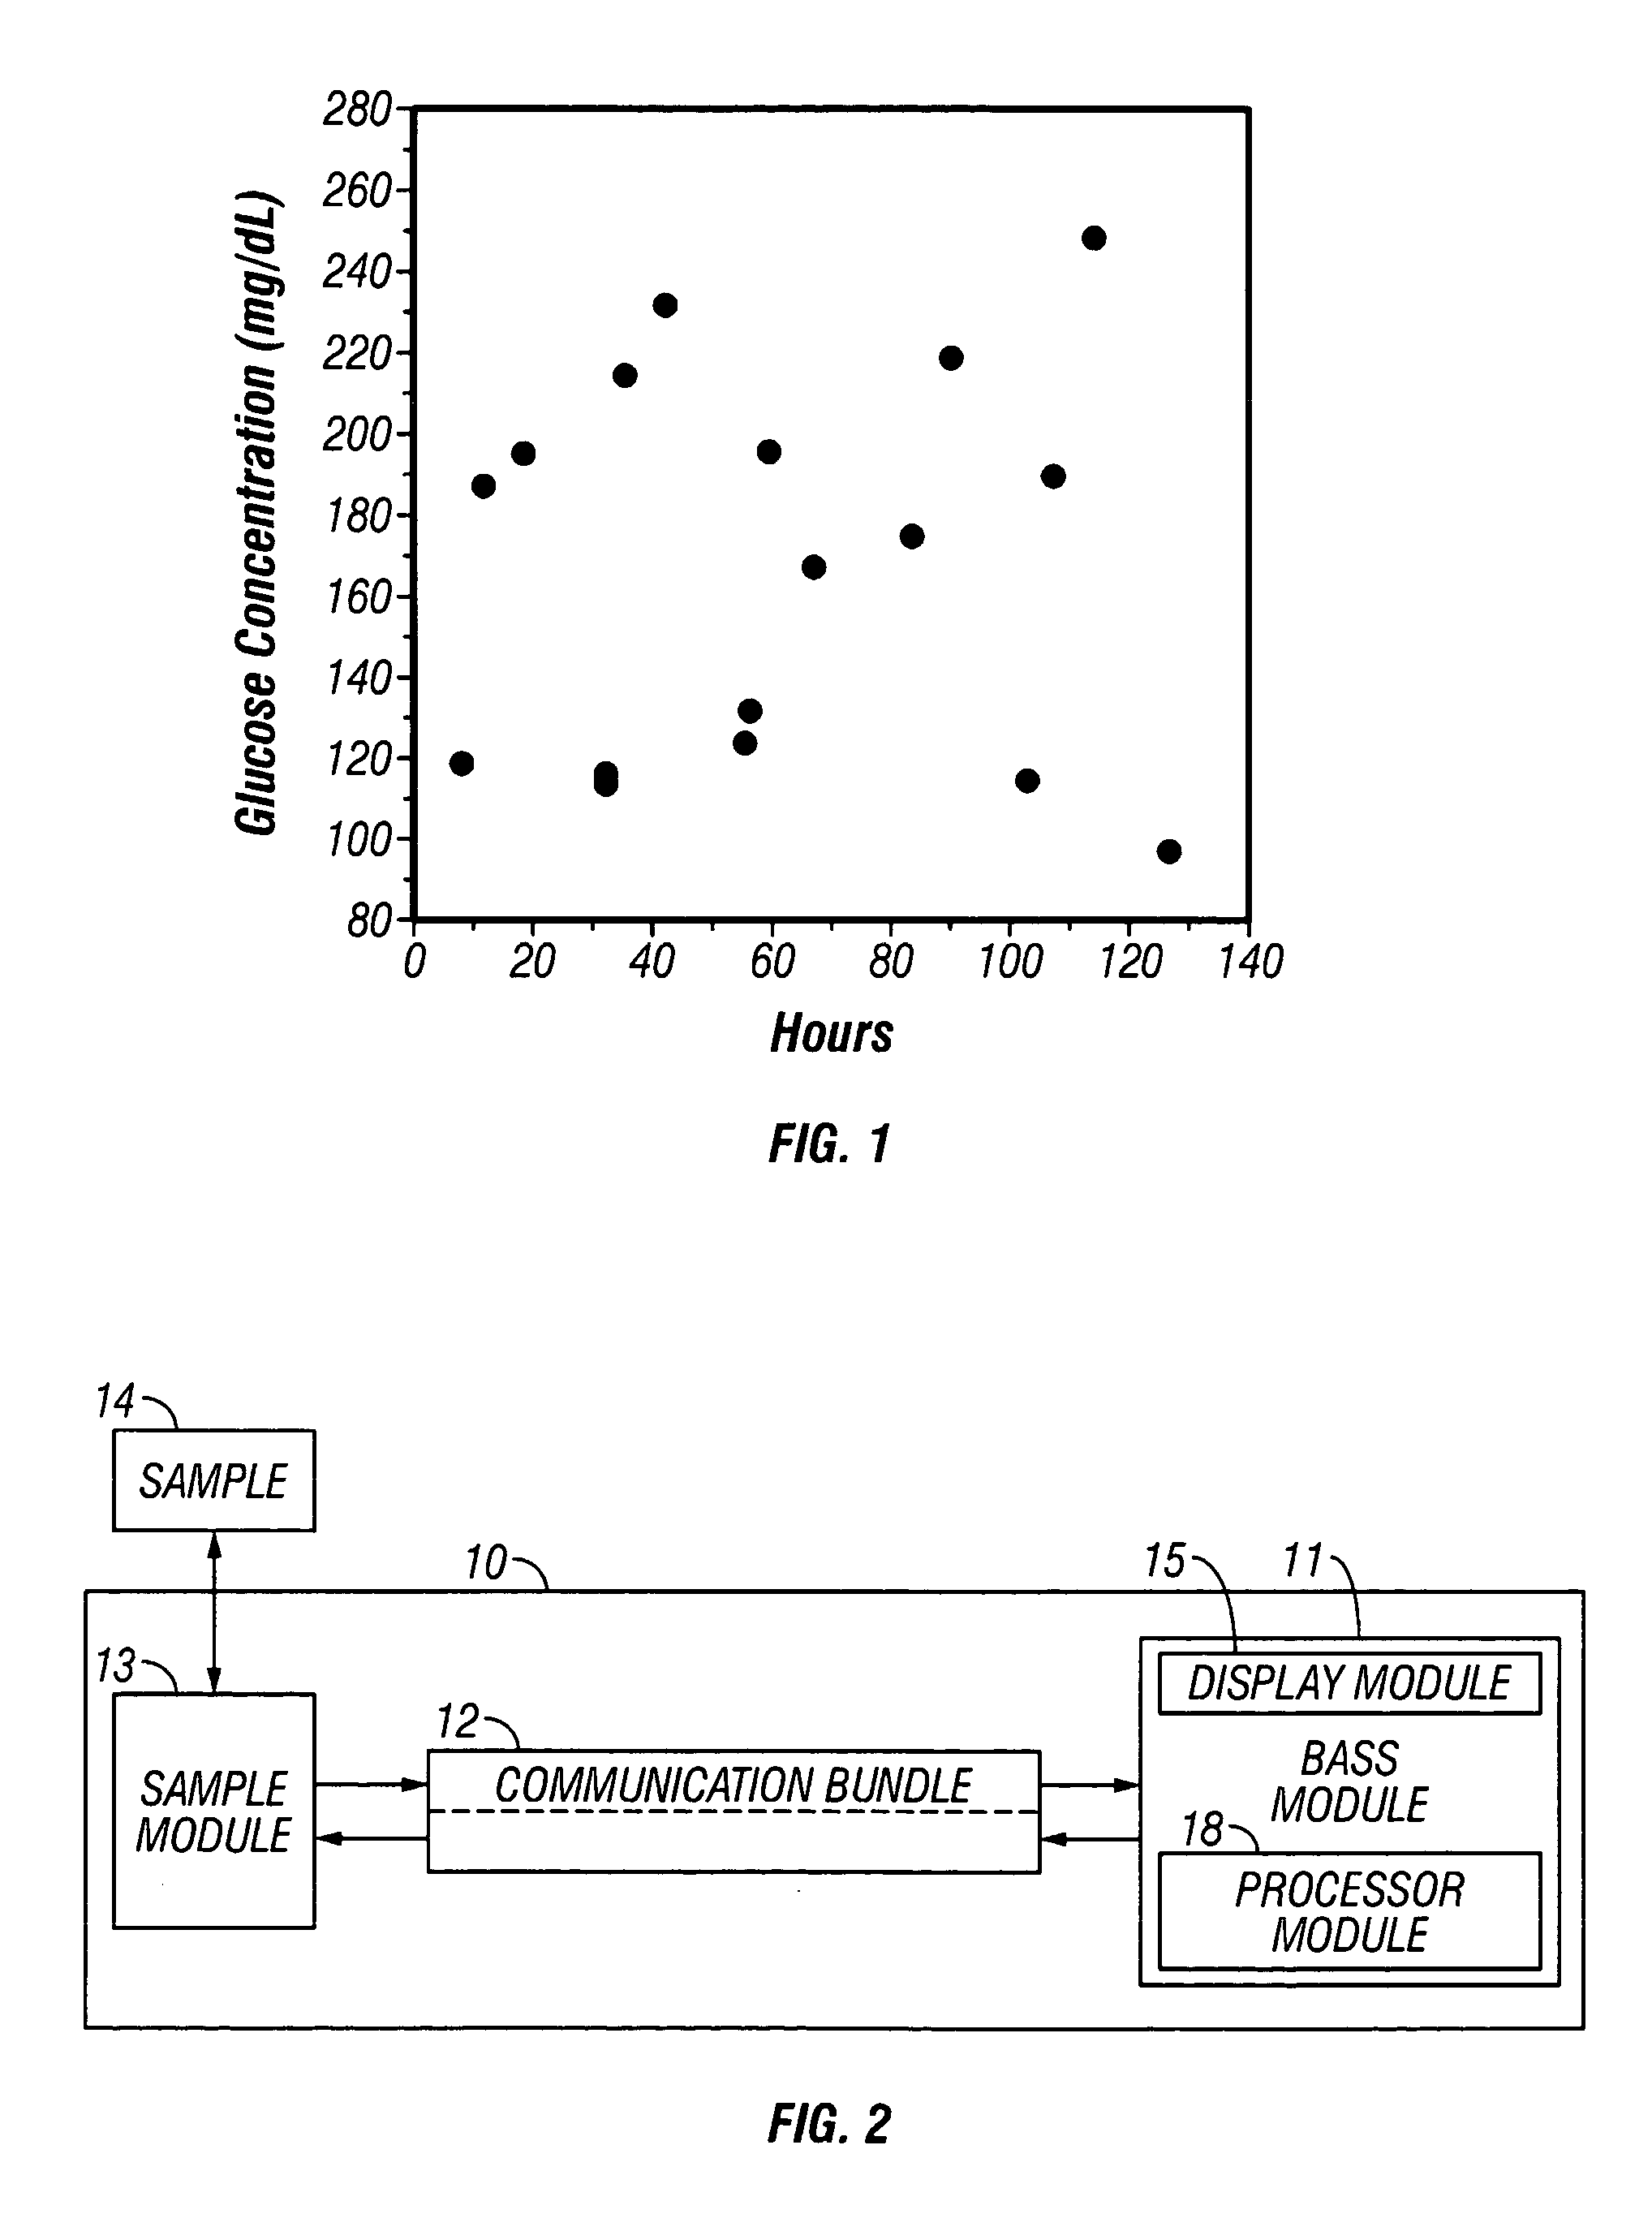
[0085] In a first example, an analyzer 10 contained in a single unit, the base module 11, communication bundle 12, and sample module 13 are all integrated together and are contained within or integrated onto a single containing unit.

example ii

[0086] In a second example, a base module 11 is separated from the sample module 13. Communication exists between the sample module 13 and base module 11 via a communication bundle 12. In varying embodiments, the communication bundle is wireless, carries electrical power, carries data, transmits energy or movement, and / or carries fluid. For example the communication bundle 12 carries feedback control signals, temperature sensing data, coupling fluid, light, data, and / or contains hydraulic fluid.

example iii

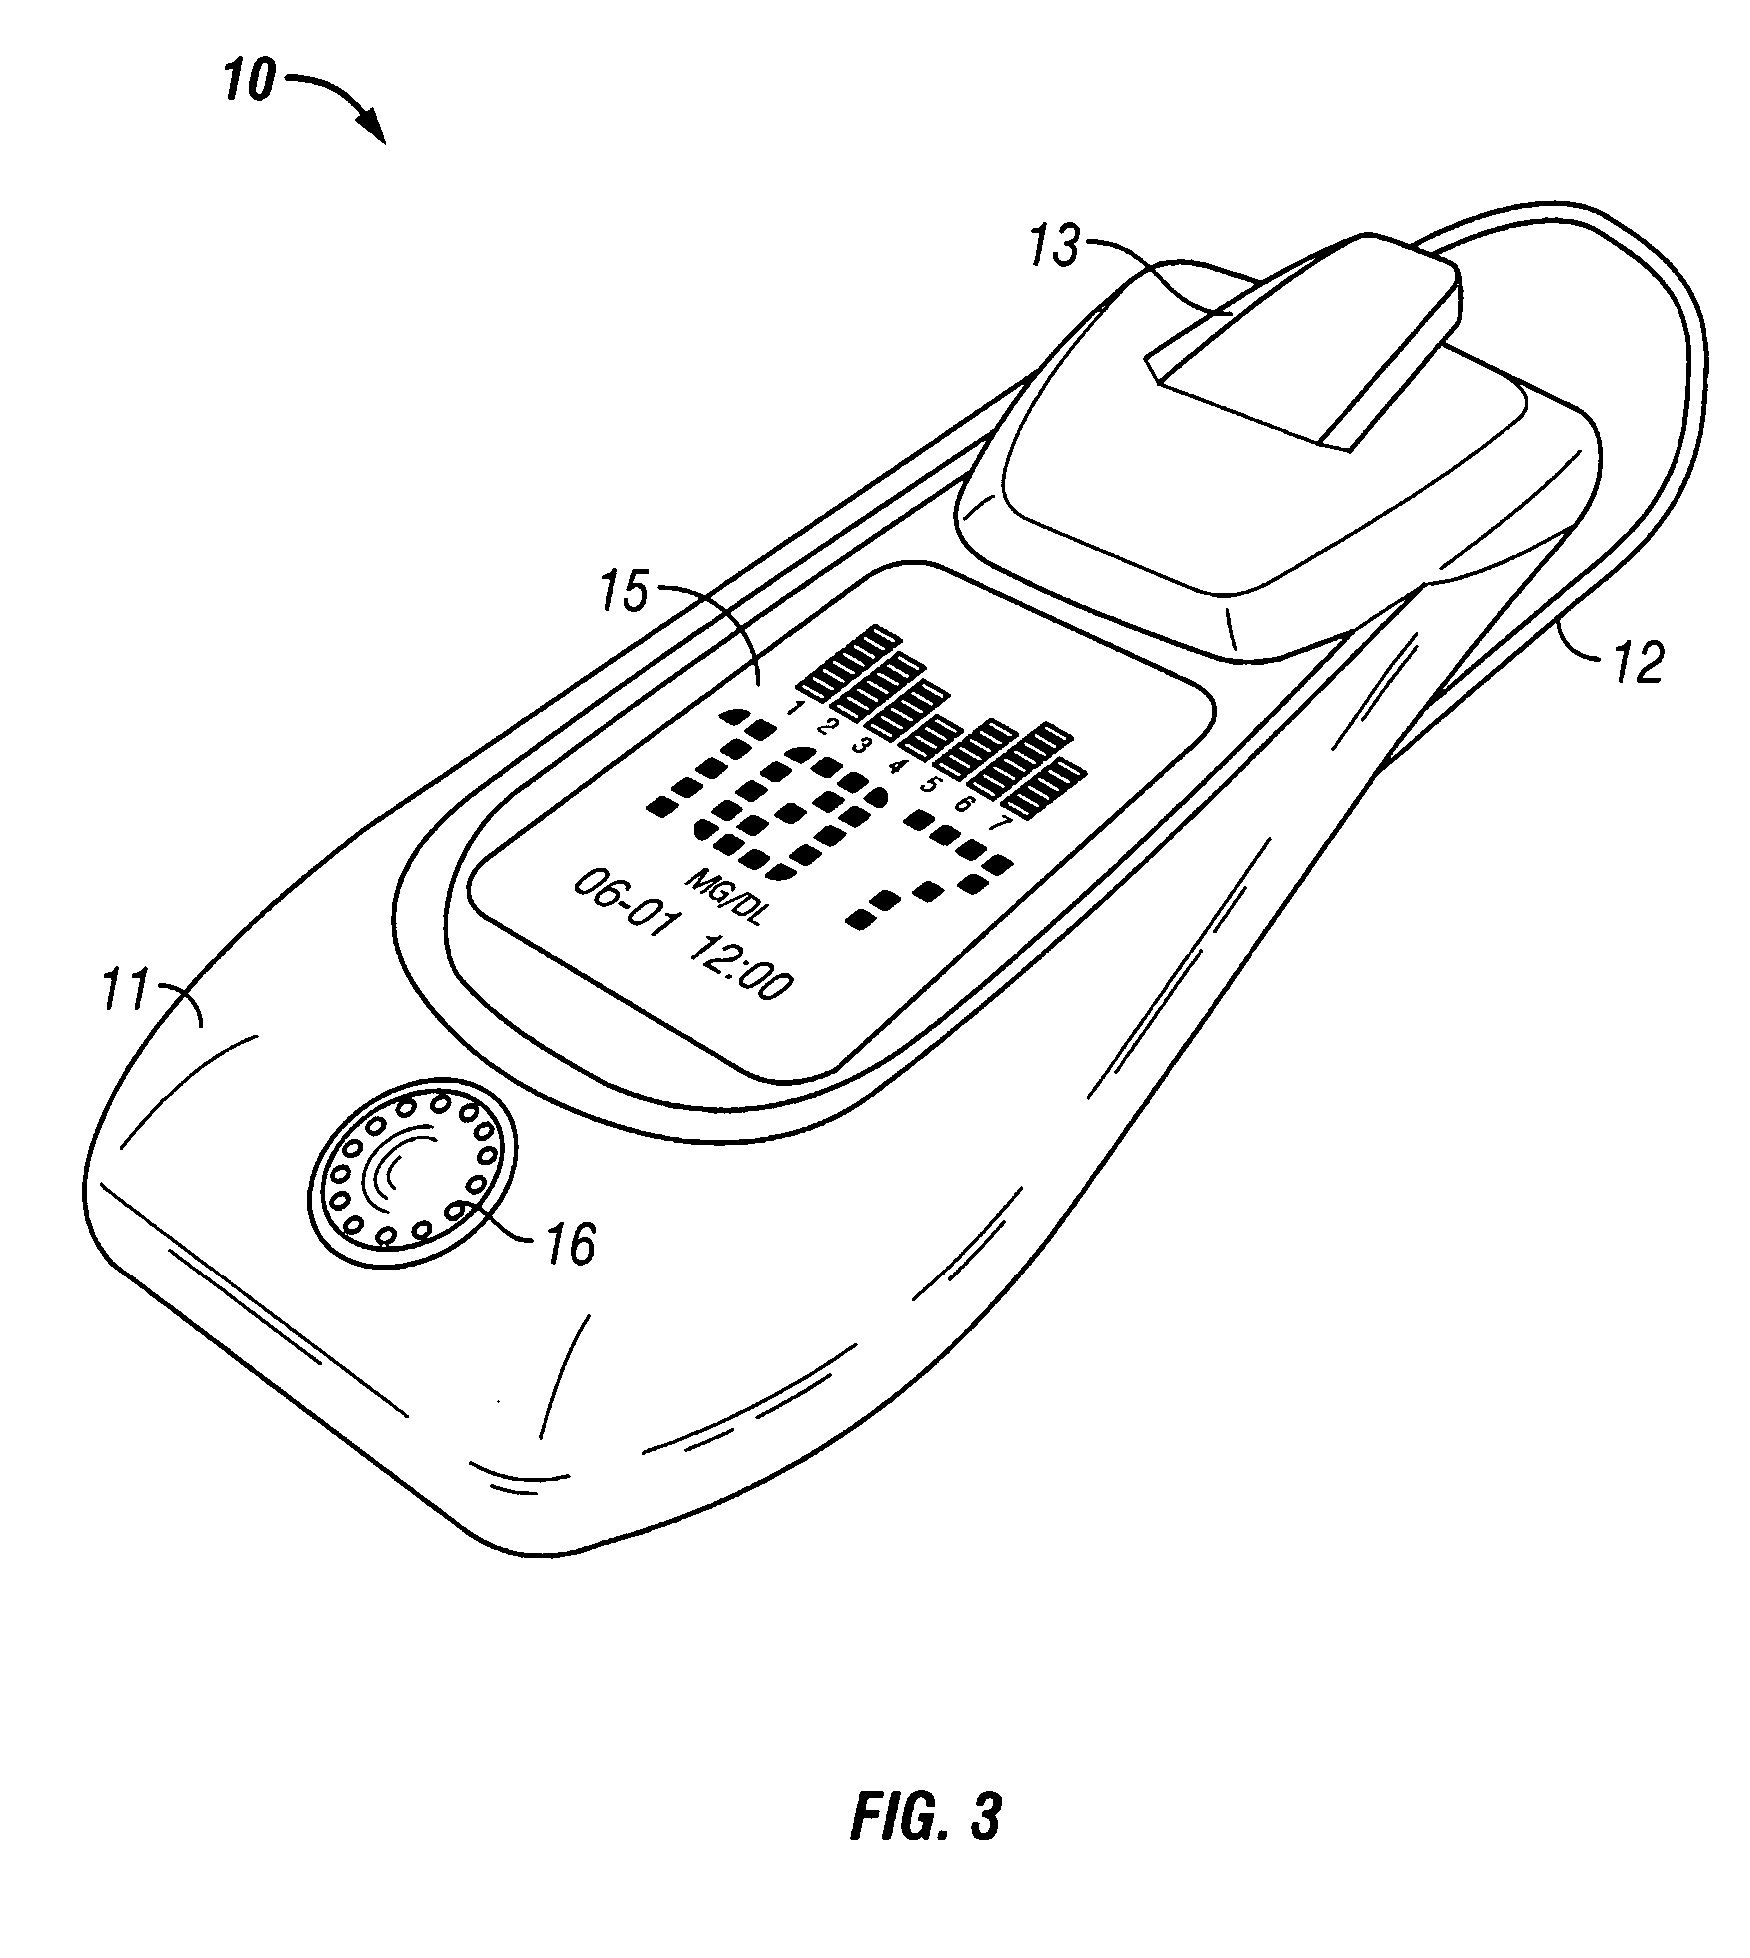
[0087] Referring now to FIG. 3, an example of a handheld analyzer 10 is presented. In this case the base module 11 is separated from the sample module 13 by a communication bundle 12. The sample module 13 docks into the base module when not in use or, optionally, for scanning an internal reference material 14. A graphical display module 15 is integrated into the base module 11. In the example presented, an optional audio output 16 speaker is presented.


PUM

PropertyMeasurementUnit
concentrationsaaaaaaaaaa
concentrationaaaaaaaaaa

Abstract

The invention relates generally to the extraction and / or presentation of glucose concentrations estimated as a function of time into a format that facilitates conveyance of the underlying information. More particularly, glucose concentration histories are presented in terms of risk of behavior, in a video format, and / or in an audio format. The reduction of data into video format, selected by time period, cluster, or glucose concentration response, into an animated or video presentation allows diagnosis and treatment information to be more readily determined and used. Alternatively, glucose concentrations are output through a voice synthesizer or an earcon. These information presentations are useful for both the medical professional and the end user. The information presentation is preferably used with a noninvasive, implantable, semi-continuous, and / or continuous analyte analyzer, such as a glucose concentration analyzer.

Description

CROSS REFERENCE TO RELATED APPLICATION [0001] This application claims priority from U.S. provisional patent application Ser. No. 60 / 534,829, filed Jan. 6, 2004, and from U.S. patent application Ser. No. 10 / 472,856, filed Mar. 7, 2003 and PCT application no. PCT / US03 / 07065, filed Mar. 7, 2003, which claim benefit of U.S. provisional patent application Ser. No. 60 / 362,885, filed Mar. 8, 2002, each of which is herein incorporated in its entirety by this reference thereto.BACKGROUND OF THE INVENTION [0002] 1. Technical Field [0003] The invention relates generally to the extraction and / or presentation of glucose concentrations estimated as a function of time into a format that facilitates conveyance of the underlying information. More particularly, glucose concentration histories are presented in terms of risk of behavior, in a video format, and / or in an audio format. [0004] 2. Description of the Prior Arts Diabetes [0005] Diabetes is a chronic disease that results in abnormal productio...

Claims


Application Information

Patent Timeline
Patent Type & Authority Applications(United States)
IPC IPC(8): A61B5/00G01N33/48G01N33/50G06F19/00
CPCA61B5/14532A61B5/1455A61B5/7475A61B5/749G06F19/3487A61B5/7415A61B5/743A61B2560/0456G16H15/00A61B5/746
Inventor HOCKERSMITH, LINDA J.HAZEN, KEVIN H.RUCHTI, TIMOTHY L.
Owner GLT ACQUISITION
Why Eureka
Try Eureka