Al technical title is built by PatSnap Al team. It summarizes the technical point description of the patent document.
a technology of optical phase and distribution, applied in the direction of optical apparatus testing, optical radiation measurement, instruments, etc., can solve the problems of special measuring devices, high cost, and hardware such as interferometers and shack-hartman sensors, and achieve easy and economical measurement, high speed, and high accuracy.
Inactive Publication Date: 2006-08-24
TOKYO INST OF TECH
View PDF0 Cites 2 Cited by
Summary
Abstract
Description
Claims
Application Information
AI Technical Summary
This helps you quickly interpret patents by identifying the three key elements:
Problems solved by technology
Method used
Benefits of technology
[0029] According to the optical-phase-distribution measuring method of the present invention, there is an excellent advantage that optical-phase distribution can be easily and economically measured, because the phase distribution of light to be measured can be identified at high speed and with high accuracy, based on information (intensity-distribution image) on light-intensity distribution, without using an expensive optical instrument such as a special measuring device which has been used in a conventional optical-phase-distribution measuring method, wherein the light-intensity distribution is obtained by using an optical-phase-distribution measuring system comprising two different optical systems and a light-wave detecting sensor.
Problems solved by technology
However, there have been a problem that the special measuring device (that is, hardware such as an interferometer, and a Shack-Hartman sensor), which has been used in the above-described conventional optical-phase-distribution measuring method, is very expensive, because the special measuring device includes a precise optical instrument, and space for installing the above special measuring device is required.
There has also been a problem that efforts for measuring adjustments and measuring errors are increased when the scale of the phase distribution for light to be measured is in the level of a wavelength.
Method used
Image
Click on the blue label to locate the original text in one second.
Reading with bidirectional positioning of images and text.
Examples
Embodiment Construction
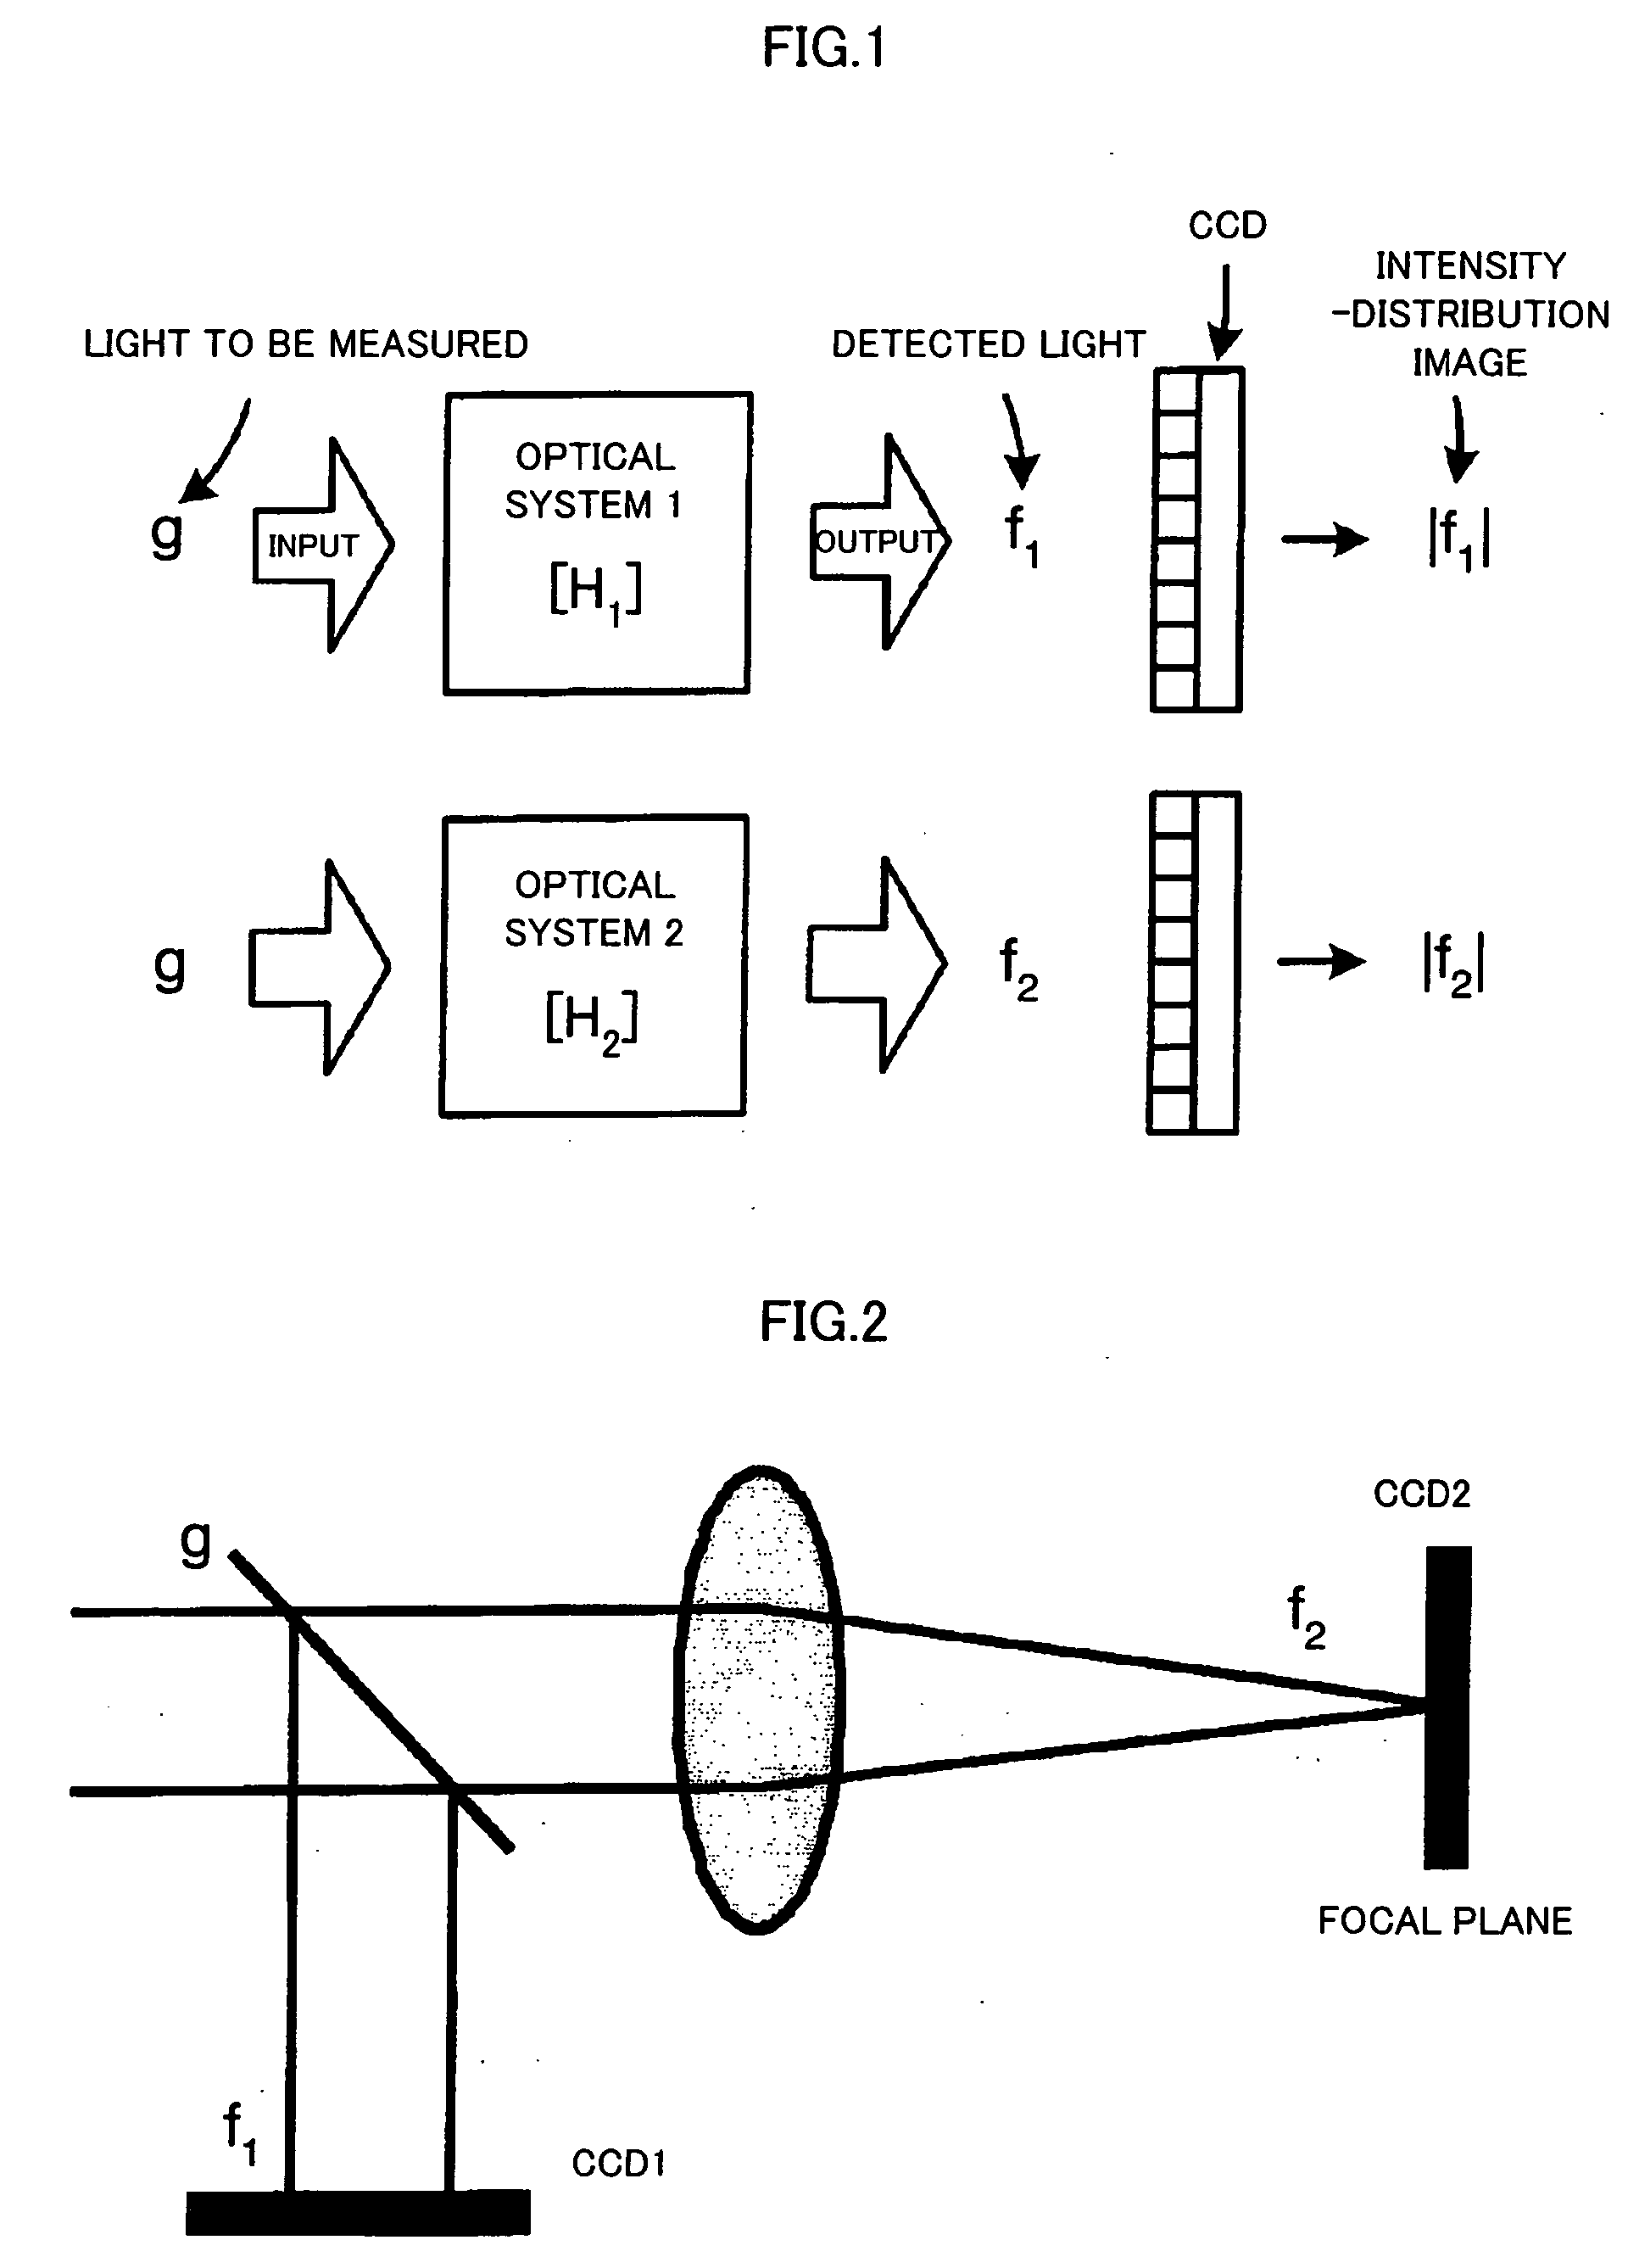
[0037] Hereinafter, the best mode for carrying out the invention will be explained, referring to drawings.
Mathematical Expression of Light Wave and an Optical-Phase-Distribution Measuring System
[0038] First, the mathematical expression of a light wave used in the present invention will be explained.
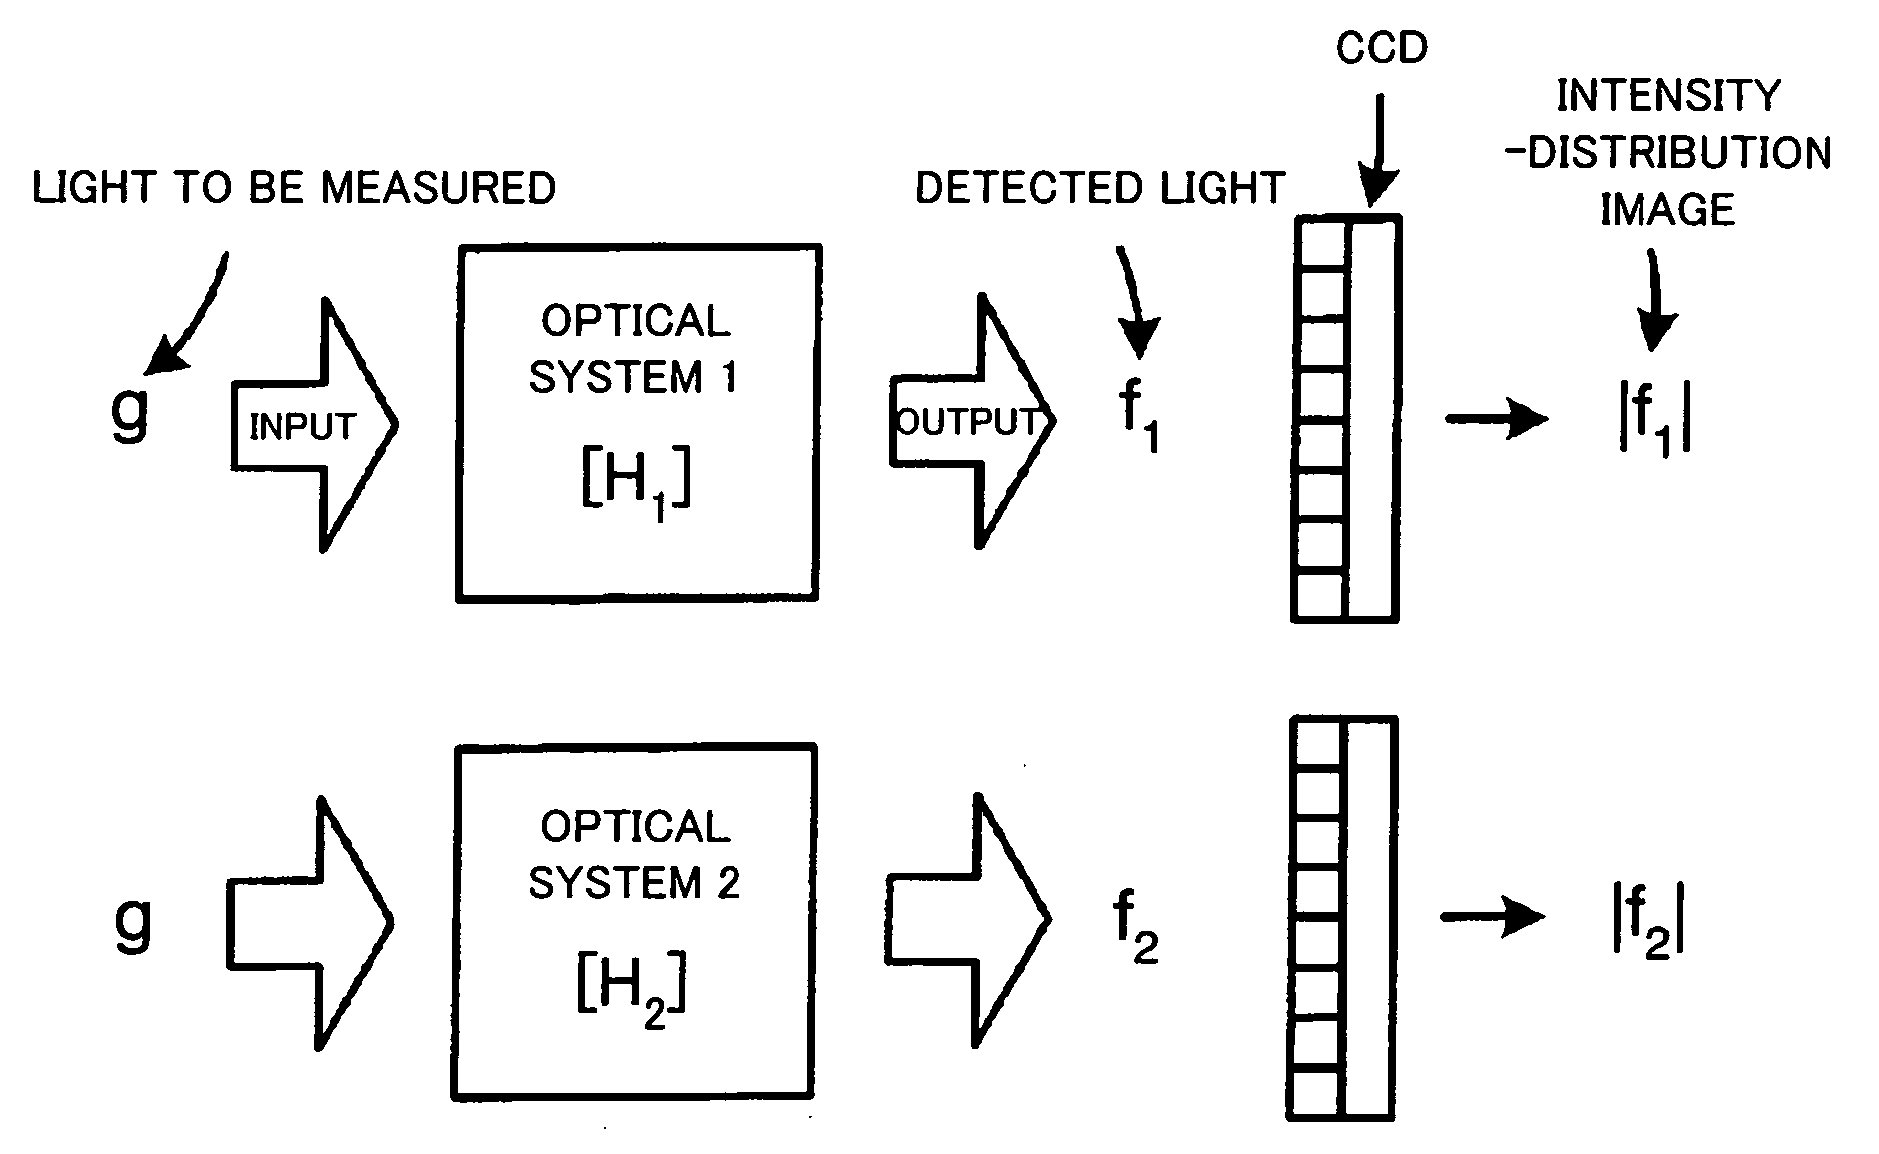
[0039] It is assumed in the present invention that light which is an object for measuring phase-distribution (that is, light to be measured) is, a monochromatic light with a single wavelength component, and a time coherent light in which there is a fixed correlation between phases at any different time such as a laser beam.
[0040] In the present invention, the time vibrational term of a light wave u is separated for calculation in optics, and, complex amplitude v, the intensity a of a light wave and a phase θ of a light wave are expressed by the following Expression 1 (refer to the non-patent document 6).
u=aexp[i(θ−ωt)]=vexp(−iωt) [Expression 1]
[0041] where i represents an imaginary...
PUM
Property
Measurement
Unit
optical-
aaaaa
aaaaa
phase distribution
aaaaa
aaaaa
optical
aaaaa
aaaaa
Abstract
A provided optical-phase-distribution measuring method, by which optical phase distribution is identified at high speed and with high accuracy from information on light-intensity distribution without using a special measuring device, comprises steps: for inputting light to be measured to optical systems, respectively, modulating the intensity and the phase, detecting the output light to be measured with CCD, and measuring the intensity distribution of detected light to be measured as an image with an optical-phase-distribution measuring system provided with the two different optical systems; for setting an observation equation, based on the intensity distribution and on the optical characteristics of the optical systems; for setting a phase-distribution identification inverse-problem from the observation equation, and formulating the set phase-distribution identification inverse-problem as a first nonlinear optimization problem in which complex amplitude representing the light to be measured is assumed to be a design variable; for converting the first nonlinear optimization problem to a second nonlinear optimization problem, in which expansion coefficients in a series expansion are assumed to be design variables, by series expansion of the phase distribution of the light to be measured; and for identifying the phase distribution of the light to be measured by solving the second nonlinear optimization problem.
Description
REFERENCES CITED [0001] [Non-Patent Document 1]: K. A. Nugent, D. paganin, and T. E. Gureyev, “A Phase Odyssey”, Physics Today, Vol. 54, No. 8, pp27-32, 2001; [0002] [Non-Patent Document 2]: MIYOSHI Takashi, “HIKARI-OYO NANO IN-PUROSESU KEISOKU-GIJUTSU NO SAISIN-DOKO (The Latest Trend in Nano In-Process Measurement Technology by Optical-Application”, KIKAI NO KENKYU (Science of Machine), Vol. 54, No. 9, pp928-933, 2002; [0003] [Non-Patent Document 3]: “Opto-Electronic Measuring Instrument Guide”, OPTOELECTRONICS Co., LTd., 1998; [0004] [Non-Patent Document 4]: W. H. Southwell, “Wavefront Estimation from Wavefront Slope Measurements”, J. Opt. Soc. Am., Vol. 70, No. 8, pp998-1005, 1980; [0005] [Non-Patent Document 5]: P. Schiske, “Uniqueness and Ambiguity in Phase Determination From Image and Diffraction Pattern Intensities”, Optik, Vol. 40, No. 3, pp261-275, 1974; [0006] [Non-Patent Document 6]: YOSHIMURA Takeaki, “HIKARI JOHOKOGAKU NO KISO (Fundamentals of Optical Information Engine...
Claims
Application Information
Patent Timeline
Application Date:The date an application was filed.
Publication Date:The date a patent or application was officially published.
First Publication Date:The earliest publication date of a patent with the same application number.
Issue Date:Publication date of the patent grant document.
PCT Entry Date:The Entry date of PCT National Phase.
Estimated Expiry Date:The statutory expiry date of a patent right according to the Patent Law, and it is the longest term of protection that the patent right can achieve without the termination of the patent right due to other reasons(Term extension factor has been taken into account ).
Invalid Date:Actual expiry date is based on effective date or publication date of legal transaction data of invalid patent.
Patent Type & Authority Applications(United States)