Electrochemical preferential oxidation of carbon monoxide from reformate
Inactive Publication Date: 2006-09-21
WORCESTER POLYTECHNIC INSTITUTE
4 Cites 6 Cited by
AI-Extracted Technical Summary
Problems solved by technology
Despite the potential of PEM fuel cells to serve as power systems for a new generation of “green” vehicles, as well as off-road power plants operating with increased efficiency and reduced emissions, the use of hydrogen as the fuel source limits their immediate application as a power source.
Since H2 storage on site or on board vehicles is as yet impractical, conventional fuels, e.g., natural gas, gasoline or alcohols, are reformed catalytically into reformate that contains H2 at the point of usage.
However, the reformate typically contains substantial amounts of CO in addition to CO2 and H2.
However, the exit gas from the low temperature shift (LTS) reactor following the high temperature shift (HTS) stage still contains roughly 5,000-10,000 ppm (0.5-1%) of CO, which cannot be tolerated by PEM fuel cells.
The preferential oxidation (PrOx) reactor oxidizes CO to CO2 typically over a meta...
Method used
[0050] The binder preferably is a polymer that can ensure the mechanical strength of the electrode, and have high gas permeability. Examples of the polymer include copolymers of fluoropolymers and sulfonated polyarylene sulfones, sulfonated polyether ether ketones and polyimides; poly(tetrafluoroethylene) (e.g. Teflon®, E. I. du Pont de Nemours and Co.); and a perfluorinated ionomer, such as a perfluorinated ionomer, reinforced with poly(tetrafluoroethylen...
Benefits of technology
[0018] The present invention in the ECPrOx system has several advantages over conventional PrOx systems. As discussed above, PrOx systems typically are bulky and cumbersome, involving two or more stages with inter-cooling and distributed air or water injection. PrOx systems also require a relatively long reactor warm-up period and large transient CO concentration during reactor start up. Careful oxygen or air injection control is necessary in the PrOx system to prevent over-consumption of hydrogen.
[0019] In contrast, the ECPrOx system is compact, not requiring inter-cooling, water injection or careful oxygen or air control. Also, because the ECPrOx system can be performed at relatively low temperatures, such as near room temperature, it is c...
Abstract
An electrochemical device comprises an electrochemical reactor that includes a single or multiple electrochemical cells and a galvanostat, a gas source and a fuel cell system. Each of the electrochemical cells includes an anode compartment and a cathode compartment. The gas source is in fluid communication with the anode or cathode compai ment of each of the electrochemical cells, including at least two components that are selectively reactive relative to each other. The selectivity of the two components of the gas source is dependent upon an electrical potential between an anode of the anode compartment and a cathode of the cathode compartment, whereby a constant current between the anode and cathode causes the electrical potential to oscillate autonomously while the gas components are directed through the anode or cathode compartment. The oscillation in potential causes autonomous oscillation of selective reaction of the gas components.
Application Domain
Hydrogen separationFuel cells grouping +9
Technology Topic
Electrochemical responseElectrochemical cell +7
Image
Examples
- Experimental program(1)
Example
Example 1
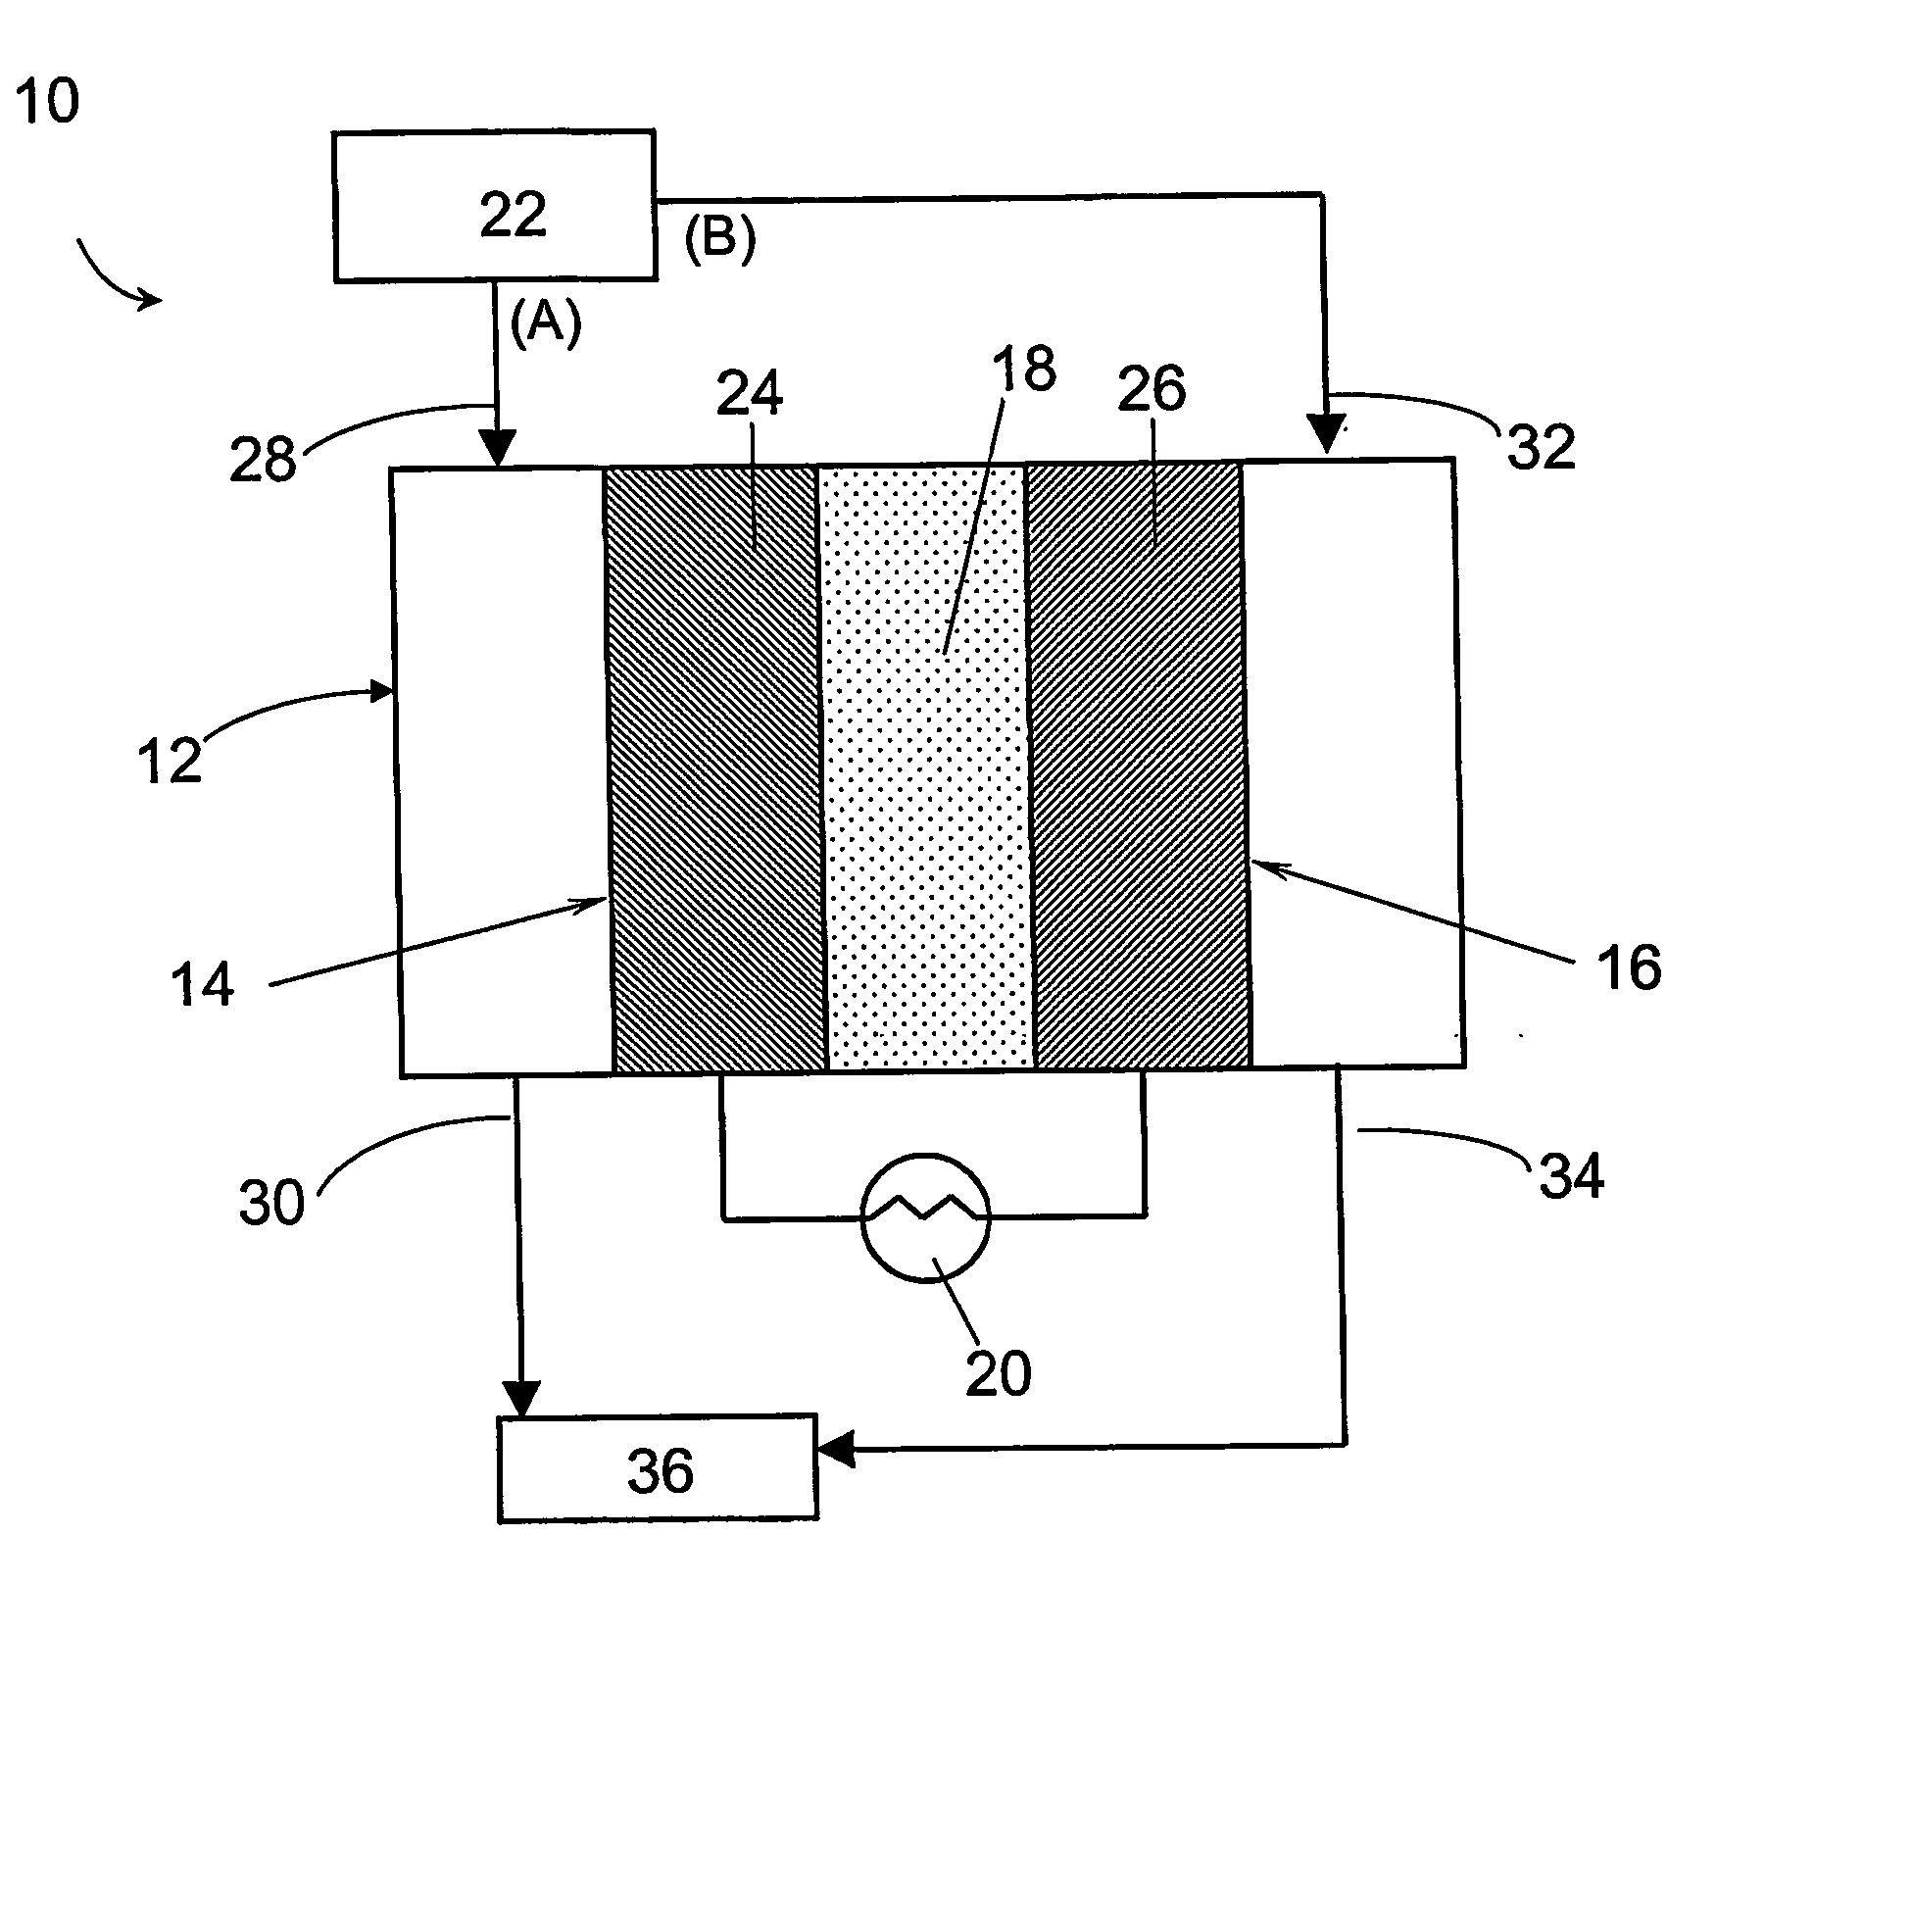
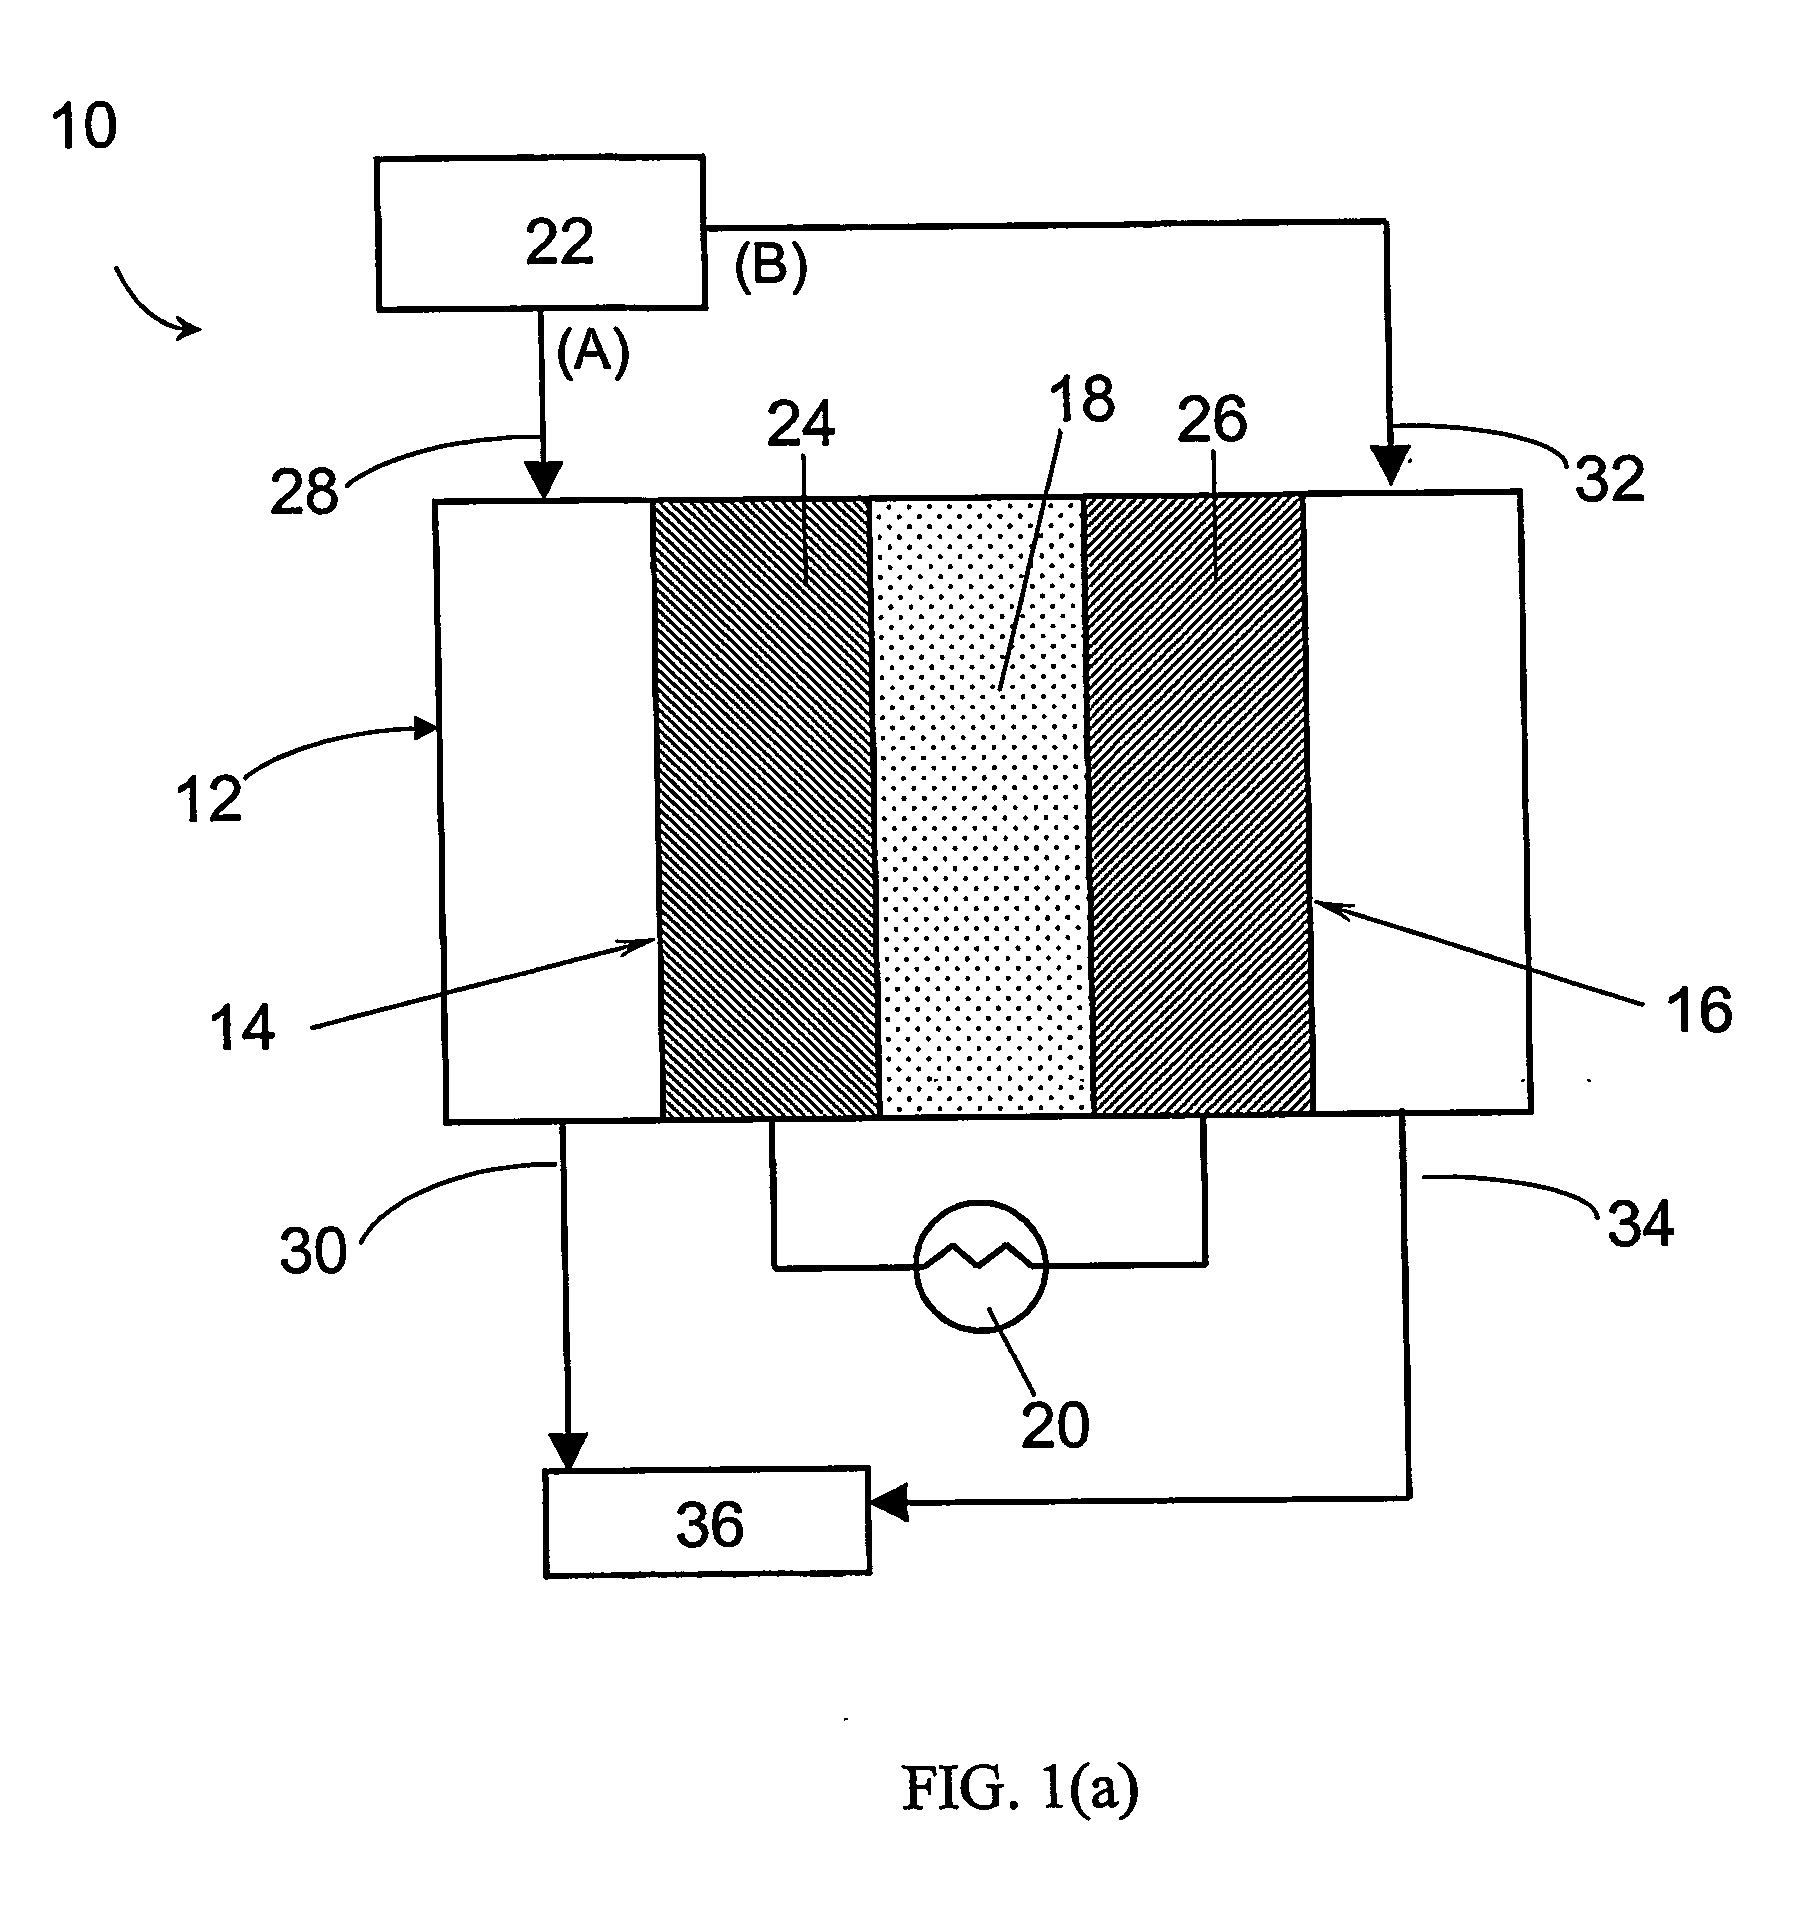
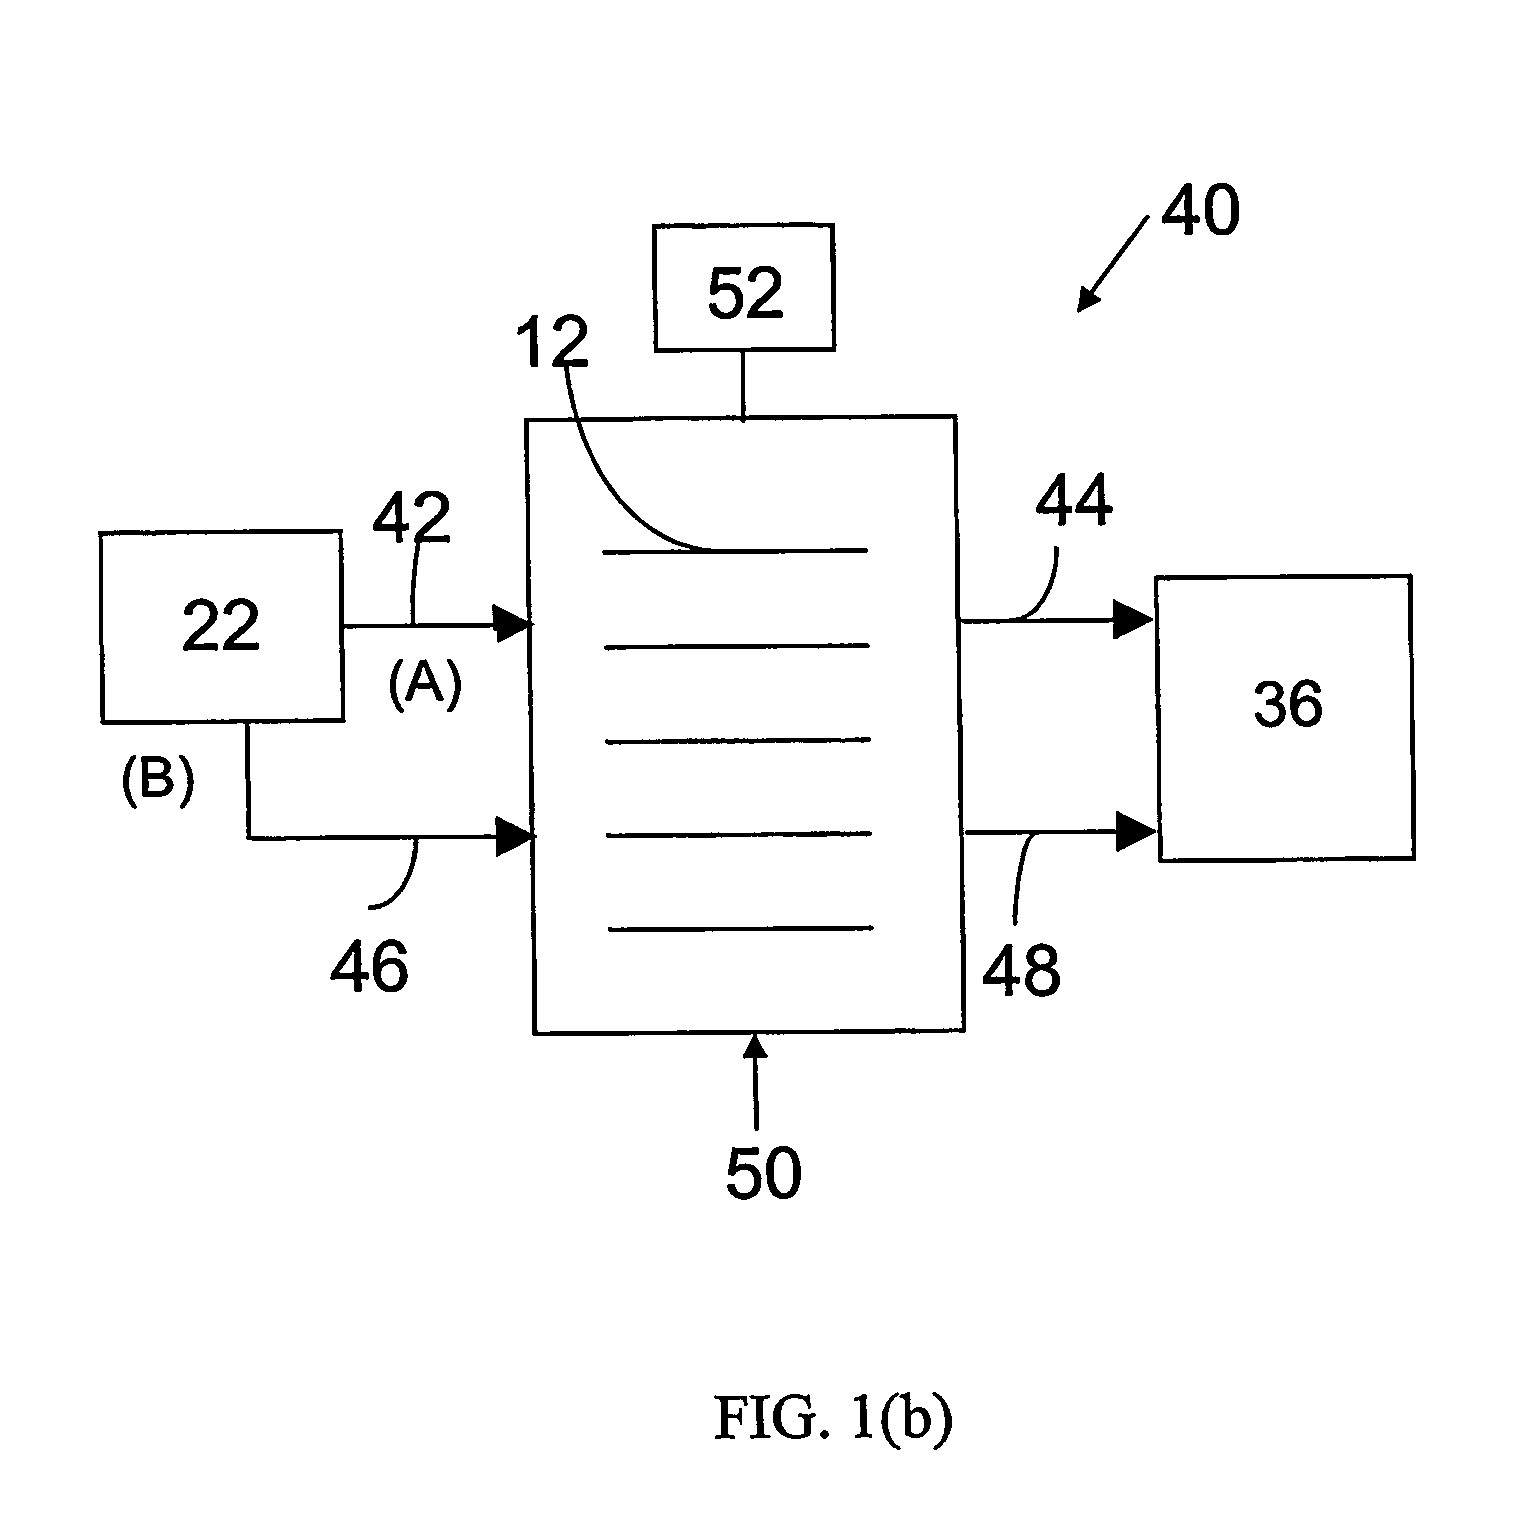
Construction of the Electrochemical Preferential Oxidation (ECPrOx) System
[0069] A gas diffusion electrode loaded with 20% (w/o) Pt/C at a metal loading of 0.4 mg/cm2 acquired from E-TEK was used as cathode. A gas diffusion electrode loaded with 20% (w/o) PtRu/C with 0.35 mg/cm2 metal loading, or 40% (w/o) PtRu/C with 0.7 mg/cm2 metal loading were used as the anode. The electrodes were hot-pressed onto a Nafion® 117 proton-exchange membrane to form a membrane-electrode assembly (MEA) at 130° C. and under a load of 4000 lbs of force for about 2 minutes.
[0070] The MEA was then incorporated into a 5 cm2 single cell from ElectroChem, Inc. (Woburn, Mass.), and tested in a test station with temperature, pressure, humidity and flow rate control. The graphite bipolar plate had serpentine flow channels. The ECPrOx unit was operated at room temperature unless otherwise noted. The room temperature recorded in the laboratory varied between 25 and 30° C. The anode and cathode gases were humidified in stainless steel bottles containing water at room temperature before introduction into the unit. The total pressure of both anode and cathode sides was maintained at 30 psig except in the experiments on the effect of pressure. The volumetric flow rates were all at the standard state (1 atm and 25° C.) in units of standard cubic centimeters per min (sccm).
[0071] The current-voltage characteristics were recorded using a HP 6060B DC electronic load, interfaced with a PC using LabVIEW software (National Instruments, Austin, Tex.), with a data sampling rate of 0.226 s. The anode exit gas stream was monitored by a Model 200 IR CO/CO2 gas analyzer (California Analytical Instruments, Orange, Calif.). The FP-AI-100 analog input module/FP-1000 network module (National Instruments, Austin, Tex.) was used to collect data from the gas analyzer using LabVIEW. Simulated reformate (from premixed gas cylinder) was introduced to the anode at a flow rate controlled by a mass flow controller. A variety of feeds were tested: H2/100 ppm CO, H2/200 ppm CO (MG Industries, Morrisville, Pa.); H2/1000 ppm CO (Spec Air, Auburn, Me.); and H2/24.1% CO2/9380 ppm CO (AGA Gas, Maumee, Ohio). These premixed gases were used as an anode feed, while oxygen was fed to the cathode.
Concept of ECPrOx System
[0072] The ECPrOx system of the invention was based on a potential oscillation that adjusted automatically at a constant current density according to the CO concentration in the feed stream. The voltage pattern when the anode feed was switched from H2/200 ppm CO to H2/1000 ppm CO is shown in FIG. 3. With the introduction of higher concentration of CO in the anode feed, the oscillation period decreased, i.e., the oscillation became faster. Such potential oscillations indicated that a significant amount of CO entering the anode was electrooxidized on the catalyst surface. A typical result of the anode outlet CO concentration with the step change in anode inlet flow rate is shown in FIG. 4. The anode feed was H2 containing 200 ppm of CO. The cell was operated at room temperature and a current density of 200 mA/cm2. The exit CO concentration was very stable over time for different inlet flow rates. The CO concentration could be brought down to about 13 ppm at an inlet feed rate of 71.6 sccm, and below 2 ppm at 36.4 sccm for a feed containing 200 ppm CO. It is thus evident that the CO concentration in hydrogen can be reduced without resorting to an external power supply.
[0073] The ECPrOx unit had the same function of the conventional PrOx reactor. A current control device was used to control the hydrogen consumption rate and the CO conversion. A CO sensor can be put in series with the ECPrOx exit stream to monitor the CO concentration, and possibly for control. The supplemental power produced by the ECPrOx unit can be stored in a rechargeable battery or integrated directly to the fuel cell power plant. The ECPrOx unit can be built in the same modular structure as PEM fuel cells. In cases such as methanol steam reformation where the exit CO concentration from the reformer is low, then it can replace the shift reactor with the ECPrOx unit.
Performance of ECPrOx at Different Feed CO Concentrations
[0074] The outlet CO concentration as a function of inlet flow rate is plotted in FIG. 5(a) at various current densities for an anode feed containing 1000 ppm CO. As shown in FIG. 5(a), the outlet CO concentration increased with the inlet flow rates at a given current density. The outlet CO concentration decreased with increase of the current density at a given inlet flow rate. However, the decrease of the outlet CO concentration at a given inlet flow rate became small as the current density increased.
[0075] Since two-stage ECPrOx may be required, experiments were conducted using feed CO concentrations ranging from 100 to 10,000 ppm. Thus a feed gas of H2/24.1% CO2/0.938% CO was used to simulate the reformate gas stream from the LTS reactor. The exit CO concentration for this feed as a function of inlet flow rate is plotted in FIG. 5(b), for an anode catalyst loading of 0.7 mg/cm2 PtRu. As can be seen in FIG. 5(b), the CO concentration was lowered from 9380 ppm to about 140 ppm for an inlet flow rate of 21.9 sccm, and about 500 ppm at a flow rate of 55.6 sccm and a current density of 150 mA/cm2. The trends observed were different from that for lower CO concentrations as in FIG. 5(a). This difference was due to transition of cell voltage between stationary and oscillatory states. The current density and flow rates were two parameters that affected the onset of potential oscillations. The oscillation born at relatively smaller flow rates was suppressed when the flow rates were increased. For example, at a current density of 100 mA/cm2, oscillation disappeared when the inlet flow rates exceeded 33.2 sccm, while at a current density of 150 mA/cm2, the oscillation disappeared when the inlet flows was greater than 55.6 sccm. Due to the transition from an oscillatory state to a stationary one, the monotonous change in exit CO concentration with flow rates was not observed for a current density of 100 mA/cm2, as shown in FIG. 5(b). The lower exit CO concentration at the stationary state was due to the fact that the cell voltage at stationary states was much lower than the time-averaged cell voltage at oscillatory states (i.e., the anode overpotential was higher at a stationary state than the time-averaged anode overpotential at oscillatory state). The higher anode overpotential lead to a higher CO electrooxidation rate. However, for the same state of cell operation (either oscillatory or stationary), the exit CO concentration always increased with the inlet flow rates.
[0076] Due to the high concentration of CO2 (24.1%) in the feed, there was a distinct possibility that the reverse water gas shift reaction proceeded at the anode catalyst. However, reverse water gas shift reaction is not favored at low temperatures, either kinetically and thermodynamically.
Supplemental Electrical Power
[0077] As has been mentioned in the previous section, no external electrical power source is needed for the ECPrOx. On the contrary, supplemental electrical power is generated. An enhanced power output was observed for higher CO concentration (e.g., 200 ppm and 1000 ppm CO) in the ECPrOx operation. A comparison of the supplemental power output under stationary and oscillatory states at the same experimental conditions is shown in FIGS. 6(a)-(b). As seen in FIG. 6(a), the maximum power density under steady state operation was about 47 mW/cm2 at a current density of around 200 mA/cm2. However, the power output under the oscillatory state was over 100 mW/cm2, and had not yet peaked. Even when the anode feed contained 1000 ppm CO (FIG. 6(b)), the power output under the oscillatory state did not fall appreciably even though the CO concentration in the feed increased 5 fold. Further, the power output at the oscillatory state did not change appreciably with inlet feed rates.
[0078] Thus, the ECPrOx process effectively removed CO from reformate gas to produce clean hydrogen on the one hand, while also generating supplemental electrical power, which (at oscillatory state) was even higher than that at a stationary state at otherwise identical conditions. Such a characteristic of ECPrOx would increase the overall energy efficiency of the reformer/fuel cell system.
Effect of Operating Temperature
[0079]FIG. 7 shows the exit CO concentration at two different temperatures. In this experiment, the anode feed was hydrogen containing 100 ppm CO. The exit CO concentration increased with the cell temperature, exceeding 30 ppm for an inlet flow rate of 71.6 sccm at 55° C. This indicates that low temperature operation is preferable for ECPrOx to remove CO from the hydrogen rich gas stream.
[0080] Similar results were obtained for the feed containing 9380 ppm CO. At a current density of 140 mA/cm2 and a flow rate of 44.4 sccm (catalyst loading 0.35 mg/cm2), the exit CO concentration was 638 ppm at 35° C., while the exit CO concentration was above 1000 ppm (over the detection range of the gas analyzer) when the unit is operated at 80° C.
[0081] The kinetic and mechanistic study by Schubert et al. (M. M. Schubert, M. J. Kahlich, H. A. Gasteiger, and R. J. Behm, J. Power Sources, 84, 175 (1999), the entire teachings of which are incorporated herein by reference) showed that the selectivity of conventional CO preferential oxidation is determined by the steady-state surface coverage. Thus, there is a loss in selectivity with decreasing surface coverage of CO as CO partial pressure decreases. Similarly for ECPrOx, the CO surface coverage decreases due to the reduced CO adsorption equilibrium constant at elevated temperatures. The adsorption of CO on noble metal catalyst surface is an exothermic process, the enthalpy change being about −115 kJ/mol on Ru, and around −130 kJ/mol on Pt. The heat of adsorption decreases with an increase of surface coverage of CO, but is still about −45 kJ/mol at near saturation coverage.
Effect of Operating Pressure
[0082] In order to study the influence of operating pressure on the exit CO concentration from ECPrOx, the total pressure of both the anode and the cathode were lowered from 30 psig to 0 psig in a stepwise manner while the other experimental conditions remained fixed. The corresponding exit CO concentration as a function of inlet flow rate is shown in FIG. 8(a), for a feed containing 200 ppm CO with the unit operated at 100 mA/cm2. With the decrease of the operating pressure, there was a significant increase in the exit CO concentration. At a feed rate of 60.1 sccm, the CO concentration jumped from 10 ppm at 30 psig to 42 ppm at 0 psig. The increase in exit CO concentration became more significant as the total pressure approached atmospheric pressure. Further, experiments were conducted to single out the effect of pressure change in the individual anode and cathode compartments (FIG. 8(b)). In one experiment, at an inlet flow rate of 71.6 sccm, the anode pressure was fixed at 0 psig while the cathode pressure was increased stepwise from 0 psig to 30 psig. The anode exit CO concentration remained unchanged (FIG. 8(b)). In another experiment, the cathode oxygen total pressure was fixed at 30 psig while the anode total pressure was increased stepwise from 0 psig to 30 psig. The exit CO concentration dropped in exactly the same manner as observed in FIG. 8(a). Therefore, it is evident that it is the anode pressure that is responsible for the change in exit CO concentration with varying operating pressures. The same result was observed for a feed containing 9380 ppm CO. As seen in FIG. 9, at a current density of 100 mA/cm2 and feed rate of 44.4 sccm, the exit CO concentration decreased with increase of the anode pressure. The exit CO concentration dropped from about 680 ppm at 10 psig to about 380 ppm at 30 psig.
[0083] A high anode total pressure (i.e., high CO partial pressure) is, thus, beneficial, to the removal of CO from the gas stream. A high CO partial pressure leads to an increase in the CO adsorption rate, and a high CO surface coverage. Therefore, the CO electrooxidation rate increases. This observation indicates that the ECPrOx can be operated at low pressures, or with air at ambient pressure.
Effect of Catalyst Loading
[0084] The effect of catalyst loading is shown in FIGS. 10(a)-(b). A higher catalyst loading was beneficial in lowering the exit CO concentration. The improvement became more apparent at higher flow rates and at higher inlet CO concentrations. At a flow rate of 71.6 sccm, the difference in exit CO concentration was about 5 ppm for feed containing 200 ppm CO, while for a feed containing 1000 ppm CO, the difference was around 25 ppm, as shown in FIG. 10(a).
[0085] The effect of catalyst loading for a feed containing 9380 ppm CO is shown in FIG. 10(b). In FIG. 10(b), the exit CO concentrations are compared at a given inlet flow rate but at different current densities. At a given inlet flow rate, the exit CO concentration decreased monotonously with an increase of operating current density for catalyst loading of 0.35 mg/cm2, in which case cell voltage remained at a stationary state. However, the CO concentration experienced a large jump between a current density of 100 and 120 mA/cm2 for the case of catalyst loading of 0.7 mg/cm2. This sudden concentration change was due to the transition of the cell voltage from a stationary state to an oscillatory state as a result of increased current density. At the upper branch (cell voltage in oscillatory state), the CO concentration also decreased with increasing current density, and was slightly higher than that at the lower catalyst loadings at a given current density. However, the above result does not necessarily lead to the conclusion that low catalyst loading was beneficial to feed containing high CO concentrations due to the following reasons. Firstly, the ECPrOx unit was preferably operated at low current density, e.g., 100 mA/cm2, where the exit CO concentration for the lower catalyst loading was more than double as compared to that for the higher loading. Secondly, although the exit CO concentration at higher current densities was slightly lower for the low-loading unit, the cell voltage for the low-loading unit was polarized to almost zero. Reduction in exit CO concentration was only a part of the benefit of a higher catalyst loading. Supplemental power output increased as well at higher catalyst loadings in the anode. For example, at a current density of 150 mA/cm2 and a feed containing 1000 ppm CO, the average power output was 43.5 mW/cm2 for a catalyst loading of 0.35 mg/cm2, while it was about 80 mW/cm2 for an anode loading of 0.7 mg/cm2.
Effect of Humidification
[0086] The exit CO concentration was also compared with and without humidification of the feed gases at otherwise identical experimental conditions. The anode and cathode feed were introduced directly into the ECPrOx Unit, with the humidifier bypassed, for an anode feed containing 200 ppm of CO. As seen in FIG. 11, the exit CO concentration was virtually identical. In the case of humidification (at room temperature), the water partial pressure was relatively small (0.032 atm, assuming a 100% relative humidity). Thus, for this case, water produced by the electrochemical reaction at the cathode was more significant in terms of contribution to the hydration of the membrane. For Nafion 115 membrane, the membrane conductivity does not change appreciably with current density up to about 1000 mA/cm2 (see, for example, S. Slade, S. A. Campbell, T. R. Ralph, and F. C. Walsh, J. Electrochem. Soc., 149, A1556 (2002), the entire teachings of which are incorporated herein by reference), which is well above the current densities in this work (100-200 mA/cm2). Therefore, water transport due to electro-osmotic drag can be counterbalanced by the back-diffusion of liquid water produced at the cathode membrane-electrode interface. Thus, although Nafion 117 membrane was used, there may not be membrane dehydration even without feed humidification due to low temperature and current densities used.
Characterization of ECPrOx Unit
[0087] In order to characterize and compare the performance of ECPrOx unit with the conventional PrOx reactor, three quantities were calculated as discussed below.
[0088] The first is CO conversion, XCO, which is defined similarly to that in the PrOx reactor, and evaluated by the CO concentration entering and exiting the ECPrOx unit, X CO = f in x CO , in - f out x CO f in x CO , in
where fin and fout are the total molar flow rates at inlet and outlet, respectively, and xCO,in and xCO are the CO mole fractions in the inlet and outlet gas stream.
[0089] In ECPrOx unit, a pre-determined (by selected current density) amount of hydrogen is consumed to generate current and polarize the anode. Meanwhile, CO electrooxidation contributes to the total Faradiac current drawn from the ECPrOx unit as well. Thus, the fraction of CO electro-oxidation current in the total Faradaic current, βFCO, is defined as β F CO = i CO i CO + i H 2 = 2 F f in CO X CO I
where finCO is the inlet molar flow rate of CO, F is the Faradaic constant, and I is the total current.
[0090] In principle, if the CO concentration is high enough, the ratio could approach one, i.e., almost all the Faradaic current and anode polarization is contributed from CO electro-oxidation. In this sense, CO is viewed as a fuel instead of a poison.
[0091] The last factor to consider is the hydrogen recovery, defined as the ratio between the inlet and outlet hydrogen molar flow rate, ɛ H 2 = f out H 2 f in H 2 = f in H 2 - I ( 1 - β F CO ) / 2 F f in H 2
[0092] These three values (XCO, βFCO and εH2) were calculated using experimental results obtained by an electrochemical device of the invention where 1000 ppm CO feed was employed. The calculated values are represented in FIGS. 12(a)-(c). As shown in FIG. 12(a), the calculated CO conversion decreased from 98% to 92% with the increase of inlet flow rates. This was due to the fact that the cell voltage did not change appreciably with inlet flow rates. Even though the CO electrooxidation rate might be increased with the increase of inlet flow rates, the increased CO consumption could not counterbalance the faster input of CO by the higher flow rates.
[0093] As shown in FIG. 12(b), for an anode feed containing 1000 ppm CO, the CO contribution in the overall current was only about 0.6 to 2%. The ratio of CO electrooxidation current in the total current increased with the inlet flow rates.
[0094] As shown in FIG. 12(c), the recovery of hydrogen was predominantly determined by the operating current at a certain inlet flow rate. For a current density of 100 mA/cm2, the hydrogen recovery was between 90 to 95% in the flow rates investigated. The recovery increased with the inlet flow rate for a given current density.
[0095] The CO conversion (FIG. 13(a)) and CO contribution to the overall current (FIG. 13(b)) in the ECPrOx unit of the invention at 100 mA/cm2 and a flow rate of 36.4 sccm were also calculated. Catalyst loading in the ECPrOx unit was 0.7 mg/cm2. As shown in FIG. 13(a), the calculated conversion of CO was nearly independent of the feed concentration, which indicated that unit was self-regulated and naturally stable. The CO electrooxidation current increased with the CO concentration in the feed, as shown in FIG. 13(b). For a feed containing 9380 ppm CO, the contribution of CO electrooxidation had increased to almost 10%, which was a substantial fraction of the total current drawn from the ECPrOx unit. If this trend is extrapolated, then higher feed CO concentration can contribute even more substantially to the total current by CO electrooxidation. Thus, CO can be viewed as a fuel instead of poison and it may be possible to eliminate the LTS stage.
EQUIVALENTS
[0096] While this invention has been particularly shown and described with references to preferred embodiments thereof, it will be understood by those skilled in the art that various changes in form and details may be made therein without departing from the scope of the invention encompassed by the appended claims.
PUM


Description & Claims & Application Information
We can also present the details of the Description, Claims and Application information to help users get a comprehensive understanding of the technical details of the patent, such as background art, summary of invention, brief description of drawings, description of embodiments, and other original content. On the other hand, users can also determine the specific scope of protection of the technology through the list of claims; as well as understand the changes in the life cycle of the technology with the presentation of the patent timeline. Login to view more.