

Method for the identification of colorectal tumors
- Summary
- Abstract
- Description
- Claims
- Application Information
AI Technical Summary
Benefits of technology
Problems solved by technology
Method used
Image

Examples
Embodiment Construction
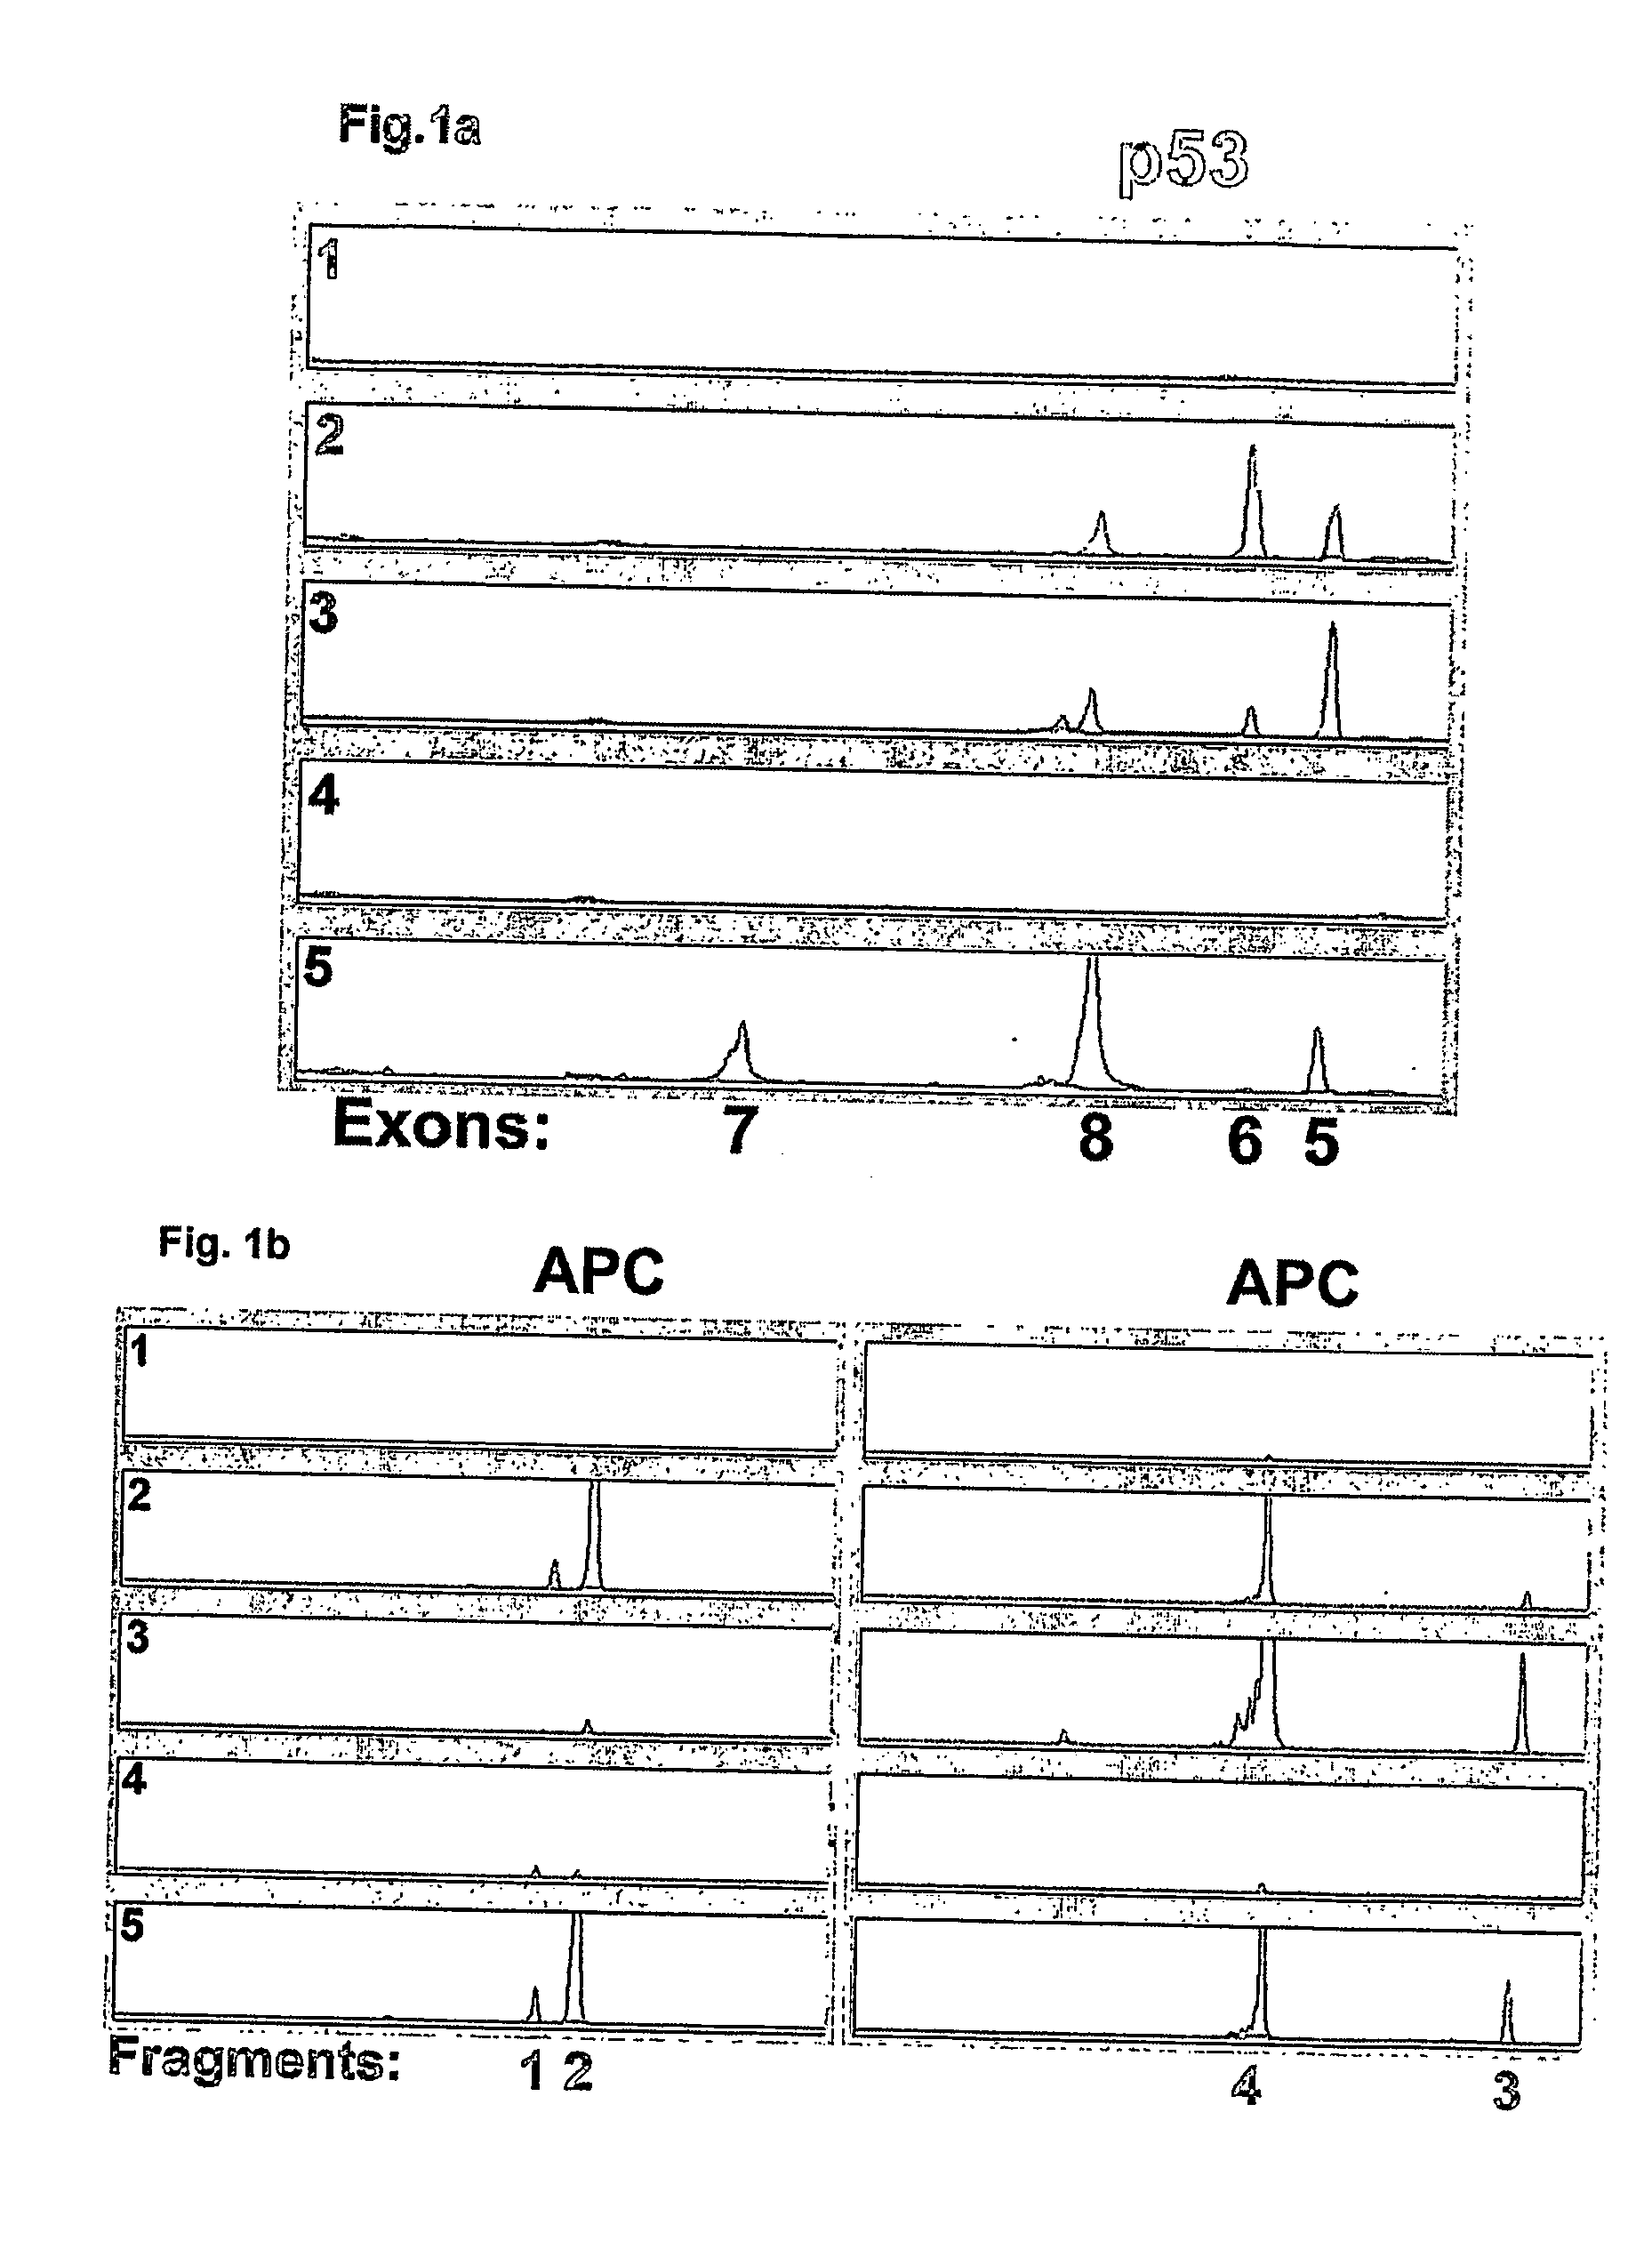
[0007] The present invention is based on a novel, accurate and rapid approach to cancer detection, that allows a better discrimination between affected and non-affected individuals.
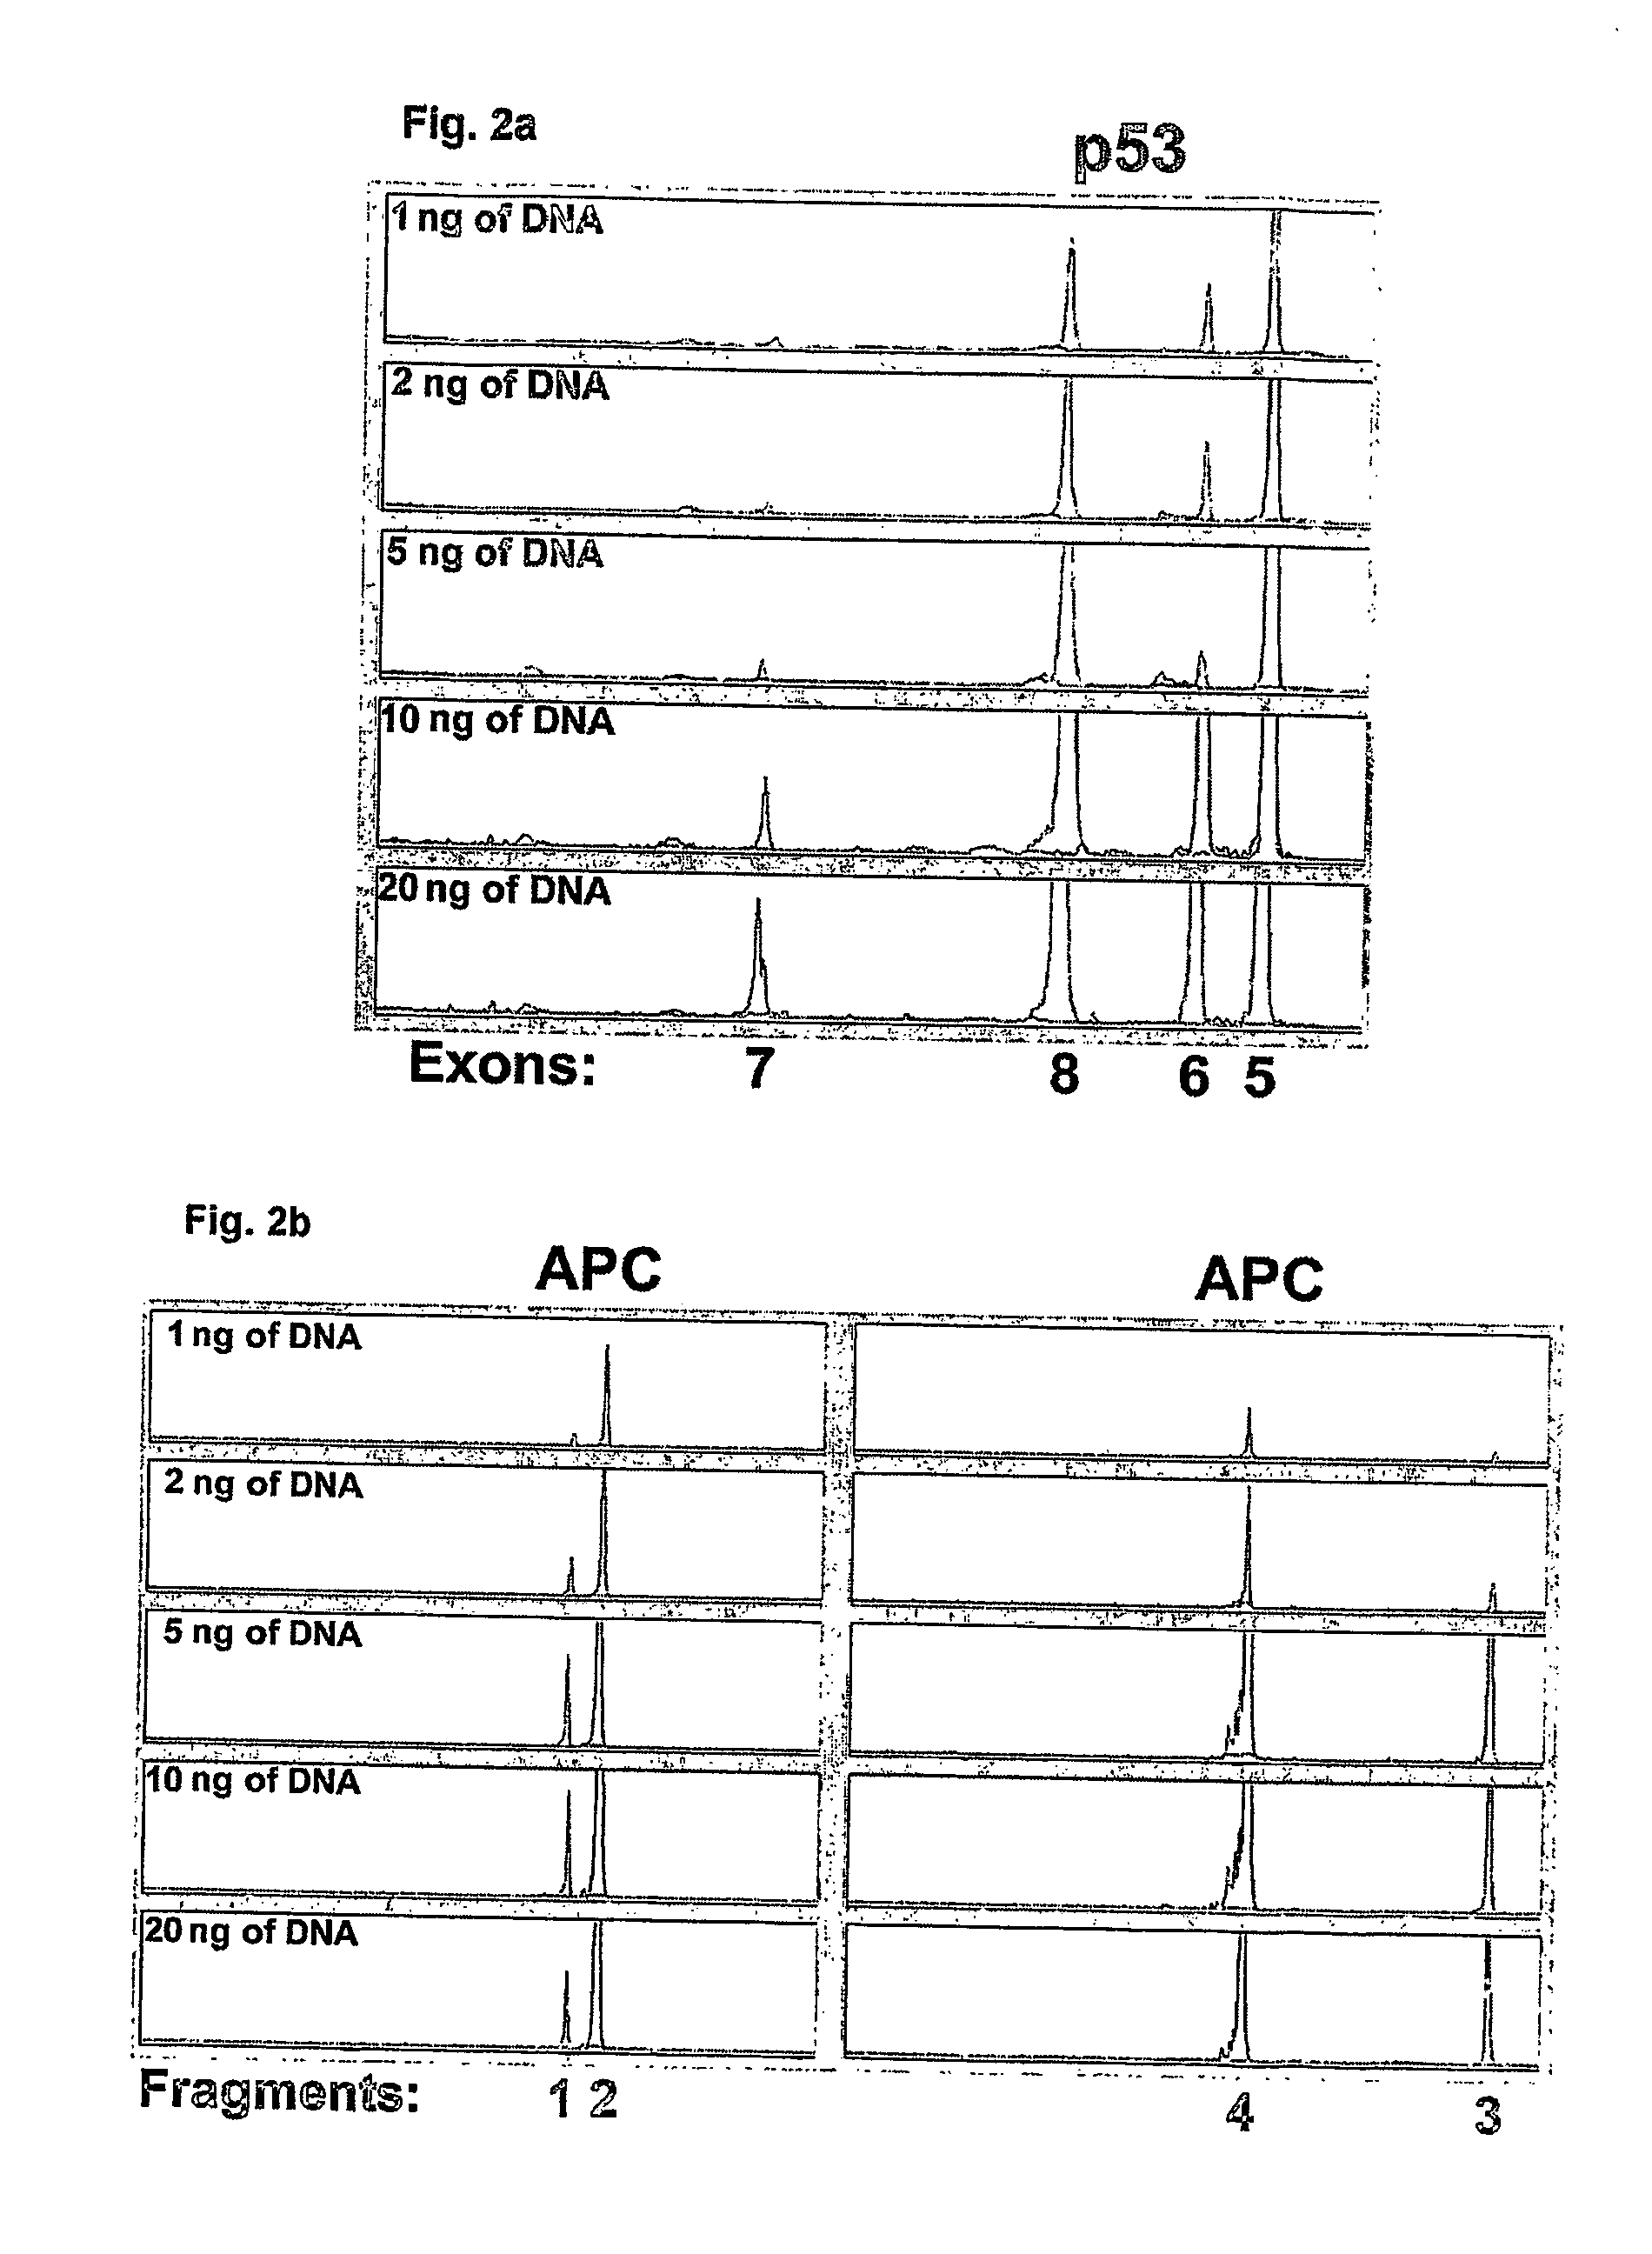
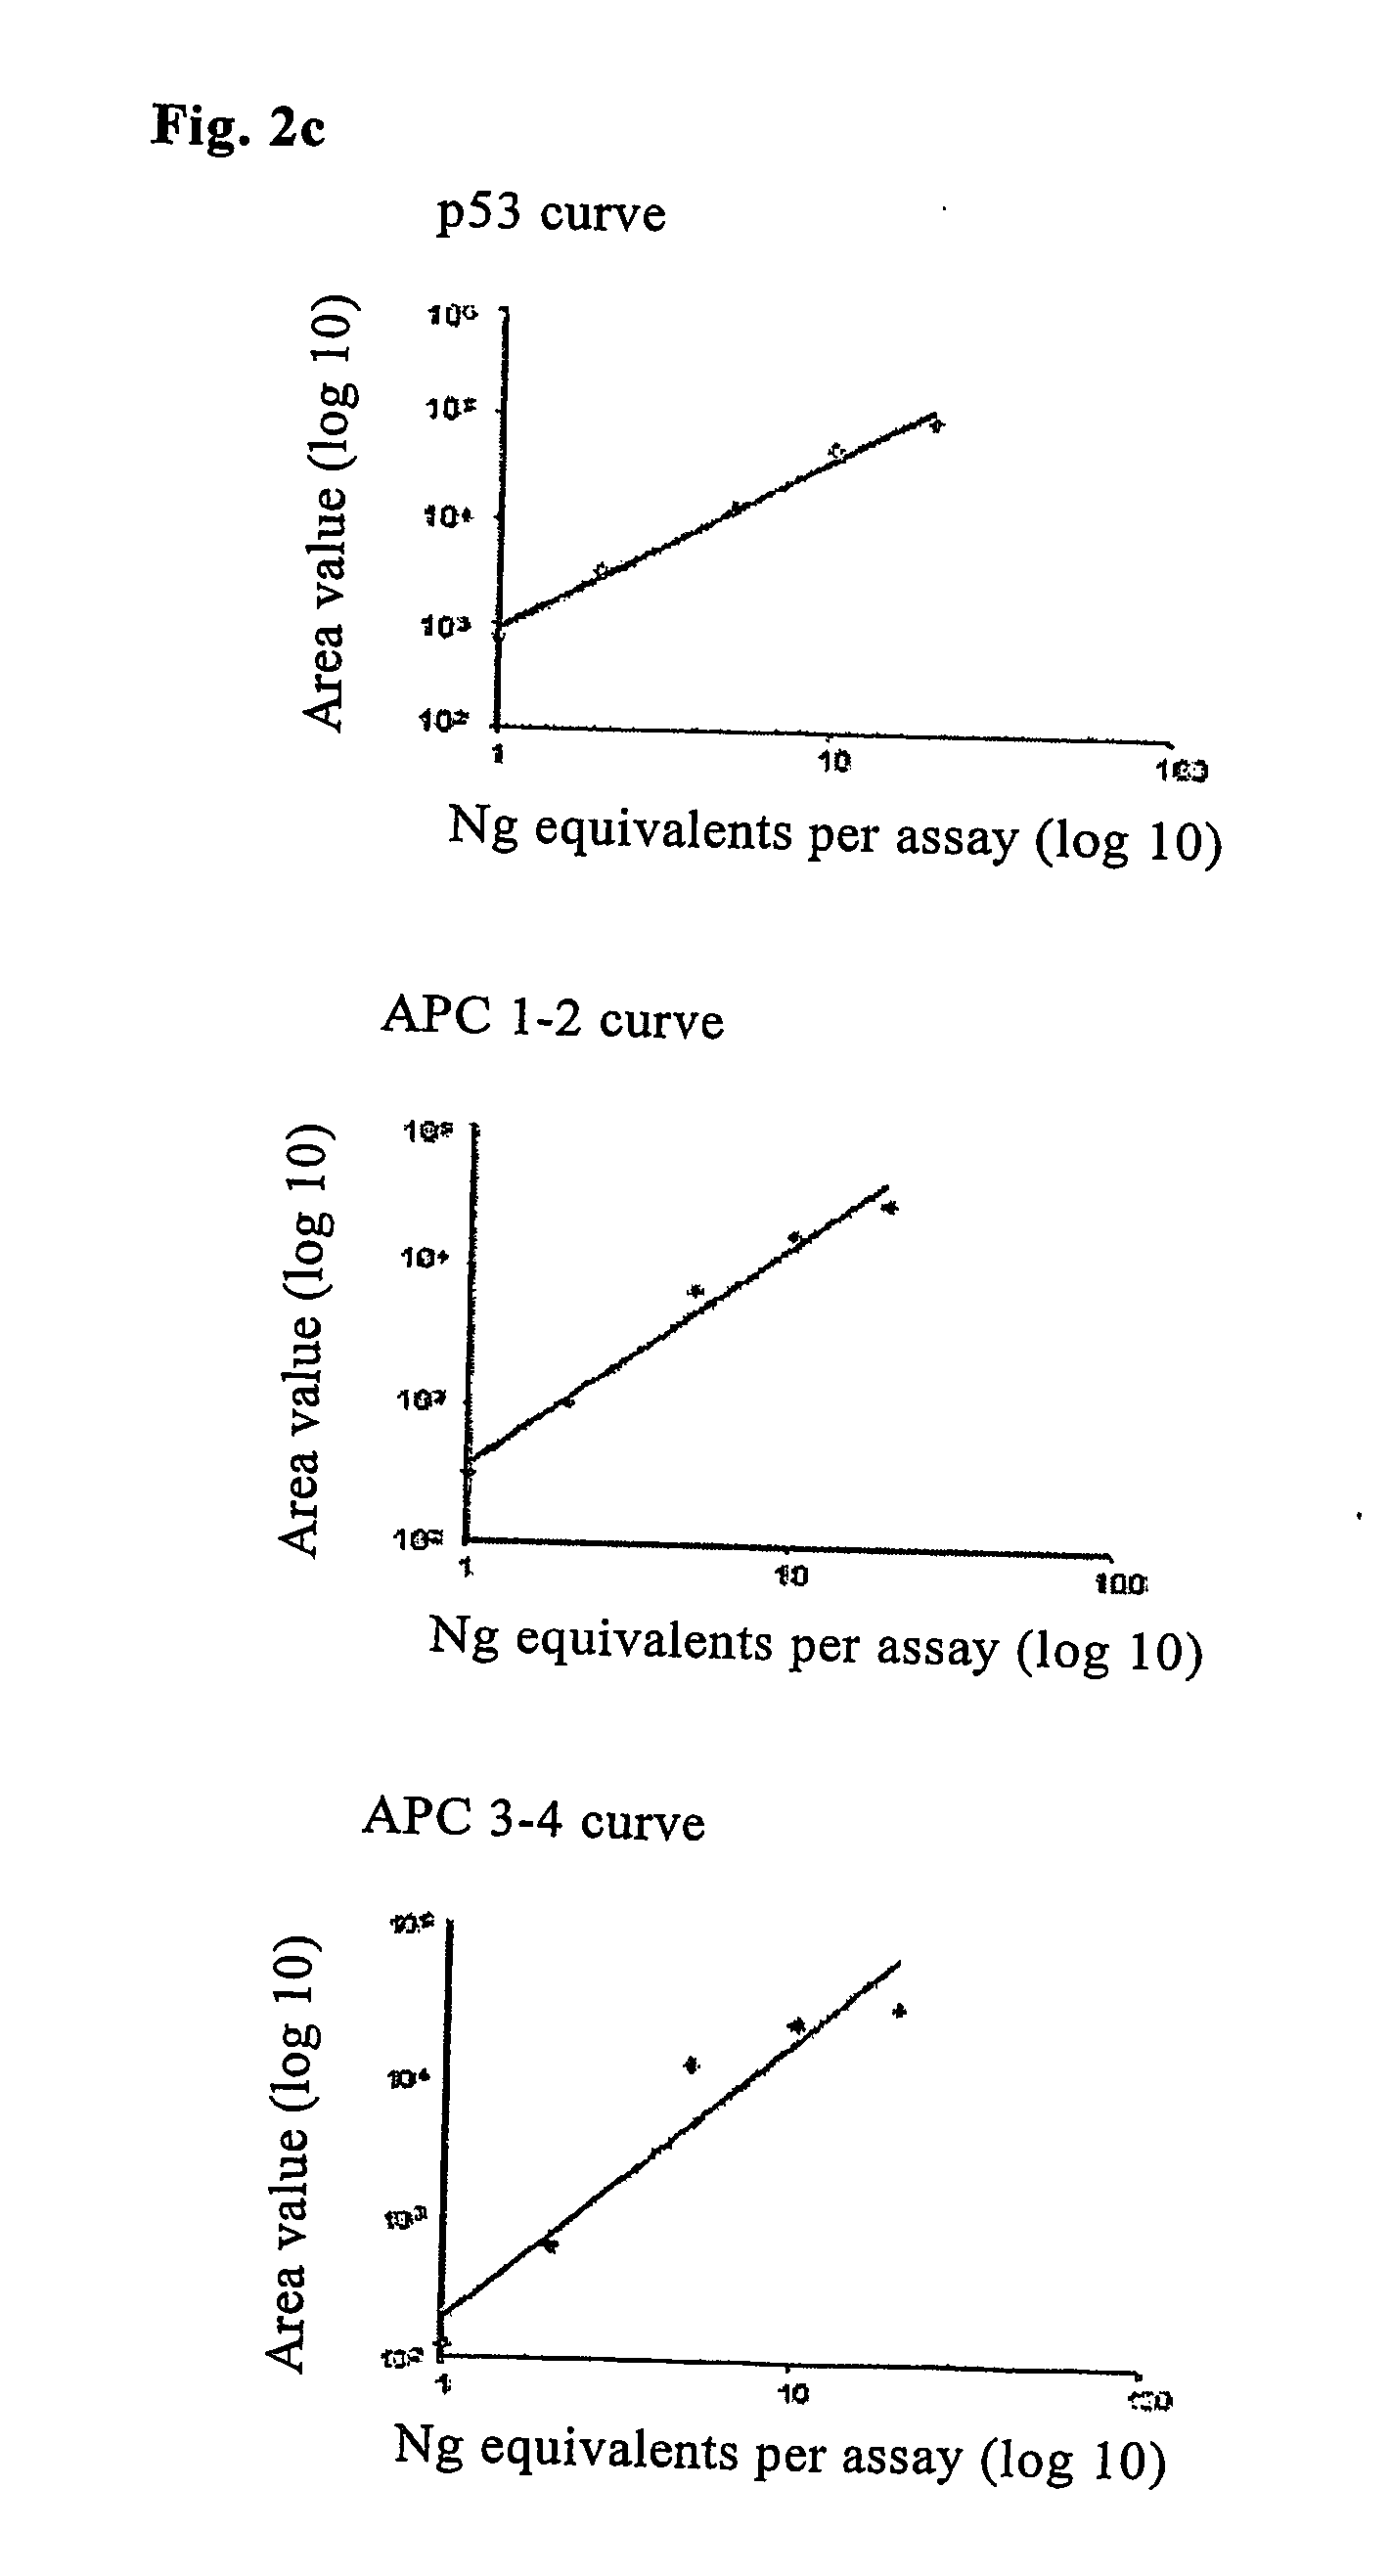
[0008] Specifically, object of the invention is a method for the quantitation of DNA from stool samples, useful for the early diagnosis of tumours and pre-cancerous lesions of the colon and rectum, which comprises the following steps: [0009] 1) DNA extraction from stool samples; [0010] 2) PCR amplification of at least three, preferably at least eight different DNA fragments with a length exceeding 100 base pairs, using deoxynucleotide triphosphates or primers labelled with detectable molecules; [0011] 3) quantitation of the amplified fragments (amplicons); [0012] 4) calculation of the total quantity of different amplicons; [0013] 5) comparison of the values obtained in (4) with a reference value.
[0014] The DNA extraction can be conducted by conventional techniques using commercially available kits. The ...
PUM
| Property | Measurement | Unit |
|---|---|---|
| Fluorescence | aaaaa | aaaaa |
| Thermal stability | aaaaa | aaaaa |
Abstract
Description
Claims
Application Information