
Method of semi-automatic data collection, data analysis, and model generation for the performance analysis of enterprise applications

a semi-automatic, data collection technology, applied in error detection/correction, instruments, digital computers, etc., can solve the problems of high unreliability of rules of thumb for complex systems whose behavior is difficult to understand and predict, unsatisfactory end users, and expensive and ineffective, etc., to achieve easy utilization by application designers, eliminate needless network trace and network resource data, and raise the abstraction level available from this data

Inactive Publication Date: 2008-03-06
HYPERFORMIX
View PDF7 Cites 63 Cited by
  • Summary
  • Abstract
  • Description
  • Claims
  • Application Information

AI Technical Summary

Benefits of technology

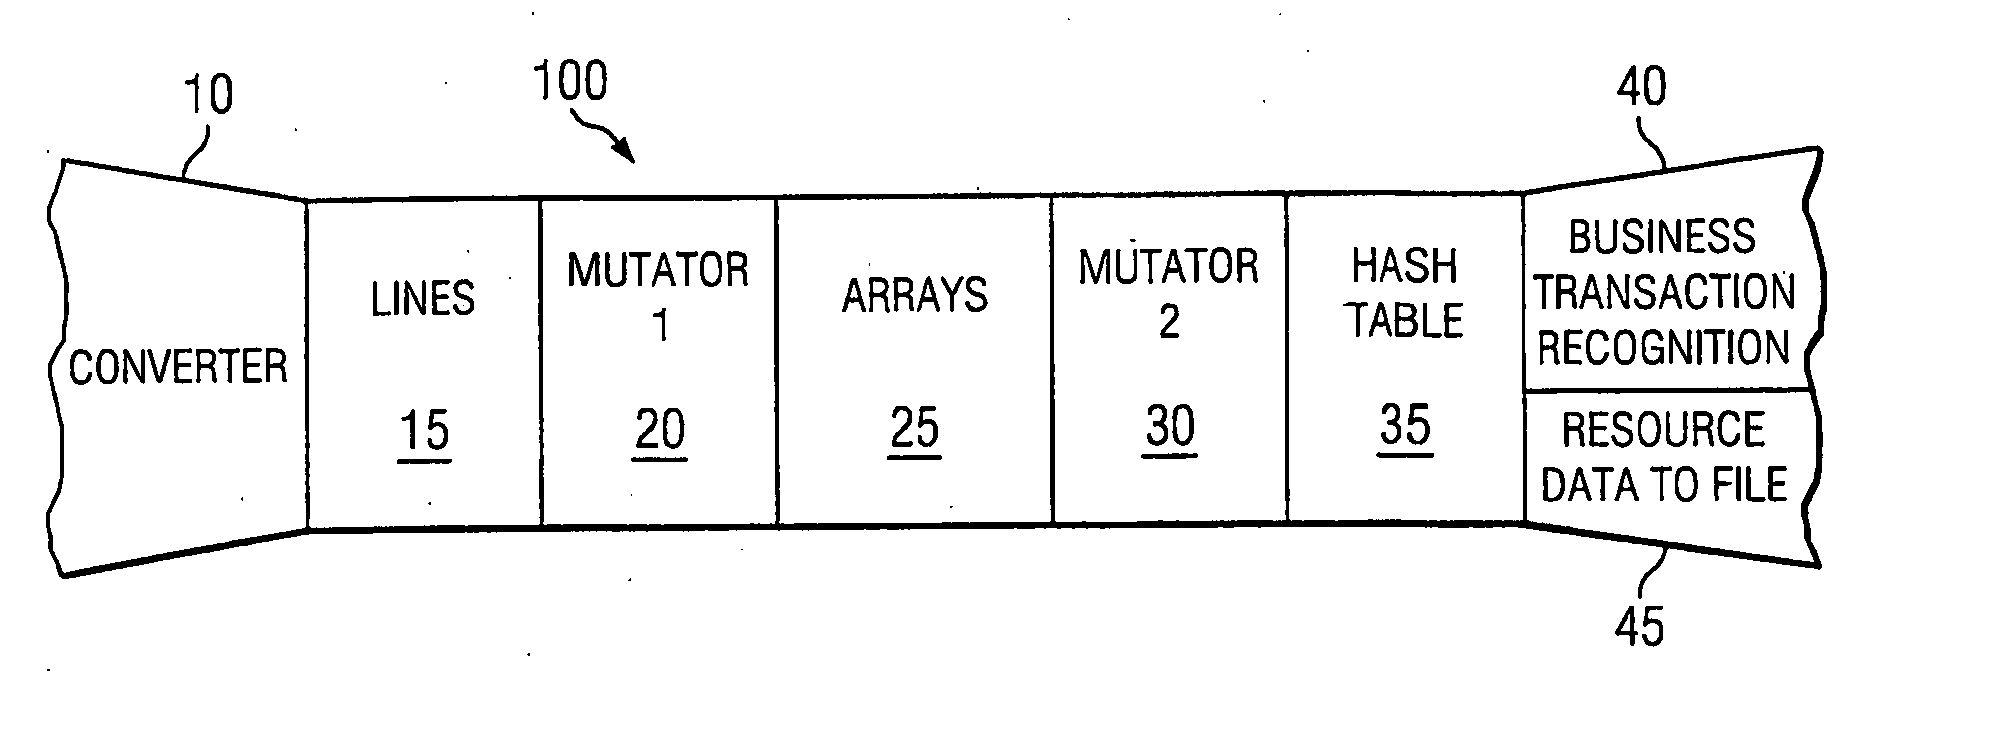
"The invention provides a graphical user interface that helps users analyze the performance of enterprise applications. It guides users through the steps in the analysis process and ensures that data from previous steps is only used for legitimate purposes. The interface also shows the current status of data files and allows users to see which steps have been performed or not. Underneath the interface, the invention uses data from various tools to create an enterprise application simulation model. The model allows users to visualize the relationships between network traces, resource data, and application data. The invention also provides algorithms to recognize transactions and a method for automatically generating models that can be easily used by application designers. Overall, the invention simplifies the analysis process and improves the understanding of enterprise applications."

Problems solved by technology

If the response times are too long, end users will be unsatisfied and many will take their business elsewhere.
Unfortunately, such rules of thumb are highly unreliable for complex systems whose behavior is difficult to understand and predict such as enterprise applications.
Such rules can suggest solutions that are expensive and ineffective and even counter-productive.
For example, upgrading the server in the example above may be completely unnecessary to obtain good performance and may even degrade the performance seen by some application users.
Unfortunately, the performance analyst needs to see a breakdown of that input / output by application, process (application component), service, and transaction.
Unfortunately, most network monitoring solutions available today report data at either gross aggregations of millions of bytes transmitted during a monitoring period or at the packet or frame level of granularity, whereas a message is typically composed of a number of packets or frames.
So, it is very difficult to reconstruct the transaction workflow (sequences of messages corresponding to a particular business function) from the monitoring data.
However, the monitoring data from product systems will not by itself identify future performance problems or good solutions to current problems.
Simple trend analysis has not been very successful for modern enterprise applications, even when much more sophisticated trend analysis techniques have been used because such applications are often highly nonlinear.
In addition, even when trend analysis predicts a performance bottleneck at a future load, it cannot predict the best solution to that bottleneck.
Clearly trend analysis is an inadequate predictive technique.
Load testing has many drawbacks, including the following: It is difficult, expensive and time-consuming to configure a laboratory installation identical to the production one, because of the complexities and subtleties of modern enterprise applications and infrastructures.
At best, load testing can identify potential future bottlenecks and other performance problems that may result under increasing or varying load, but cannot identify the solutions to those problems.
It is prohibitively expensive and time-consuming to load test all potentially good configurations to improve or optimize performance, since those configurations often require expensive additional equipment or very time-consuming reconfigurations of the application components.
Load testing is inadequate as a comprehensive planning method.
Unfortunately, it is difficult to construct accurate analytic models of the simplest modern computing environments.
The size and complexity of modern enterprise applications and the fundamental limitations of the analytic modeling technique make the analytic approach far too complex and inaccurate for most important problems.
The difficulty in applying this prior art technique lies in collecting data, analyzing data, and constructing the models.
Traditionally these steps have been performed by hand and are error prone and time consuming.
Unfortunately, end users of an enterprise application may see poor performance even when the network performs well.
Performance problems may exist with servers, middleware, databases, application configurations and other system components.
So, although network performance management using discrete event simulation is a major improvement over load testing and analytic techniques, it is inadequate as a comprehensive approach to enterprise application performance.
Until the current invention, the data collection, data analysis, model generation and performance project management activities have been difficult, error prone, and time consuming.
In the prior art, data analysis is typically performed manually, using statistics packages and spreadsheets, an error-prone and time-consuming approach.
However, the process of building the model is still error-prone and time-consuming, because of the following factors: Modern enterprise applications consist of a large number of components inter-related in complex ways.
Models of such applications need to represent these components and their relationships and so tend to be large and complex.
Most tools used to model enterprise applications do not contain adequate built-in domain knowledge of enterprise applications.
The modeling language is insufficiently focused and general, thereby adding complexity and confusion to the process of data collection and data analysis to support the abstractions available in the modeling language.
Each of these steps may involve a large number of sub-steps and complex data manipulations and produce a large number of data files.

Method used


Image

  • Method of semi-automatic data collection, data analysis, and model generation for the performance analysis of enterprise applications
  • Method of semi-automatic data collection, data analysis, and model generation for the performance analysis of enterprise applications
  • Method of semi-automatic data collection, data analysis, and model generation for the performance analysis of enterprise applications

Examples


Embodiment Construction

Data Collection Methodology

[0128] This invention includes a new methodology for collecting enterprise application performance data for the purposes of data analysis and model generation. The methodology is described by the following pseudocode: [0129] Methodology for collecting business transaction data [0130] Configure the application and infrastructure in a laboratory similar to the production application and infrastructure with each software component deployed on different servers connected by networks. [0131] For each business function: [0132] Write a load testing script mimicking the user's execution of this business function. [0133] Set up network sniffers between each tier of the enterprise application. [0134] Synchronize the clocks on each network sniffer. [0135] Initialize the network sniffer trace files and begin collecting data. [0136] Use the load testing script to drive the application with one instance of this business function. [0137] At the conclusion of the busine...


PUM


Abstract

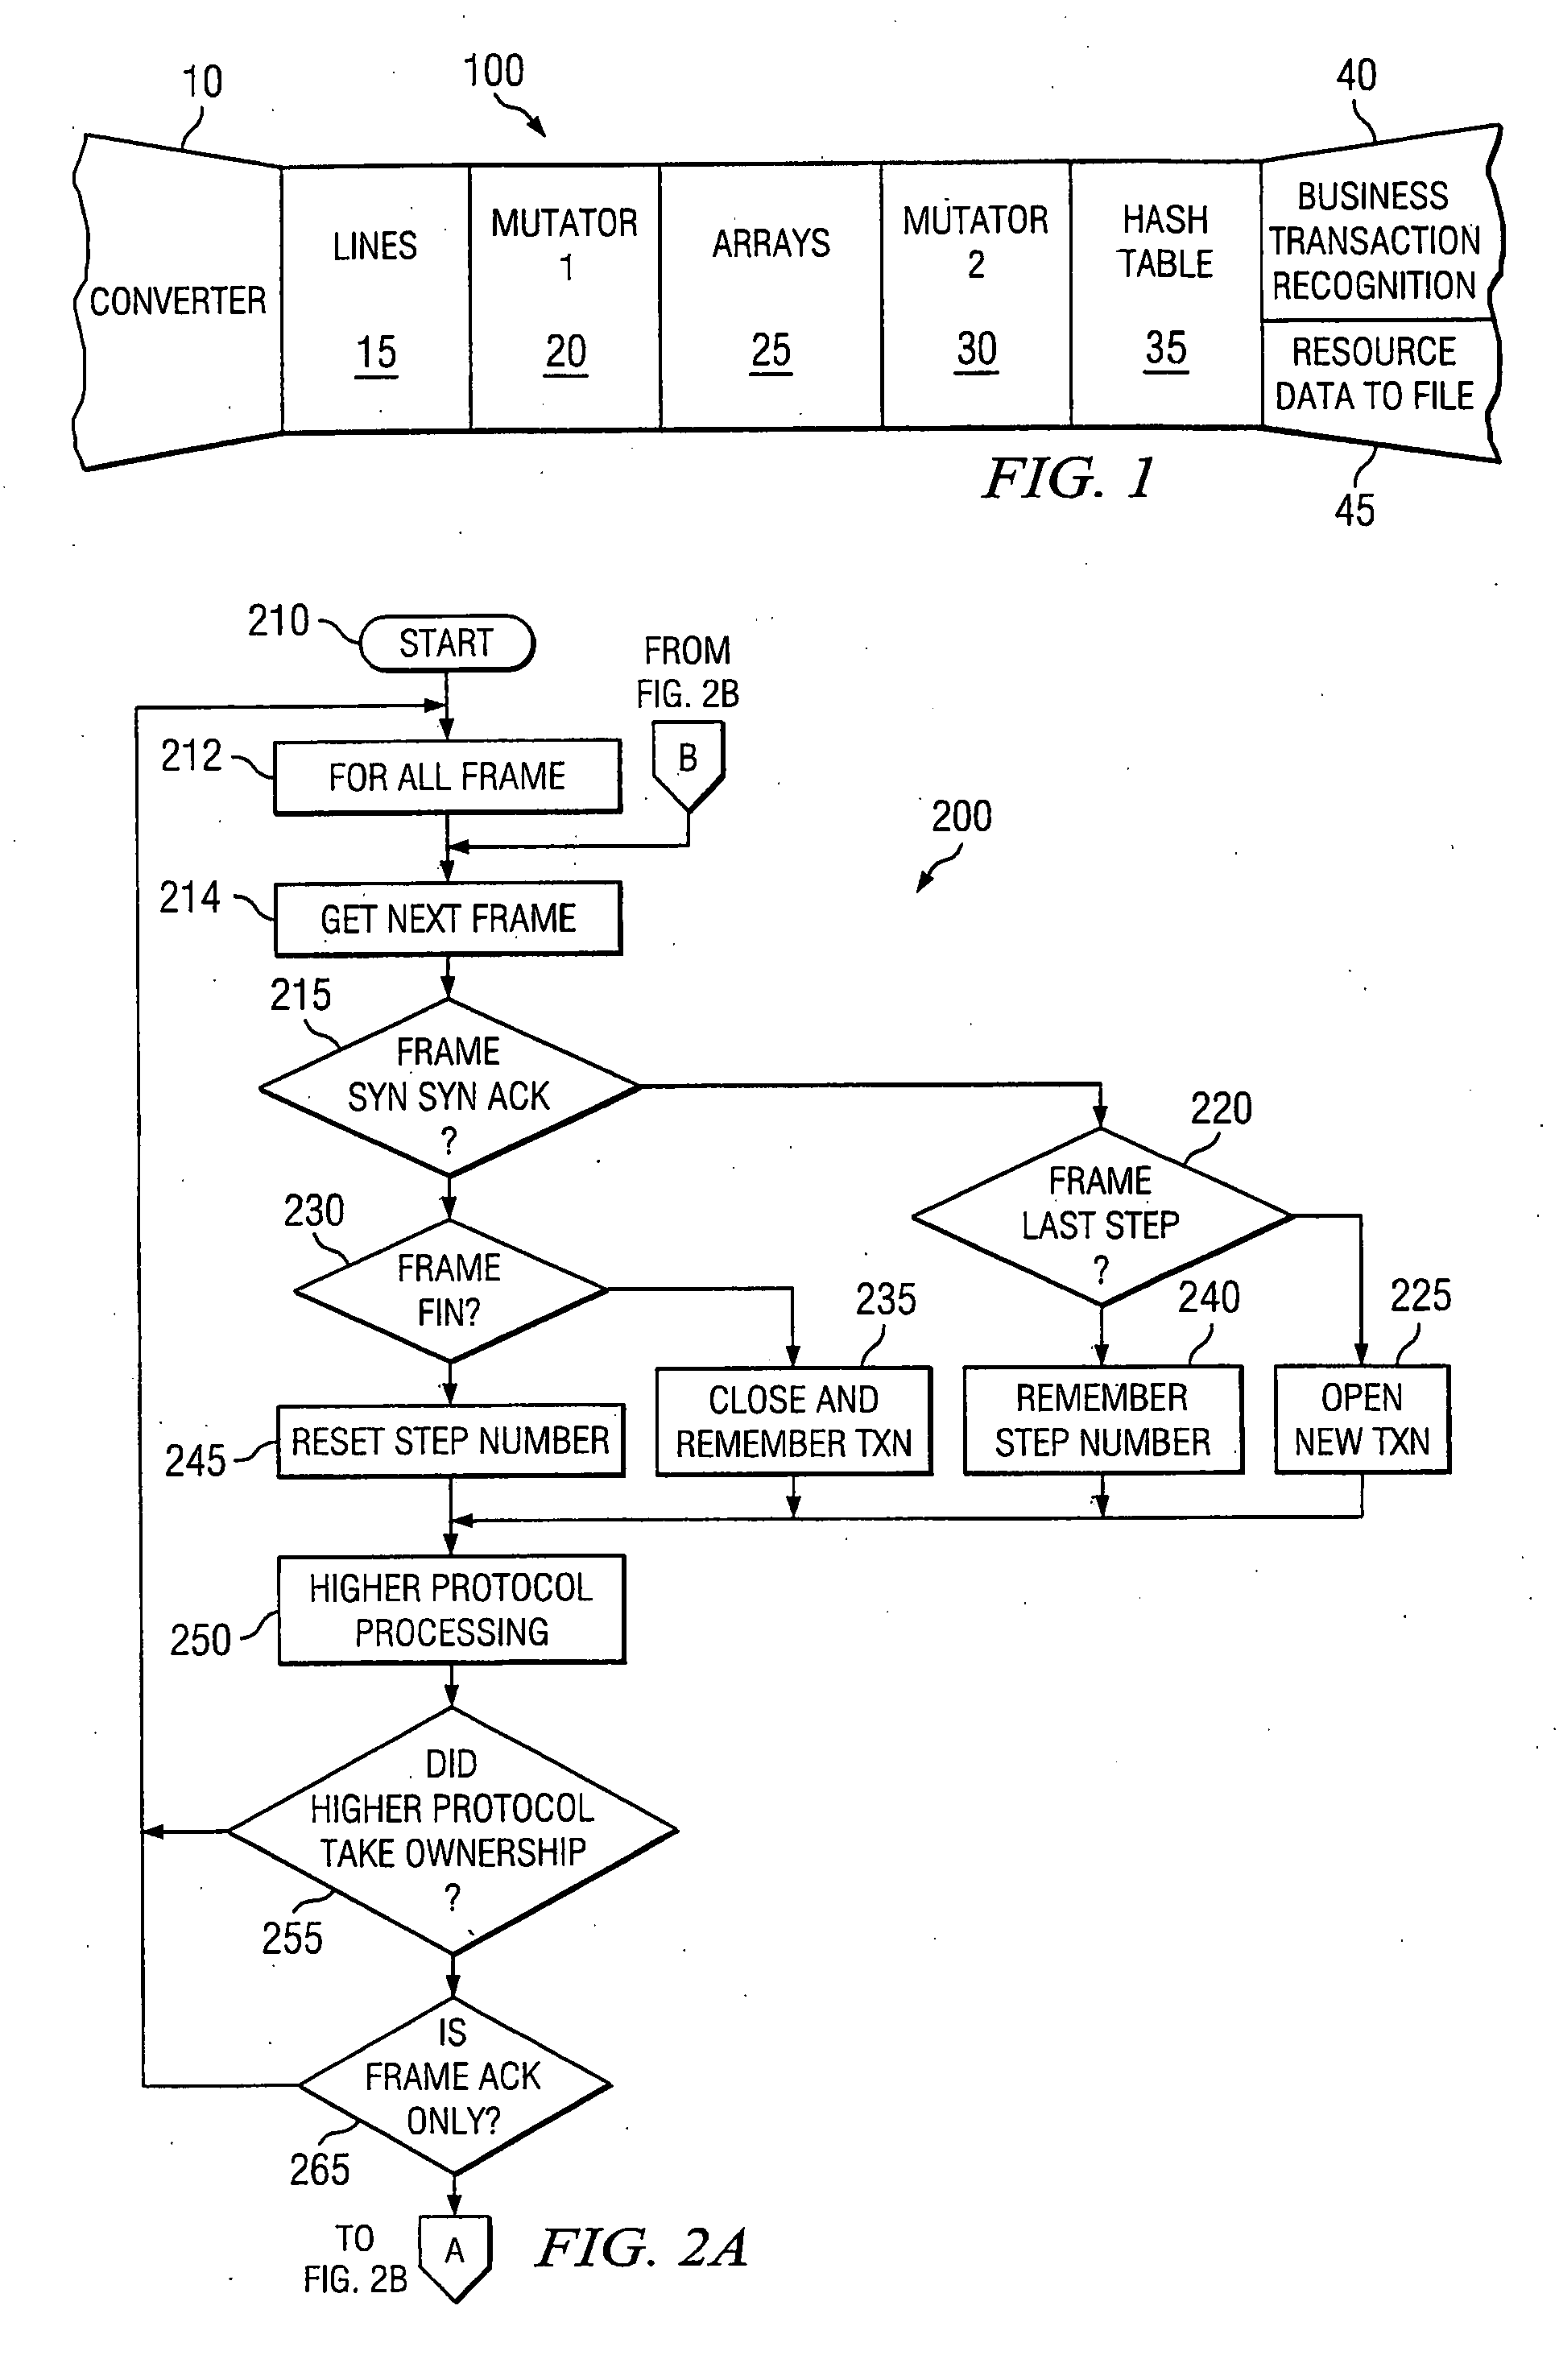
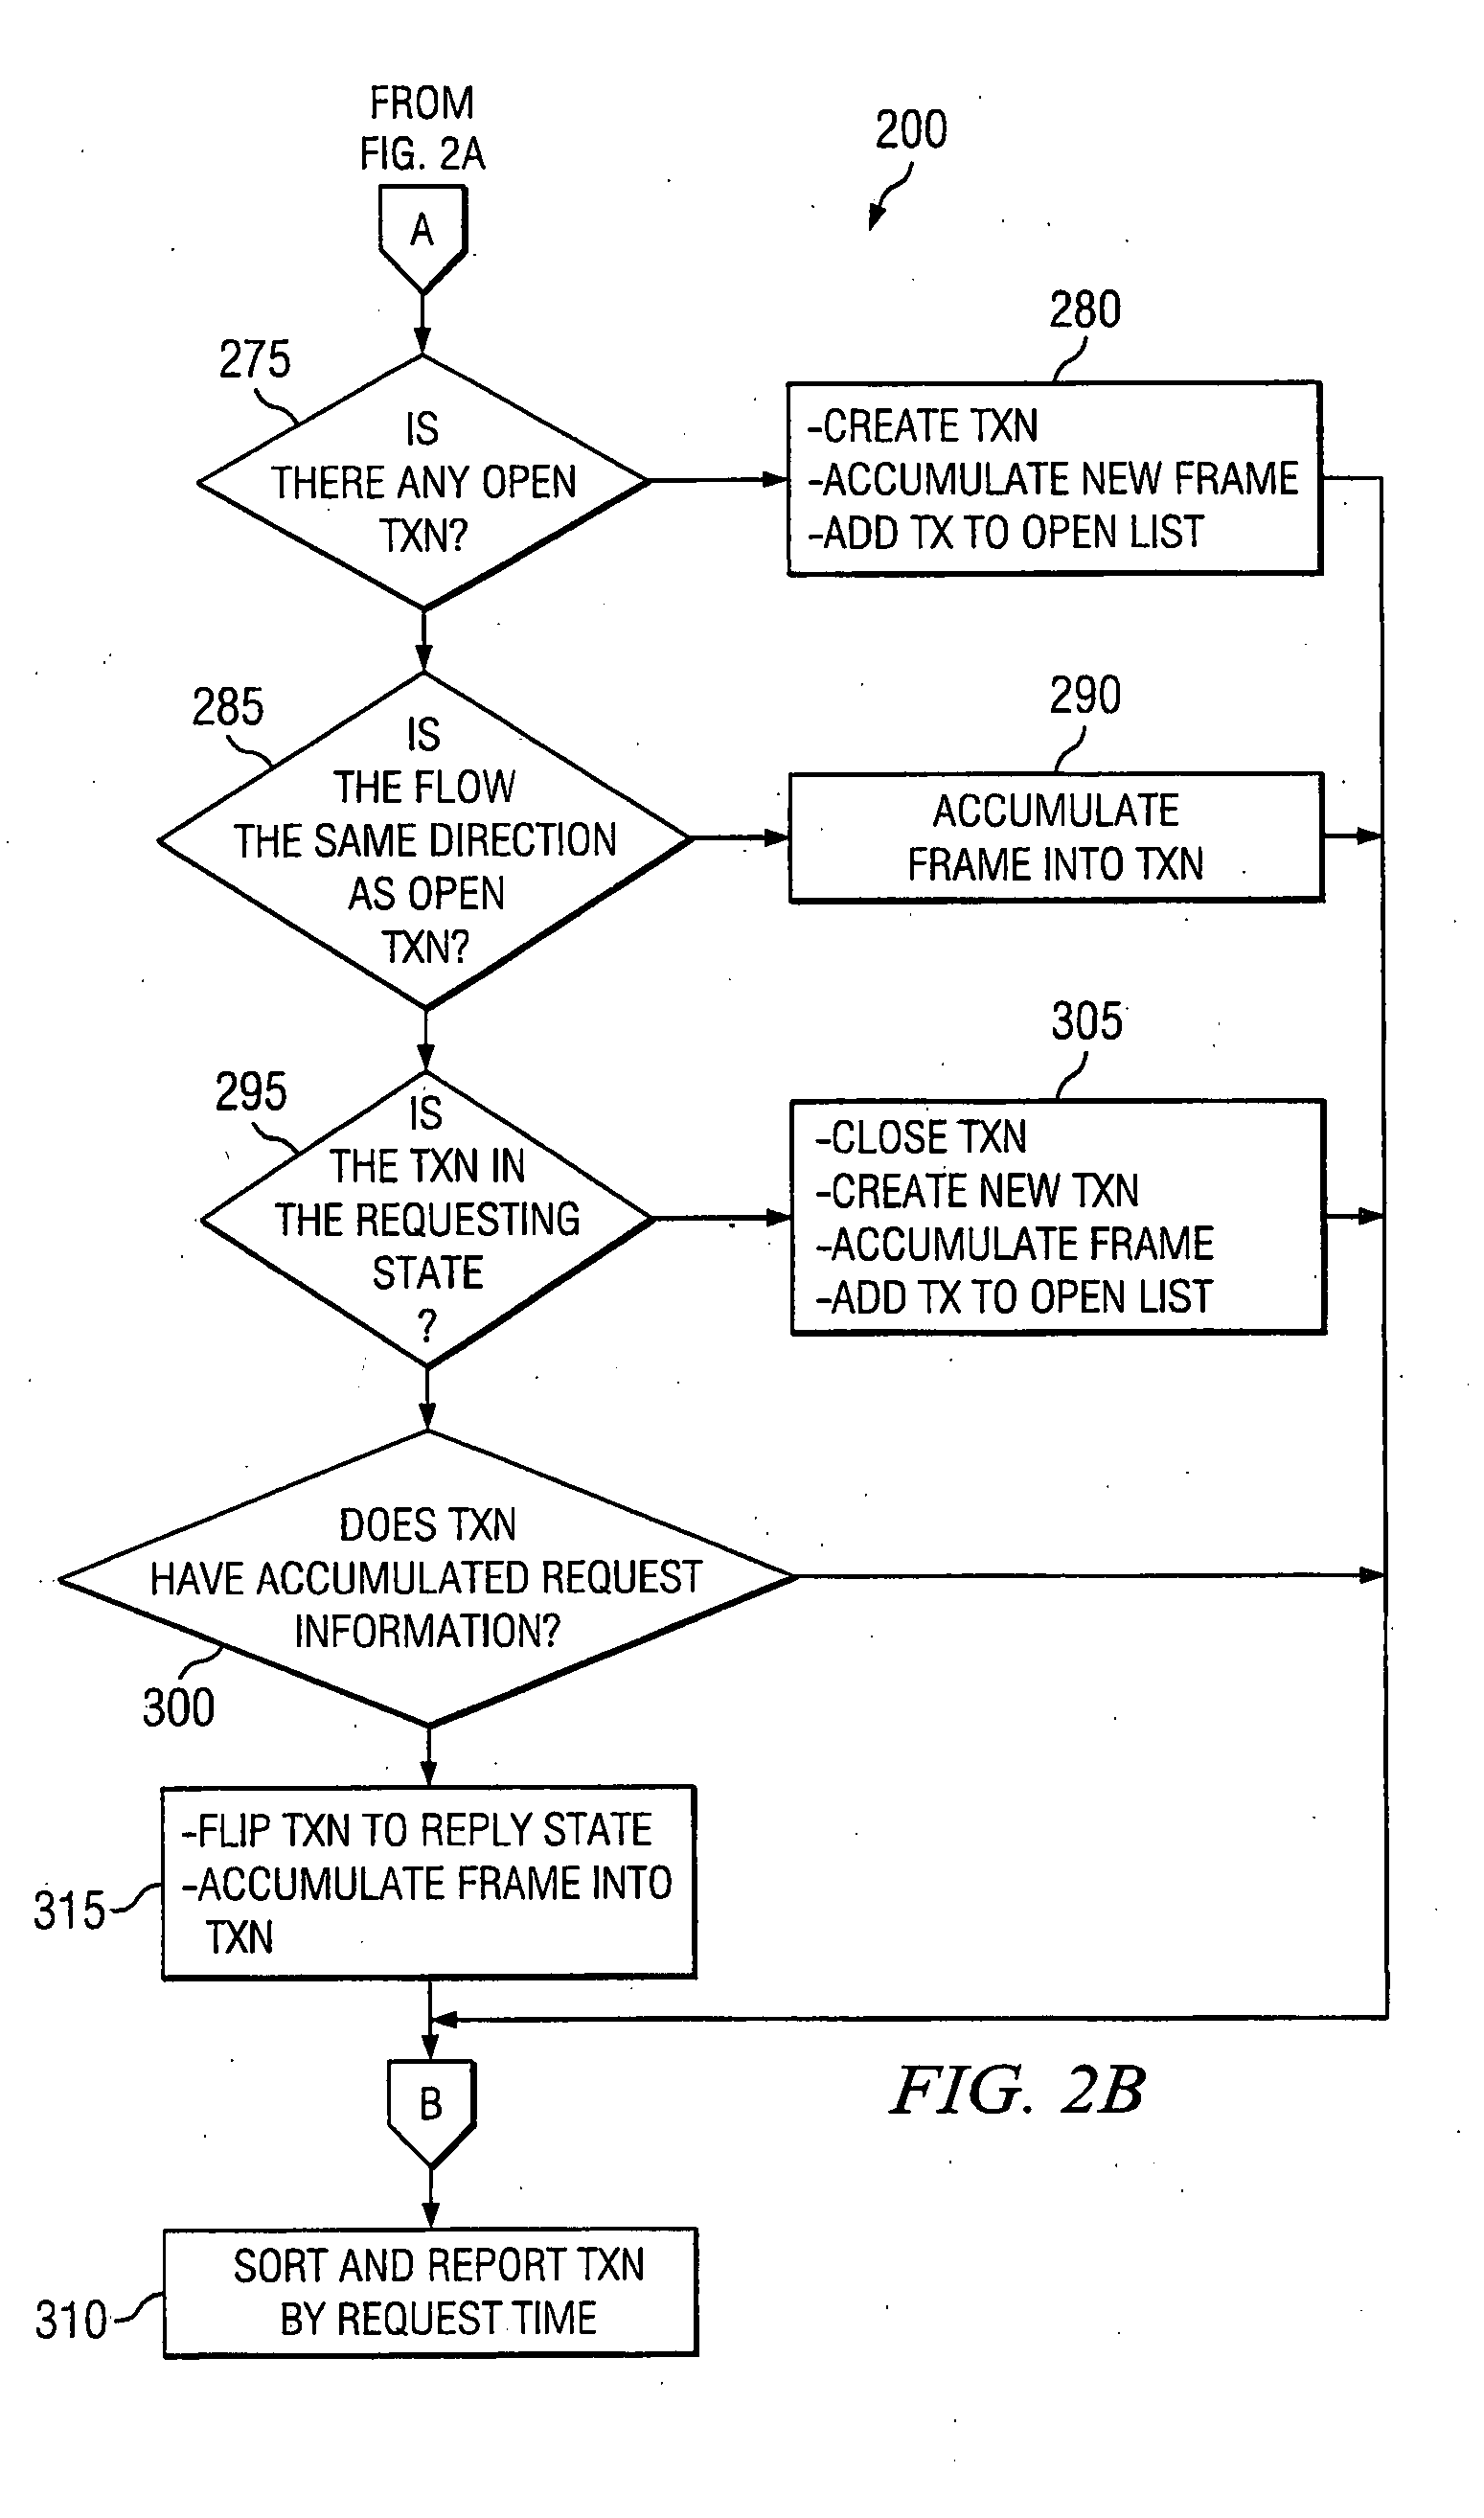
A method of semi-automatic data collection, data analysis and model generation for performance analysis of computer networks and software is provided. The invention provides a graphical user interface which indicates the overall data flow in the performance analysis process and guides the user through the proper sequence of steps in that process. Underneath the graphical user interface, the invention provides software tools which include novel data pipeline for transformation of network traces, resource data and application data into organized hash tables, and further into spreadsheets for introduction into computer network simulation programs. The invention also provides novel algorithms for recognizing transaction and parentage between transactions from low level network trace data. The invention further provides novel methods of visualization of trace data and transaction and parentage associations.

Description

CROSS-REFERENCE TO RELATED APPLICATIONS [0001] This application is a Continuation claiming priority benefit from U.S. patent application Ser. No. 10 / 354,230 entitled “A method of semi-automatic data collection, data analysis, and model generation for the performance analysis of enterprise applications” filed on Jan. 29, 2003, which in turn claims priority to U.S. Provisional Patent Application Nos. 60 / 376,613 filed May 1, 2002; 60 / 368,923 filed Mar. 29, 2002; 60 / 376,612 filed May 1, 2002; 60 / 372,846 filed Apr. 16, 2002; and 60 / 372,837 filed Apr. 16, 2002.FIELD OF THE INVENTION [0002] The field of the invention is computer software used to simulate and analyze enterprise applications. BACKGROUND OF THE INVENTION [0003] Modern enterprise applications are characterized by multiple components deployed across multiple network tiers (sets of computers) accessed by users across a network. Examples of enterprise applications include Enterprise Resource Planning (ERP), Customer Relationship ...

Claims


Application Information

Patent Timeline
Patent Type & Authority Applications(United States)
IPC IPC(8): G06F15/16
CPCG06F11/3414G06F11/3419G06F2201/87G06F2201/86G06F11/3495
Inventor BARNETT, PAUL T.BRADDOCK, DANIEL M.CLARKE, ALLAN DREWDUPRE, DAVID LEIGHGIMARC, RICHARDLEHR, THEODORE F.PALMER, ANNETTERAMACHANDRAN, RAJINIKALAREYNOLDS, JAMESSPELLMANN, AMY CAROLYNWEST, CAROLYNWISE, TIMOTHY E.ZAULI, TOMZINK, KENNETH
Owner HYPERFORMIX
Learn More