Method for determination of nucleated red blood cells and leukocytes in a whole blood sample in an automated hematology analyzer

a whole blood sample and hematology analyzer technology, applied in chemical methods analysis, dead animals, instruments, etc., can solve the problems of inability to report the white blood cell count by manual means, inaccurate white blood cell count, and operator's inability to accurately detect the presence of red blood cells in specimens containing hypotonically resistant red blood cells, etc., to achieve accurate correction of absorbance interference, reduce interference, and reduce the effect of interferen

Active Publication Date: 2008-06-26
ABBOTT LAB INC
View PDF23 Cites 52 Cited by
  • Summary
  • Abstract
  • Description
  • Claims
  • Application Information

AI Technical Summary

Benefits of technology

[0021]The method of this invention reduces interference from hypotonically resistant red blood cells, fragile white blood cells, platelet clumps, lipids, reticulocytes, and cell debris in clinical blood samples. In addition, the method of this invention can be used to analyze bone marrow samples and cord blood samples, which tend to have many interfering substances. The invention makes it possible to perform accurate total white blood cell and nucleated red blood cell counts, and detection and enumeration of platelet clumps in the same blood sample with the same lyse reagent in a single dilution of a blood sample. In addition, the enumeration of all nucleated cells enables a more accurate correction for absorbance interference of hemoglobin measurements when high numbers of nuclei (white blood cells or nucleated red blood cells) are present. The method of this invention provides a simple, cost-effective, and reliable fully automated hematology method for enumeration of nucleated red blood cells and white blood cells.

Problems solved by technology

Nucleated red blood cells tend to interfere with white blood cells, thereby causing the analyzer to either flag the white blood cell counting, thereby rendering the concentration of white blood cells not reportable, or including the nucleated red blood cells in the white blood cell count, thereby producing an inaccurate result.
Specimens containing fragile white blood cells or specimens containing hypotonically resistant red blood cells present a problem for automated hematology analyzers.
Fragile white blood cells can be lysed along with red blood cells, thereby rendering the white blood cell count inaccurate as being too low.
Hematology analyzers invalidate these inaccurate results, with the result that the operator is forced to acquire a reportable result by manual means.
Although nucleated red blood cells may occur as rare events in the blood of normal adults, their frequency is so low that, when seen, they are regarded as a significant abnormality.
Interference of white blood cell counting by nucleated red blood cells generally adversely affect the accuracy of the method and, consequently, the performance of a hematology analyzer for the complete blood count.
Despite the fact that accuracy of nucleated red blood cell recognition is high, it is clear that the statistical limitations of the 100 or 200 leukocyte differentials result in apparent inaccuracy and insensitivity when the ratio of nucleated red blood cells to white blood cells is below about 10%.
While fluorescence flow cytometry techniques can accurately resolve nucleated red blood cells from other cellular components of the blood, in practice, the expense of these procedures as well as their reliance on many manual intervention steps, prevent widespread application for routine clinical uses.
Those interfering substances are often critical factors, or limitations, of the method to determine the performance or quality of nucleated red blood cell count and white blood cell count for the complete blood count (CBC).
However, some samples from newborn babies, sickle, and thalassemic red blood cells and nucleated red blood cells are resistant to the lytic reagents used during analysis of nucleated red blood cells.
In addition, fluorescent dyes and special reagents for performing some automated fluorescence flow cytometry techniques are costly.
Interference with white blood cell counting is a serious problem because users do not have another way to count white blood cells.

Method used


Image

  • Method for determination of nucleated red blood cells and leukocytes in a whole blood sample in an automated hematology analyzer
  • Method for determination of nucleated red blood cells and leukocytes in a whole blood sample in an automated hematology analyzer
  • Method for determination of nucleated red blood cells and leukocytes in a whole blood sample in an automated hematology analyzer

Examples


example 1

[0074]The current CELL-DYN® 3000 Series analyzer and CELL-DYN® Diff Screen reagents, diluent, and lyse reagent, are used for this method. The diluent was described in U.S. Pat. No. 5,227,304, previously incorporated herein by reference and the lyse reagent was described in U.S. Pat. No. 5,958,781, previously incorporated herein by reference. The method involves the step of mixing lyse reagent with a whole blood sample diluted by a diluent, wherein the ratio lyse reagent to diluent ranges from about 1 part lyse reagent to from about 3 parts to about 8 parts diluent. The lyse reagent lyses the whole blood sample to form a lysate. The lysate is then transferred to the analyzer for white blood cell and nucleated red blood cell counting. During actual operation, 200 μL of lyse reagent diluted with 900 μL of diluent is then immediately mixed with 10 μL of blood / sample in the mixing chamber. After a bubble mixing, the lysate is analyzed automatically in the analyzer.

example 2

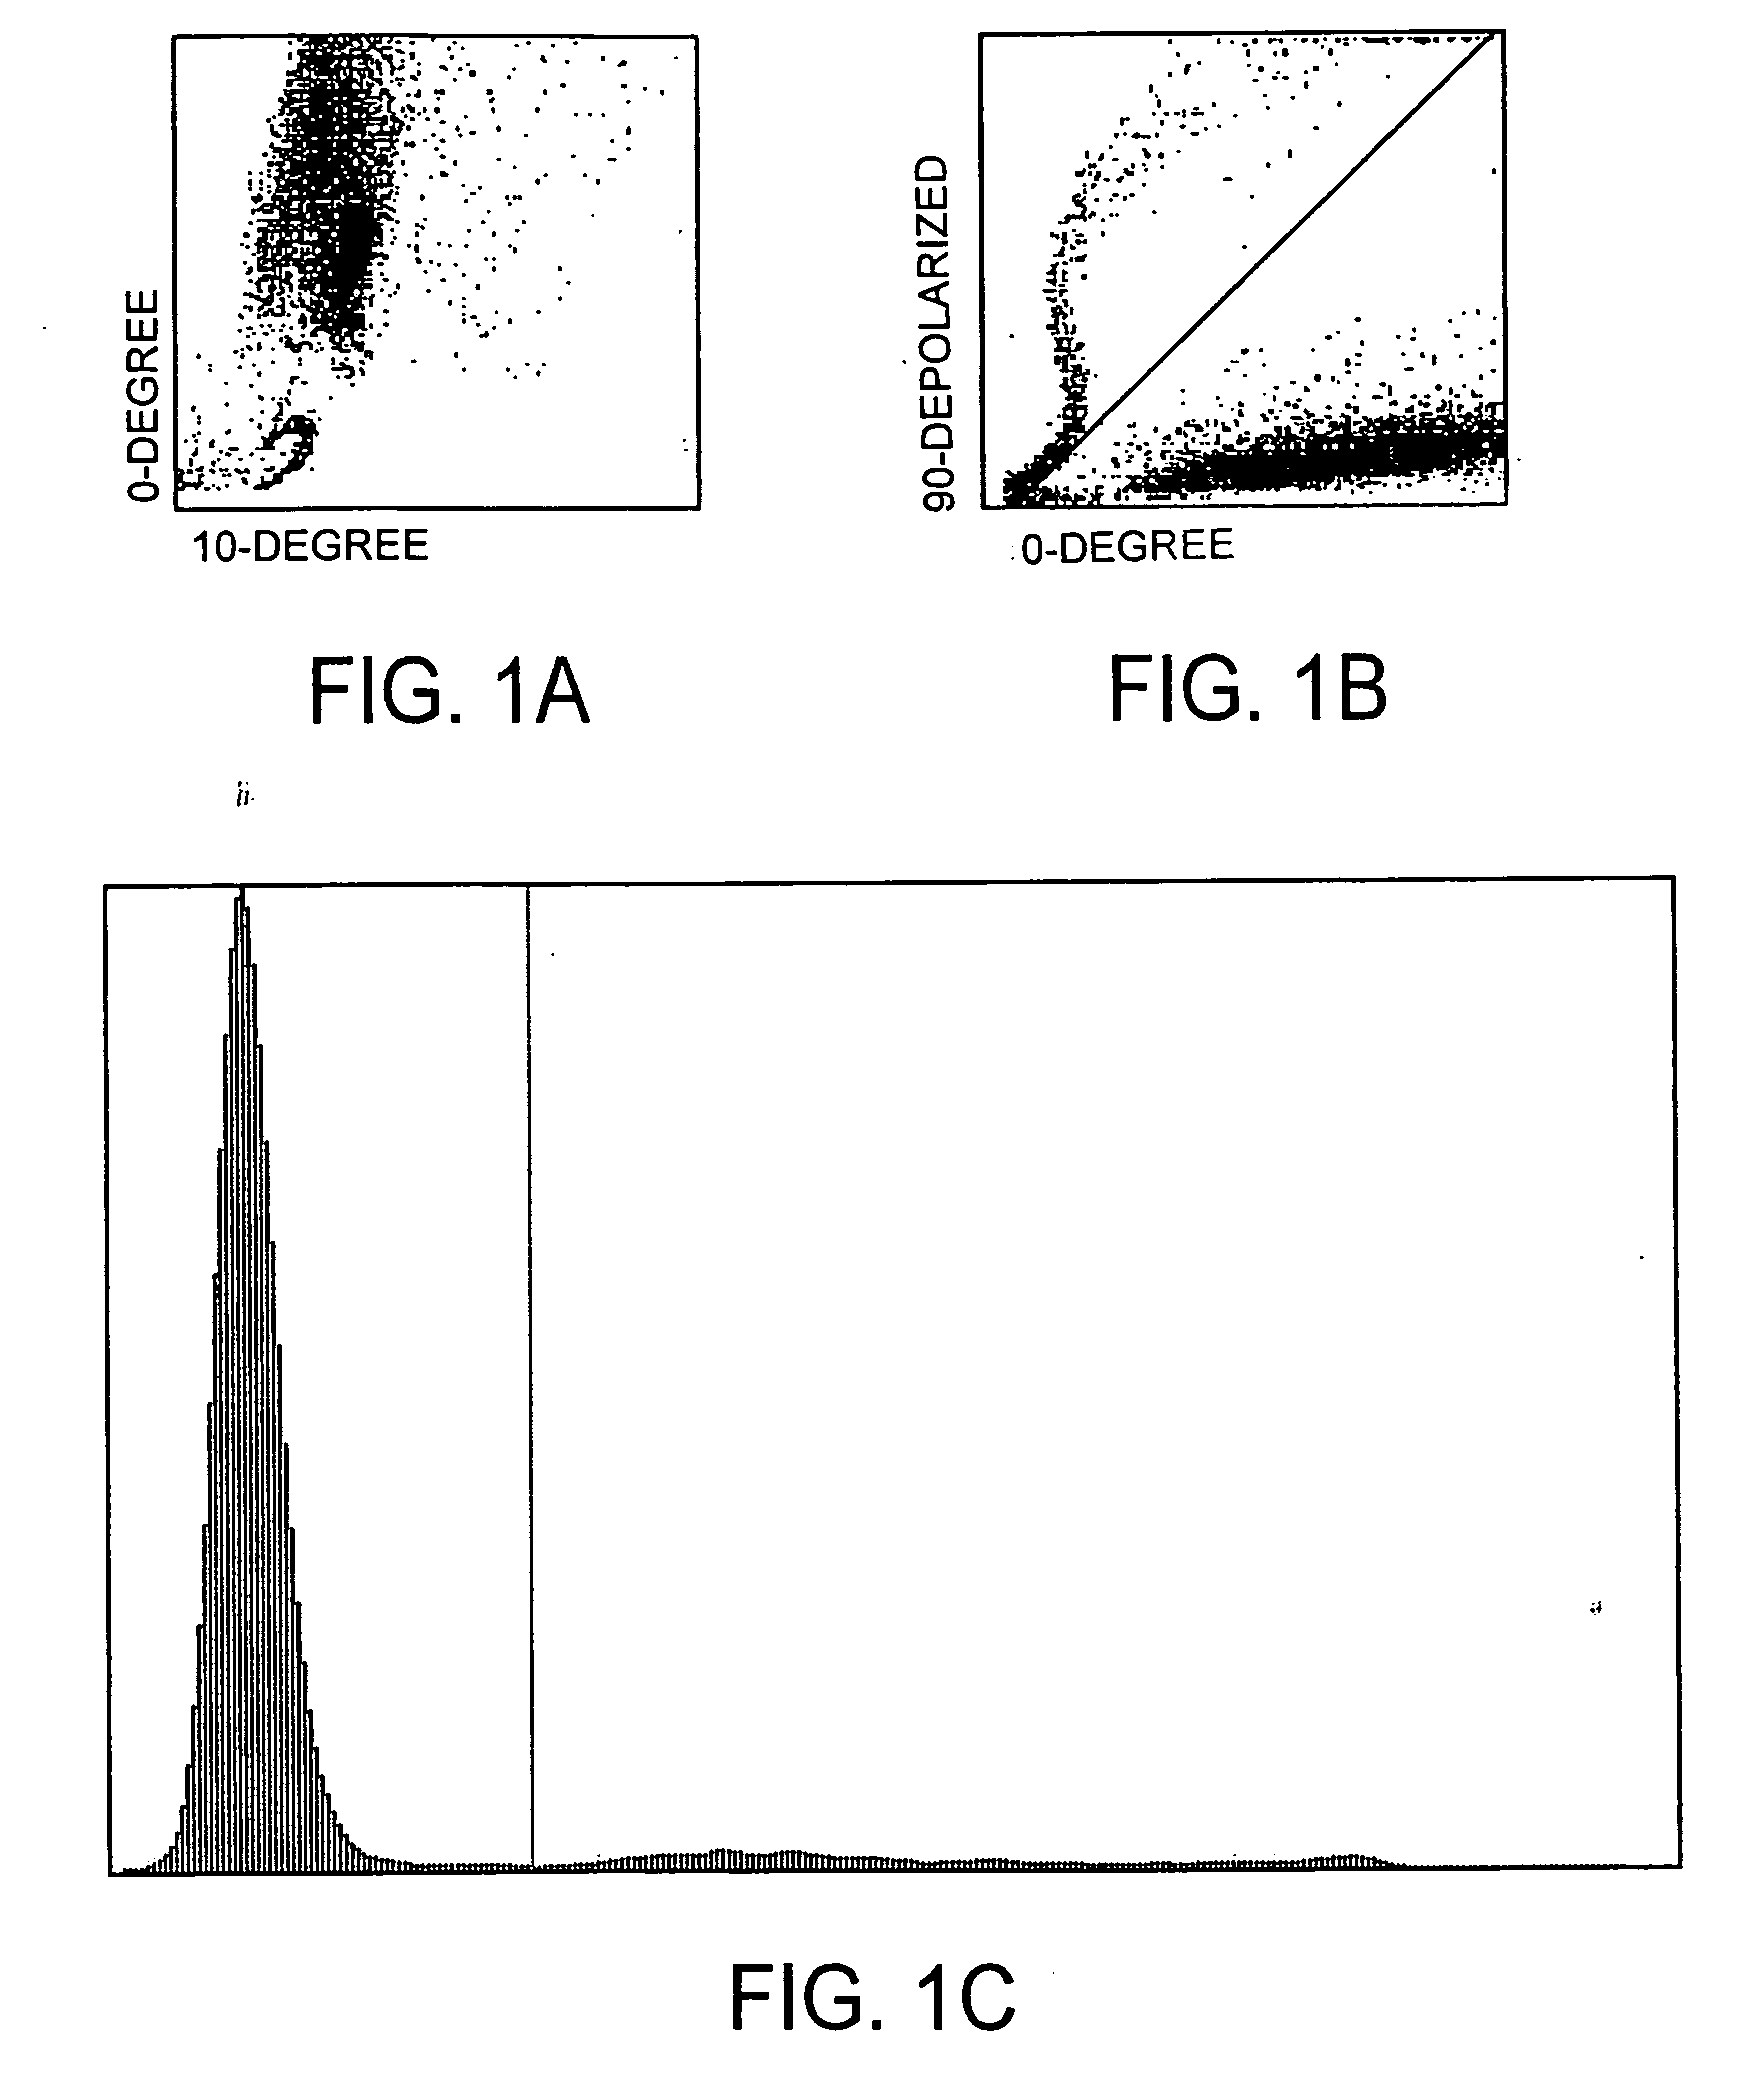
[0075]Referring now to FIGS. 1A, 1B, and 1C, with respect to the scatter plot depicting 90° depolarized light scatter versus 0° light scatter for removing depolarizing interference, it can be seen that depolarizing interference is removed because there is a discernible separation between the events above the diagonal line and the events below the diagonal line in FIG. 1B. For each of the scatter plots depicting 90° depolarized light scatter versus 0° light scatter, an imaginary line is drawn to each event from the point x=0, y=0. The angle between the imaginary line and the x-axis is determined for each event. The x-axis of the 0°, 90° depolarizing histogram is divided between the depolarizing events (e.g., lipid events) and the non-depolarizing events (e.g., white blood cell events, nucleated red blood cell events, platelet clump events, and other non-depolarizing substance events).

[0076]The 0°, 90° depolarized histogram for removing depolarizing interference shows a high frequency...

example 3

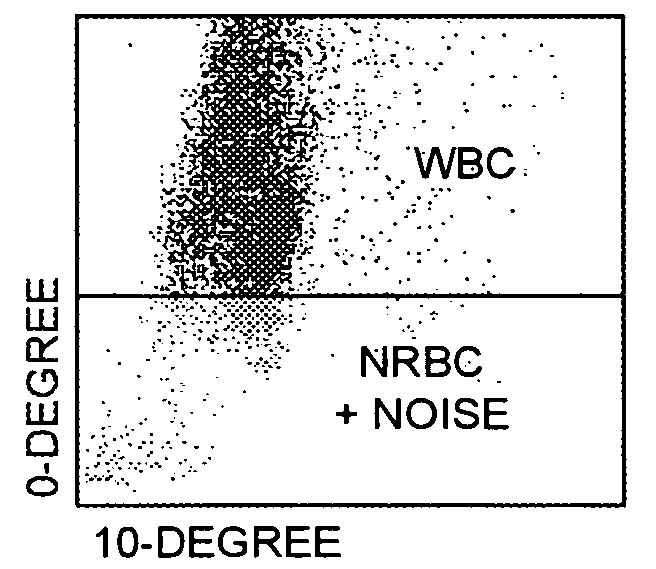
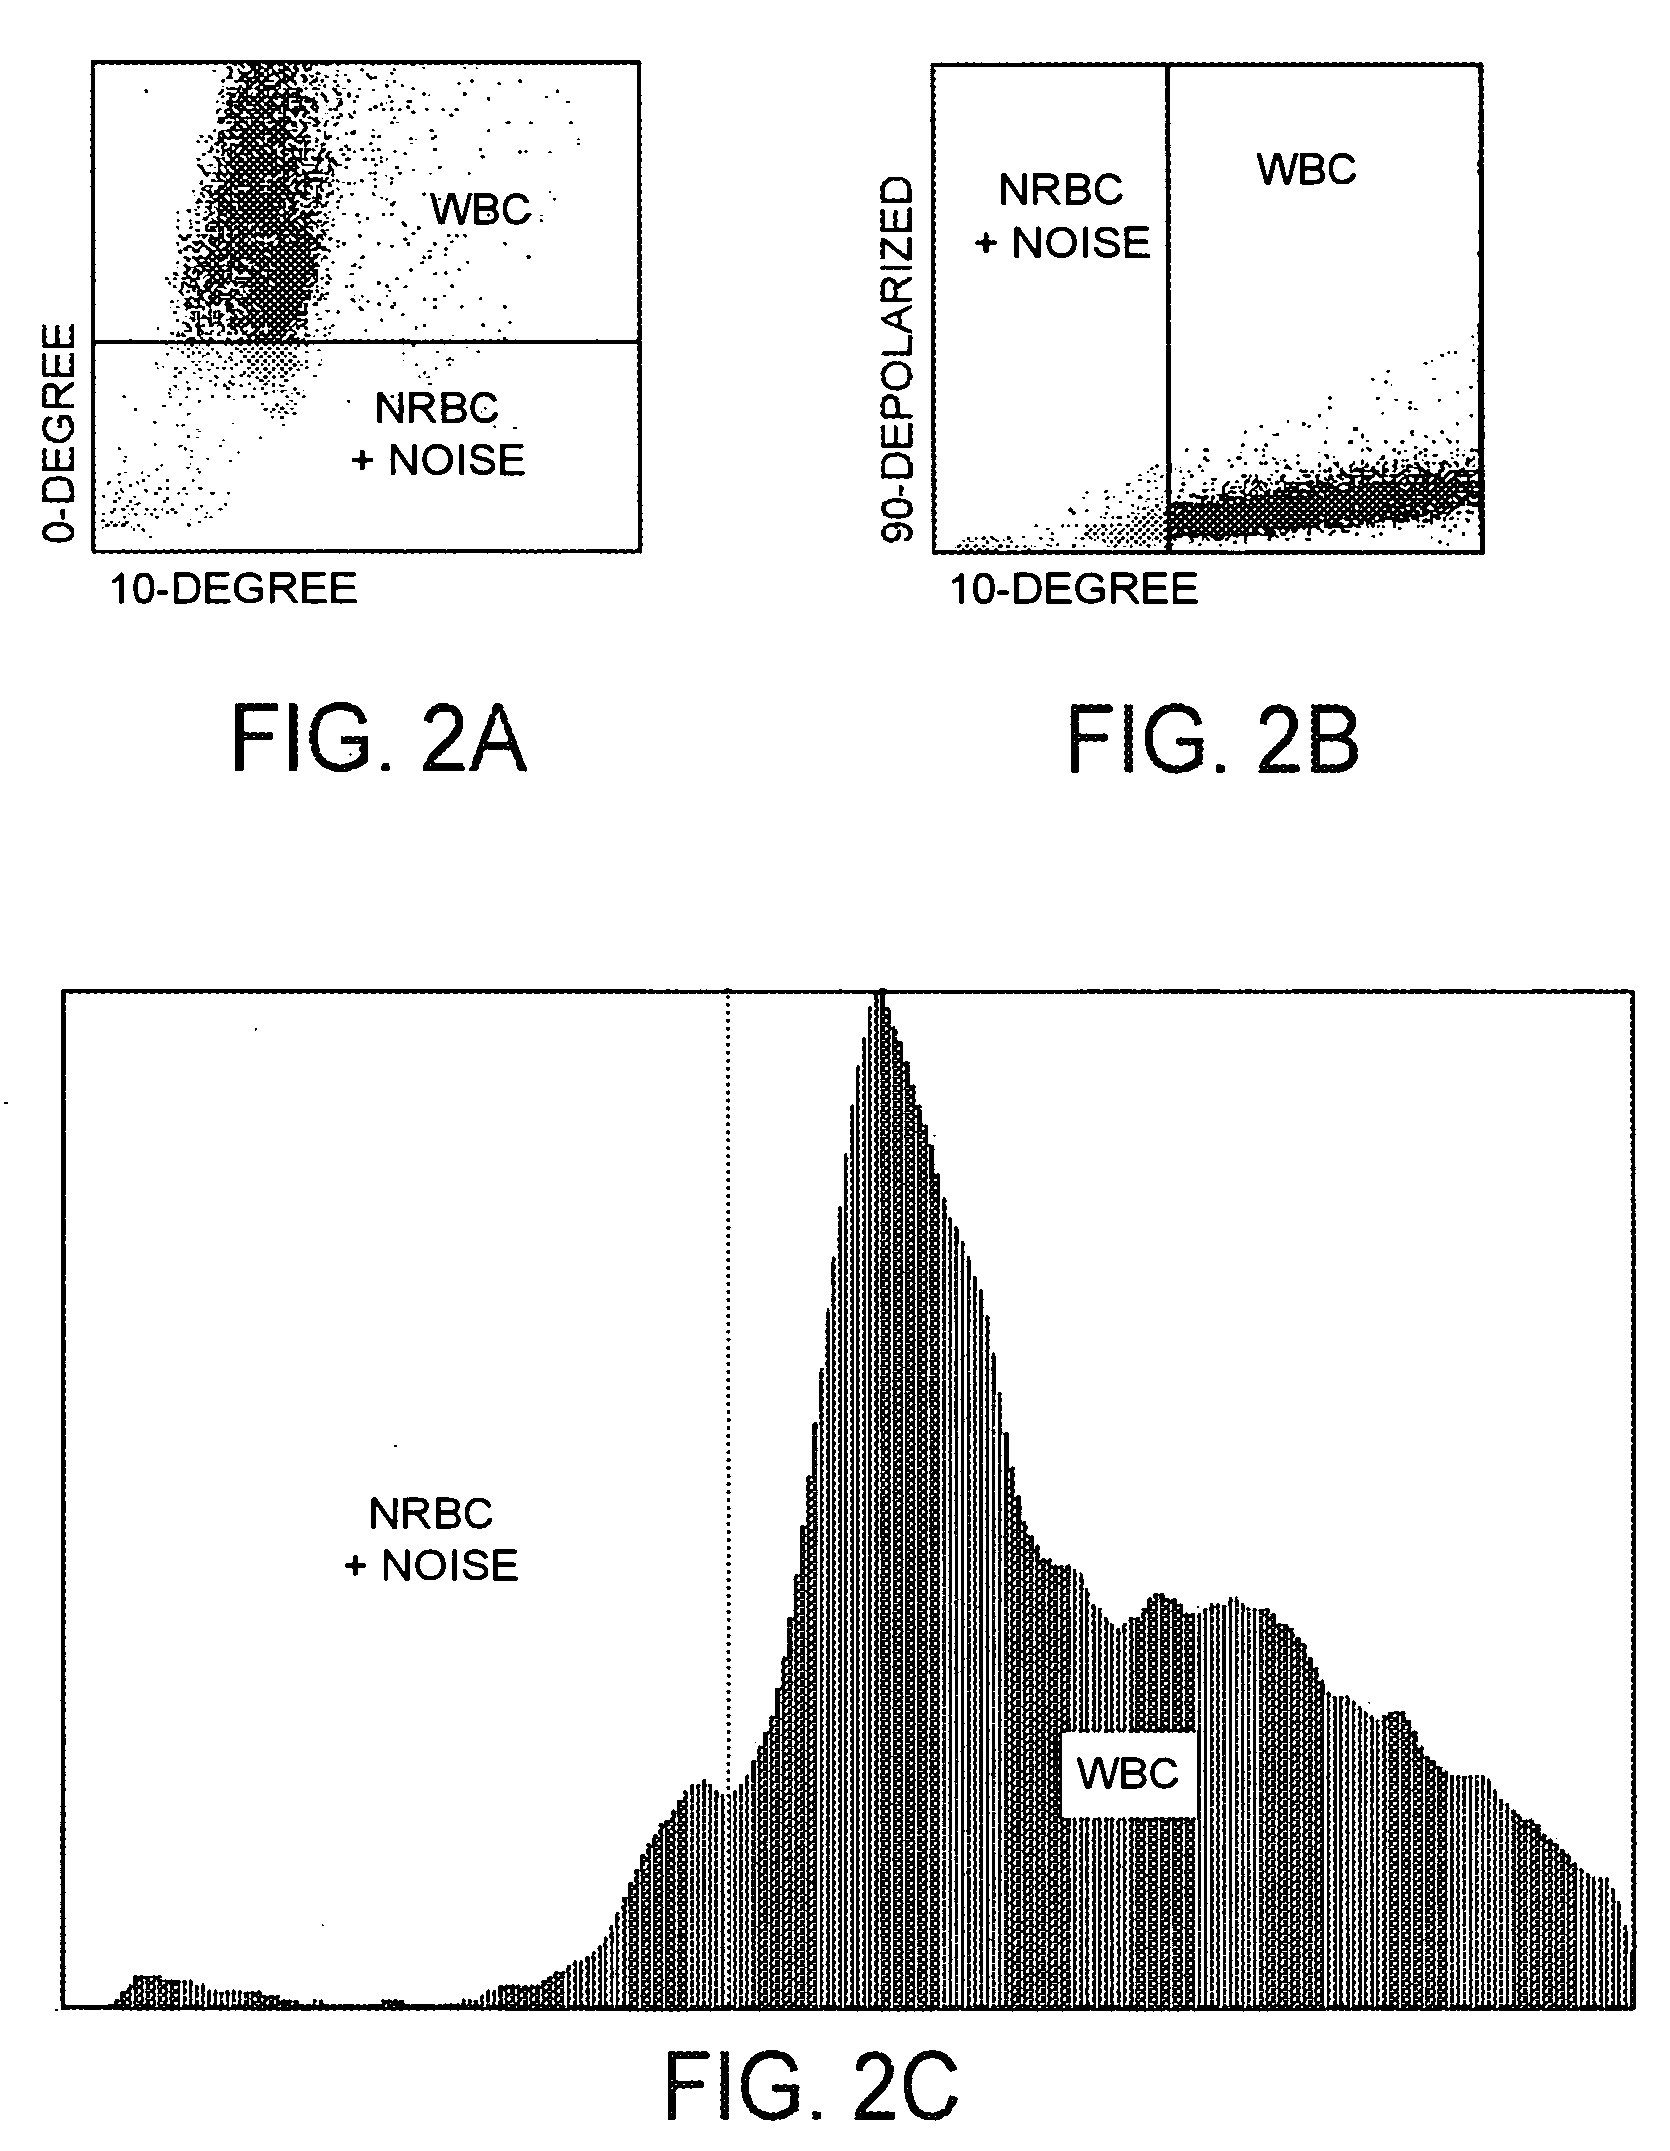
[0077]Referring now to FIGS. 2A, 2B, and 2C, with respect to the differentiation between white blood cells and the combination of nucleated red blood cell events plus noise, it can be seen that there is a high frequency of nucleated red blood cell events plus noise at the bottom of the scatter plot, below the horizontal line in FIG. 2A, depicting 0° light scatter versus 10° light scatter, and a high frequency of white blood cell events at the top of the scatter plot, above the horizontal line in FIG. 2A, depicting 0° light scatter versus 10° light scatter. It can also be seen that there is a high frequency of nucleated red blood cell events plus noise at the left side of the scatter plot, to the left of the vertical line in FIG. 2B, depicting 90° depolarized light scatter versus 0° light scatter, and a high frequency of white blood cell events at the right side of the scatter plot, to the right of the vertical line in FIG. 2B, depicting 90° depolarized light scatter versus 0° light ...


PUM

PropertyMeasurementUnit
osmolalityaaaaaaaaaa
concentrationaaaaaaaaaa
frequencyaaaaaaaaaa

Abstract

A method for enumerating white blood cells and nucleated red blood cells. The method comprises the steps of:
    • (b) providing a lysed sample of whole blood;
    • (b) introducing the lysed sample to a light-scattering multi-angle depolarizing flow cytometer;
    • (c) removing depolarizing interference, e.g., lipid droplets and other measured particles;
    • (d) differentiating nucleated red blood cells and noise from white blood cells in the absence of depolarizing interference;
    • (e) differentiating nucleated red blood cells from noise in the absence of depolarizing interference and white blood cells; and
    • (f) differentiating possible platelet clumps.

Description

BACKGROUND OF THE INVENTION[0001]1. Field of the Invention[0002]This invention relates to a method for the determination of leukocytes in samples of whole blood. More particularly, this invention relates to a method of distinguishing nucleated red blood cells from leukocytes, thereby enabling more accurate complete blood counts.[0003]2. Discussion of the Art[0004]One of the most important clinical results produced by an automated hematology analyzer is the concentration of white blood cells. Nucleated red blood cells tend to interfere with white blood cells, thereby causing the analyzer to either flag the white blood cell counting, thereby rendering the concentration of white blood cells not reportable, or including the nucleated red blood cells in the white blood cell count, thereby producing an inaccurate result. Specimens containing fragile white blood cells or specimens containing hypotonically resistant red blood cells present a problem for automated hematology analyzers. Fragi...

Claims


Application Information

Patent Timeline
Patent Type & Authority Applications(United States)
IPC IPC(8): G01N33/48
CPCG01N15/147G01N33/721G01N33/80G01N2015/0069G01N2015/0073G01N2015/008Y10T436/10G01N2015/1486G01N2015/1493Y10T436/107497Y10T436/101666Y10T436/25Y10T436/25125G01N2015/0084
Inventor GARRETT, DIANA G.LEE, HYEJUNG C.WONG, SHOW-CHUROEMER, BODOEDMONDSON, SHERB M.
Owner ABBOTT LAB INC
Why Eureka
Try Eureka