
Method for Calibrating an Analytical Instrument

a technology for calibrating and tuning analytical instruments, applied in the direction of instruments, tube calibration apparatus, material analysis, etc., can solve the problem of inadequate re-tuning, etc., and achieve the effect of minimizing differences

Inactive Publication Date: 2008-08-21
VERMILLION INC
View PDF37 Cites 36 Cited by
  • Summary
  • Abstract
  • Description
  • Claims
  • Application Information

AI Technical Summary

Benefits of technology

[0011]The present invention relates to methods for calibrating an instrument such as a spectrometer, comprising the steps of providing the location in n-dimensional space of a reference centroid derived from the quantity of one or more compounds in a reference sample (whether or not processed by the instrument); providing the location in n-dimensional space of a test centroid derived from the quantity of one or more compounds in a test sample processed by the instrument; computing a vector that reflects the distance between the reference centroid and test centroid, for example by using Euclidean distance; determining the extent to which an adjustment to one or more equipment settings would either decrease the distance between and / or improve the relative locations of the centroids or their acceptable decision boundaries (that is, if the distance is not Euclidean one may move further from the centroid yet be closer to the boundary as with an ellipsoid boundary); and effecting adjustments to the equipment settings to calibrate the instrument. To facilitate the process of adjusting the instrument settings to minimize the distance between the reference and test centroid, alternative two-dimensional representations of the centroids vs. the instrument tuning parameters might also be used; for example, one or more, normalized ratios of specific spectral peaks.
[0013]The present invention provides methods to calibrate an instrument in ways that enhance the reproducibility of the quantitative evaluation of samples performed by the instrument. Also contemplated are methods, software products, digital computers and analytical instruments in which the step of effecting adjustments is automated for the instrument, and, optionally, the user is provided with a report as to the types and extent of such adjustments. The present invention also provides methods, software products, processors, digital computers and instruments that provide to the instrument's operator recommendations or suggestions for appropriate adjustments to be effected on the instrument.
[0015]In one embodiment, multiple parameters can be adjusted to tune an instrument. Such an embodiment can include, for example, adjusting the instrument to baseline conditions, establishing reference profiles of compounds using the instrument, defining a reference response of the instrument, defining error tolerances, comparing a test response to the reference response, and minimizing differences by determining an adjustment or multiple adjustments to the parameters based on the reference profiles, reference response, test response and / or test profiles.

Problems solved by technology

For example, variances that result from acceptable manufacturing tolerances may produce instruments that are sufficiently different in their performance characteristics that re-tuning will not be adequate.

Method used


Image

  • Method for Calibrating an Analytical Instrument
  • Method for Calibrating an Analytical Instrument
  • Method for Calibrating an Analytical Instrument

Examples


example 1

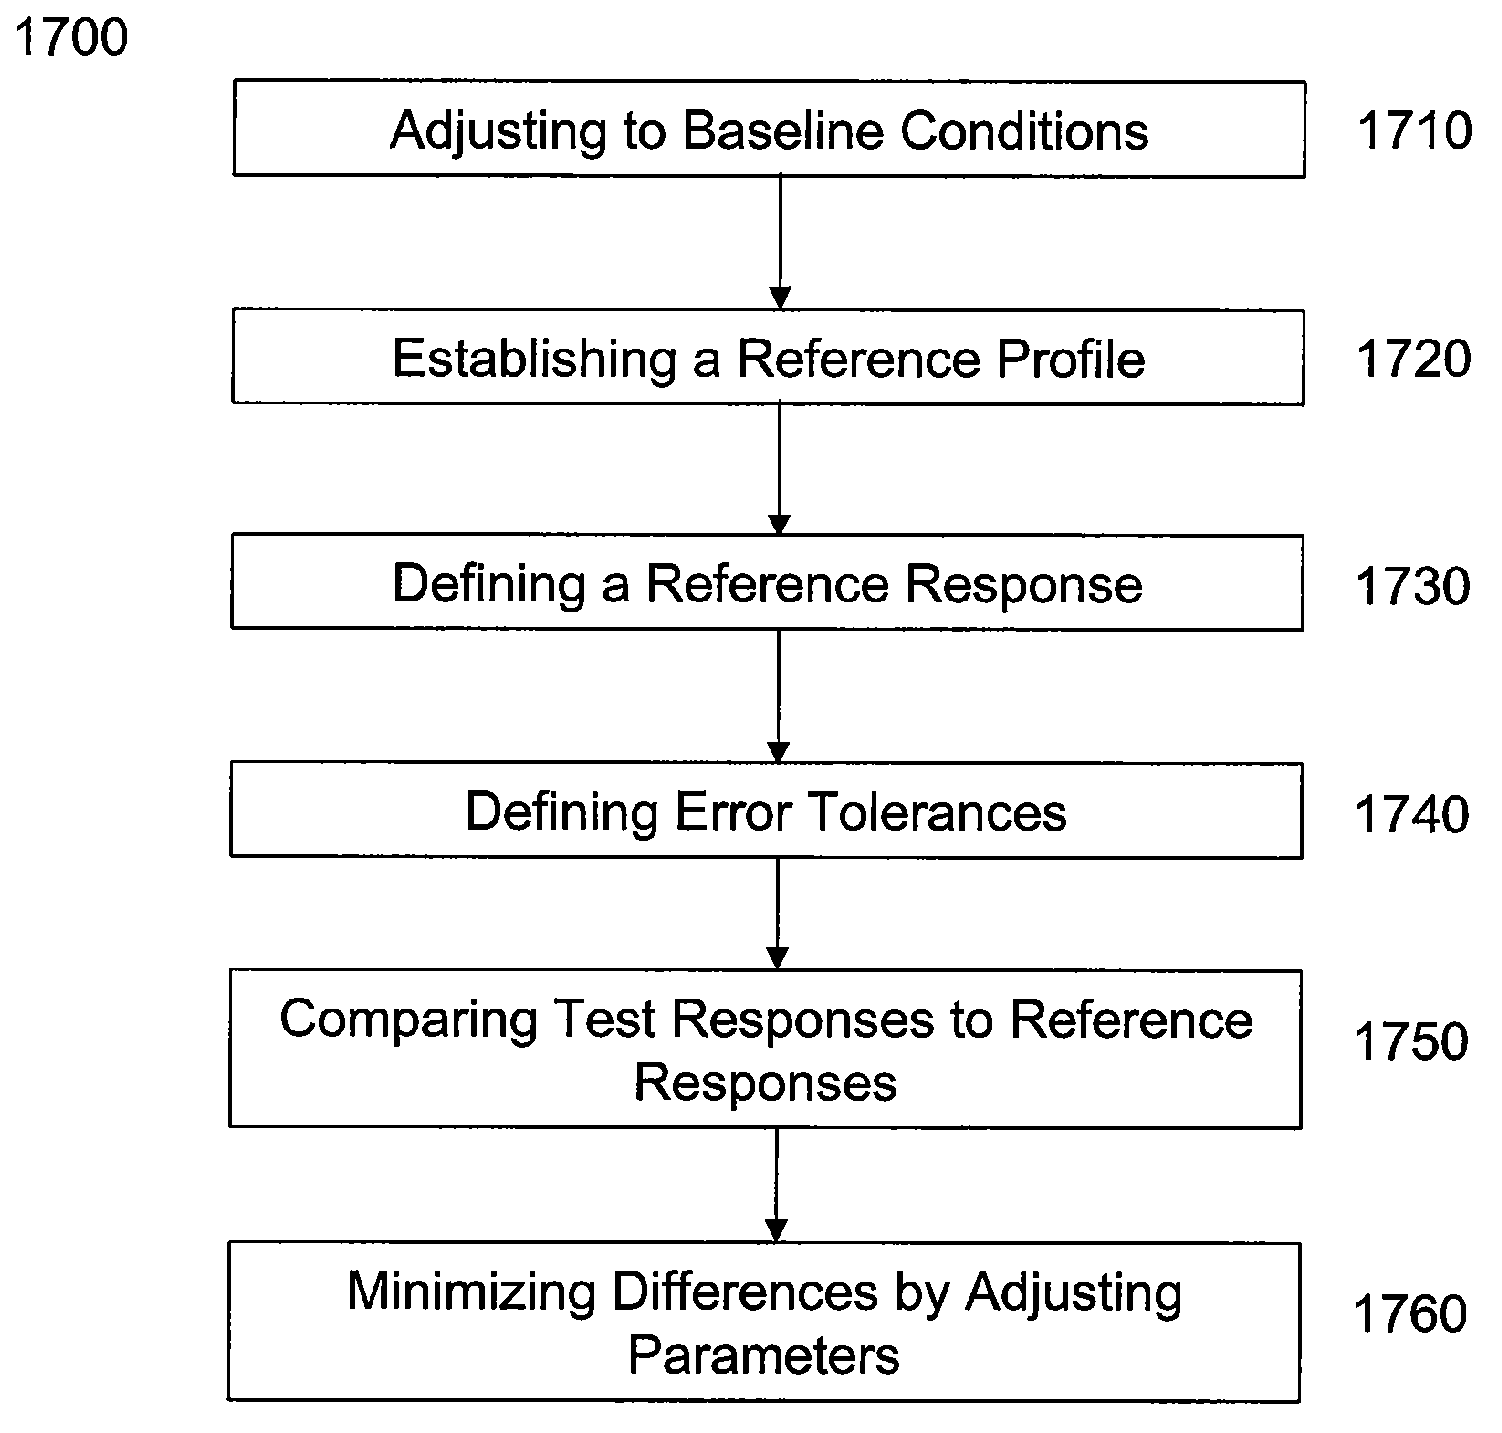
Needle Position Adjustments

[0074]The height of the needle in an AccuTOF mass spectrometer was changed in step-wise manner by turning the needle height knob. As shown in FIG. 1, different positions of the needle resulted in changes in the height (intensity) of various peaks found at the indicated m / z values. In performing this experiment, NO-0 is a setting as low as the needle can go, NO-3 is 3 complete turns of the adjustment, NO-6 is 6 complete turns up from NO-0, NO-9 is 9 complete turns up from NO-0 and NO-12 is 12 complete turns up from NO-0—position. Three analyses of sample were made at each needle position; two repeat analyses were made at each of positions NO-0 and NO-12. We believe that analyses 16 and 17 (at setting NO-0) may have been set improperly or may reflect a time delay artifact. It was determined that the setting NO-12 might be the most internally reproducible setting for the needle height and also note that by adjusting the needle height, the signal intensity can...

example 2

Peaks Voltage Setting

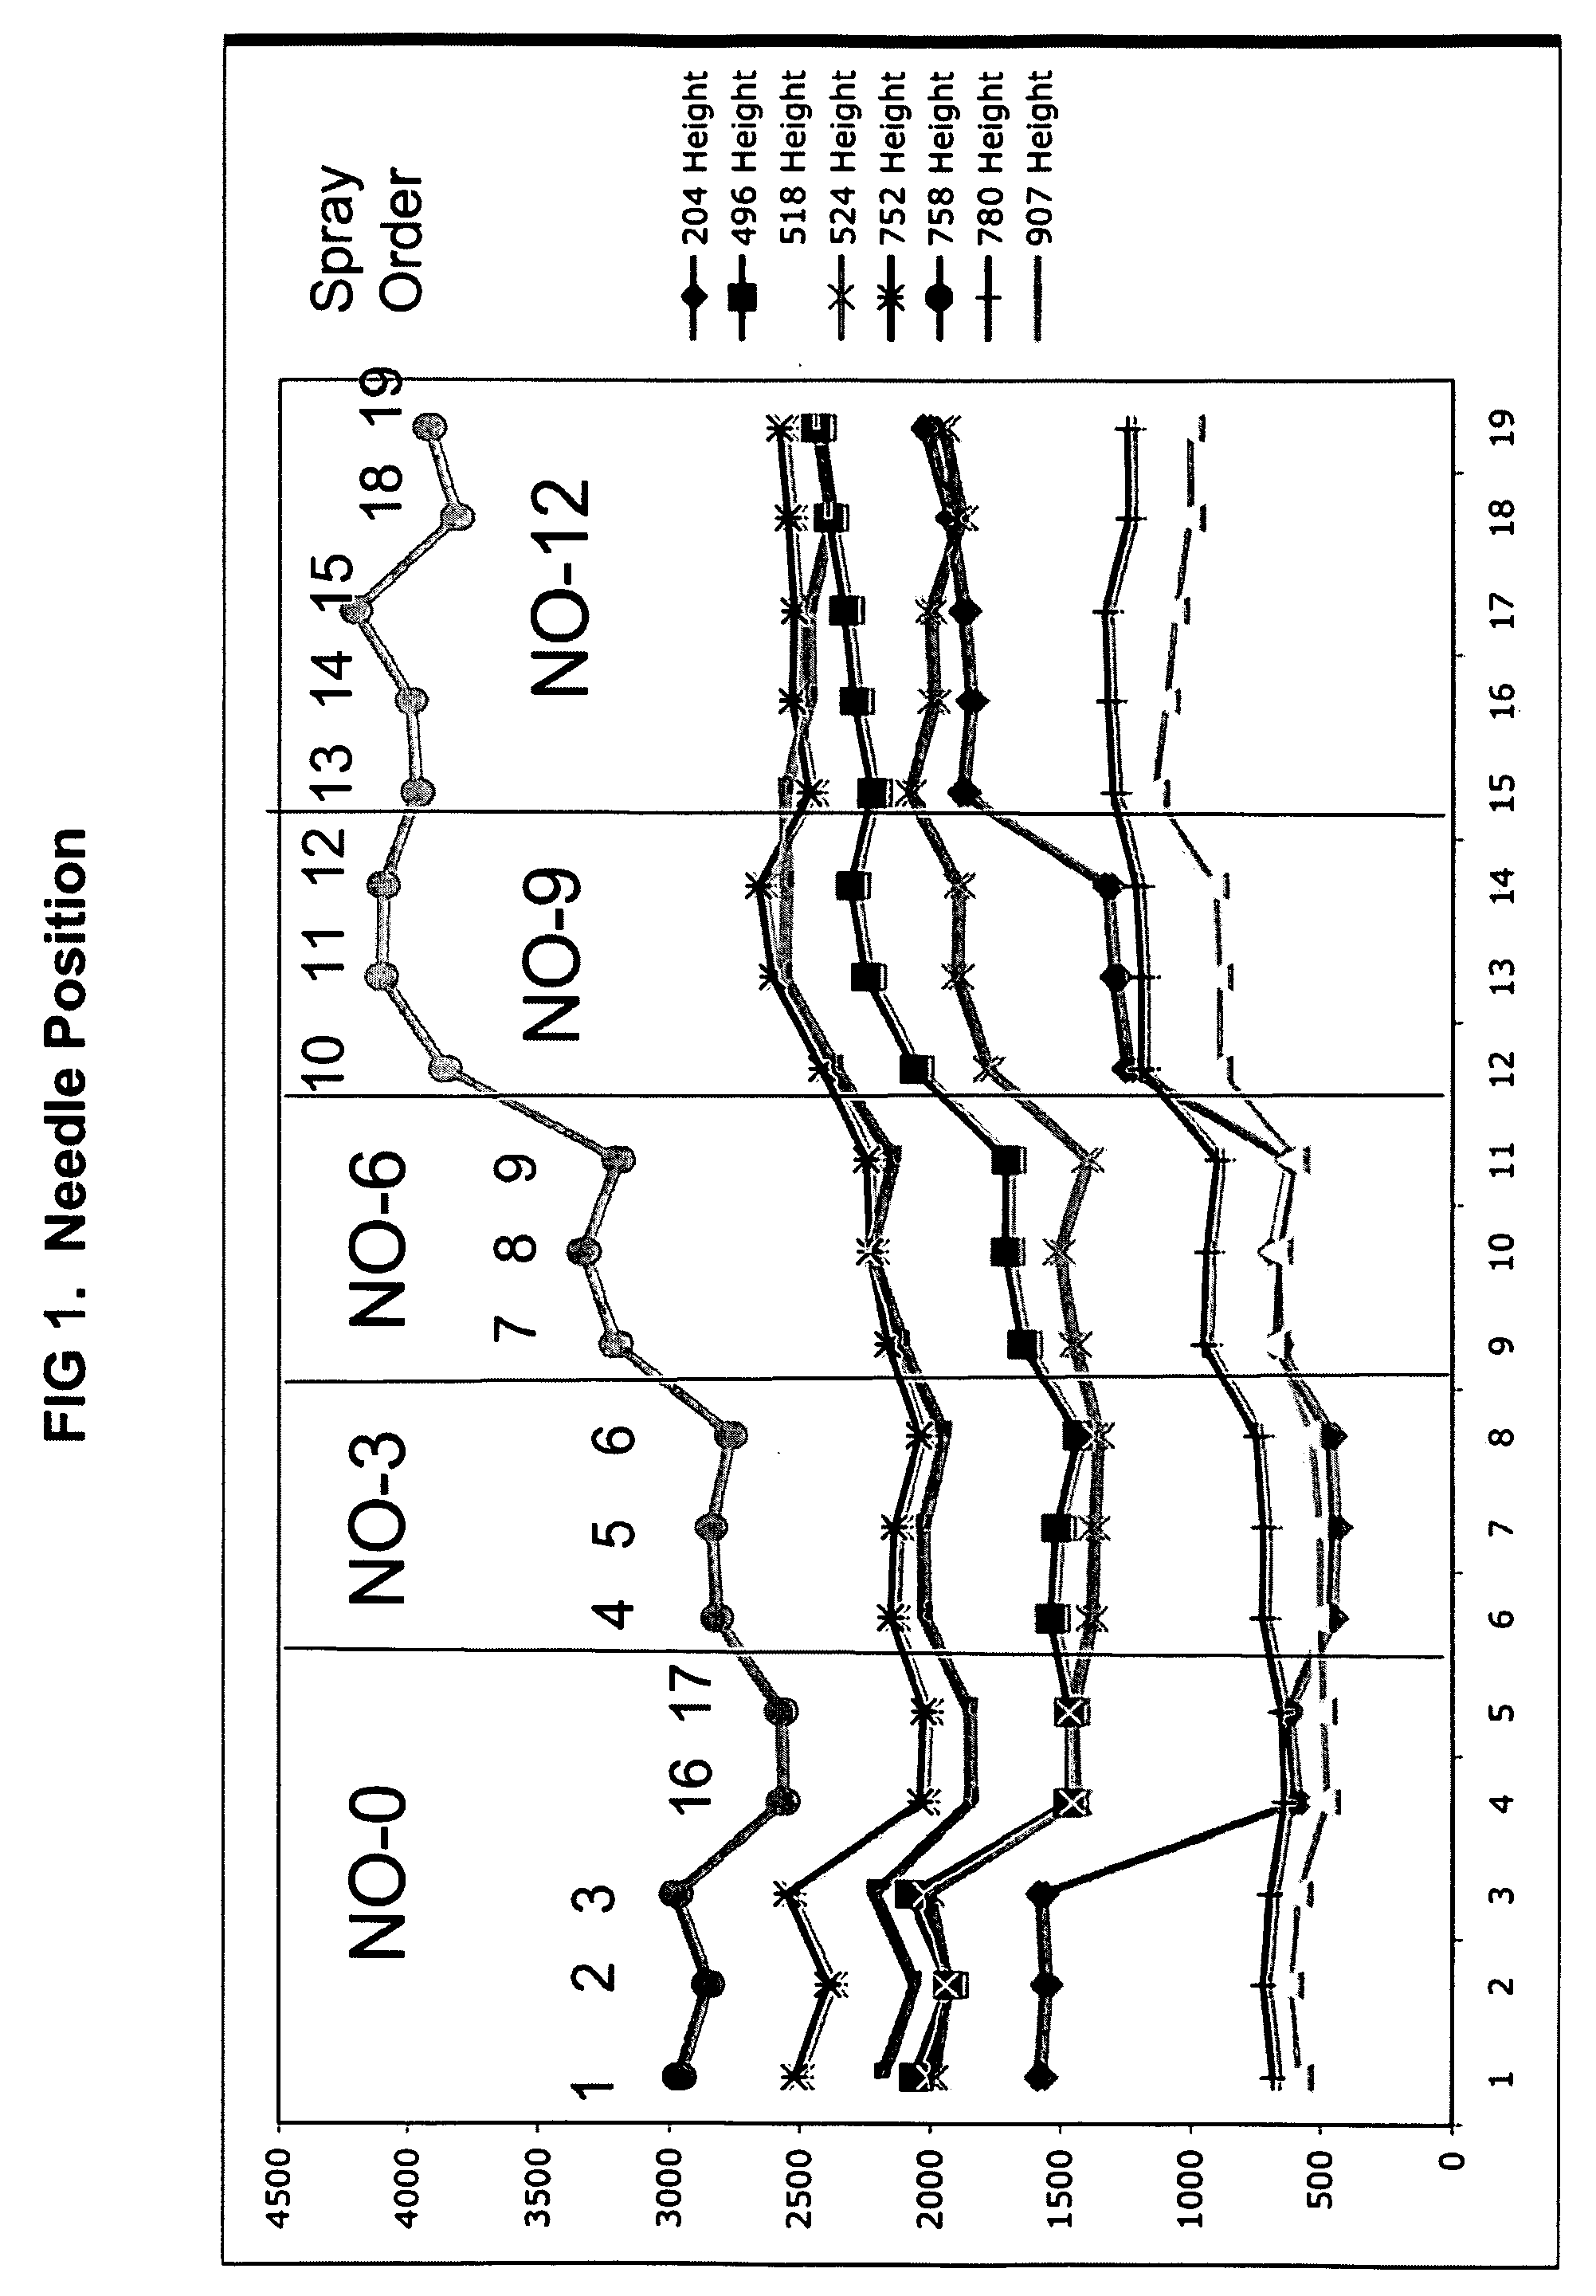
[0075]The RF Guide Voltage of the AccuTOF was adjusted in a stepwise manner at 100-volt increments through the range of 1,000 volts to 1,500 voltages. As shown in FIG. 2, for all analyses, the peak height, i.e., intensity remained fairly constant except for a possible periodicity seen for m / z values of 752 and 496. Decreasing Peaks voltage may have the effect of decreasing intensity somewhat for some m / z values.

example 3

Orifice 1 Voltage Adjustments

[0076]The Orifice 1 Voltage of the AccuTOF was adjusted in a stepwise manner at 5-volt increments through the range of 30 to 65 volts. This plot represents a spray sequence of a standard mixture of compounds. As shown in FIG. 3, intensity for some peaks tended to increase across this voltage range, to decrease for others and to hold fairly constant for some test compounds.


PUM


Abstract

Methods are provided for calibrating analytical instruments that comprise a quantitative device, such as spectrometers, particularly where a complex mixture is analyzed over a broad spectral range. Associated computer and analytical systems as well as software are also provided.

Description

CROSS-REFERENCE TO RELATED APPLICATIONS[0001]This application claims priority to U.S. Patent Application Ser. No. 60 / 900,729, filed on Feb. 12, 2007 and entitled “A Method for Calibrating a Spectrometer,” and to U.S. Patent Application Ser. No. 60 / 960,995, filed on Oct. 24, 2007 and entitled “A Method for Calibrating a Spectrometer,” both of which are incorporated in their entirety herein by reference.FIELD OF THE INVENTION[0002]This invention provides methods for calibrating or tuning analytical instruments that comprise a quantitative device, such as spectrometers and scanners, particularly where data derived from a complex mixture is analyzed, for example over a broad measurement range.BACKGROUND[0003]It is a recognized problem in many fields of analysis that the intensity of a given signal reported by an instrument's detector might vary over time or vary from instrument to instrument as a function of various electronic, mechanical, physical and environmental factors. Relatively ...

Claims


Application Information

Patent Timeline
IPC IPC(8): G01D18/00
CPCH01J49/0009G01N21/274
Inventor YIP, PING F.MANSFIELD, BRIAN C.PELTIER, JOHN M.LECCHI, PAOLOBERTENSHAW, GREG P.WIGGINS, WESLEY S.
Owner VERMILLION INC
Learn More