Method of Displaying Elastic Image and Diagnostic Ultrasound System

a diagnostic ultrasound and elastic image technology, applied in the field of elastic image and diagnostic ultrasound system, can solve the problems of difficult objective determination by an examiner, image becomes non-uniform, and different diagnostic results depending on the examiner's opinion

Active Publication Date: 2008-10-30
FUJIFILM HEALTHCARE CORP
View PDF7 Cites 108 Cited by
  • Summary
  • Abstract
  • Description
  • Claims
  • Application Information

AI Technical Summary

Benefits of technology

[0023]The control means can automatically set the start point and end point of one cycle of pressure change. In this way, the beginning and the end of a period in which compression is carrie

Problems solved by technology

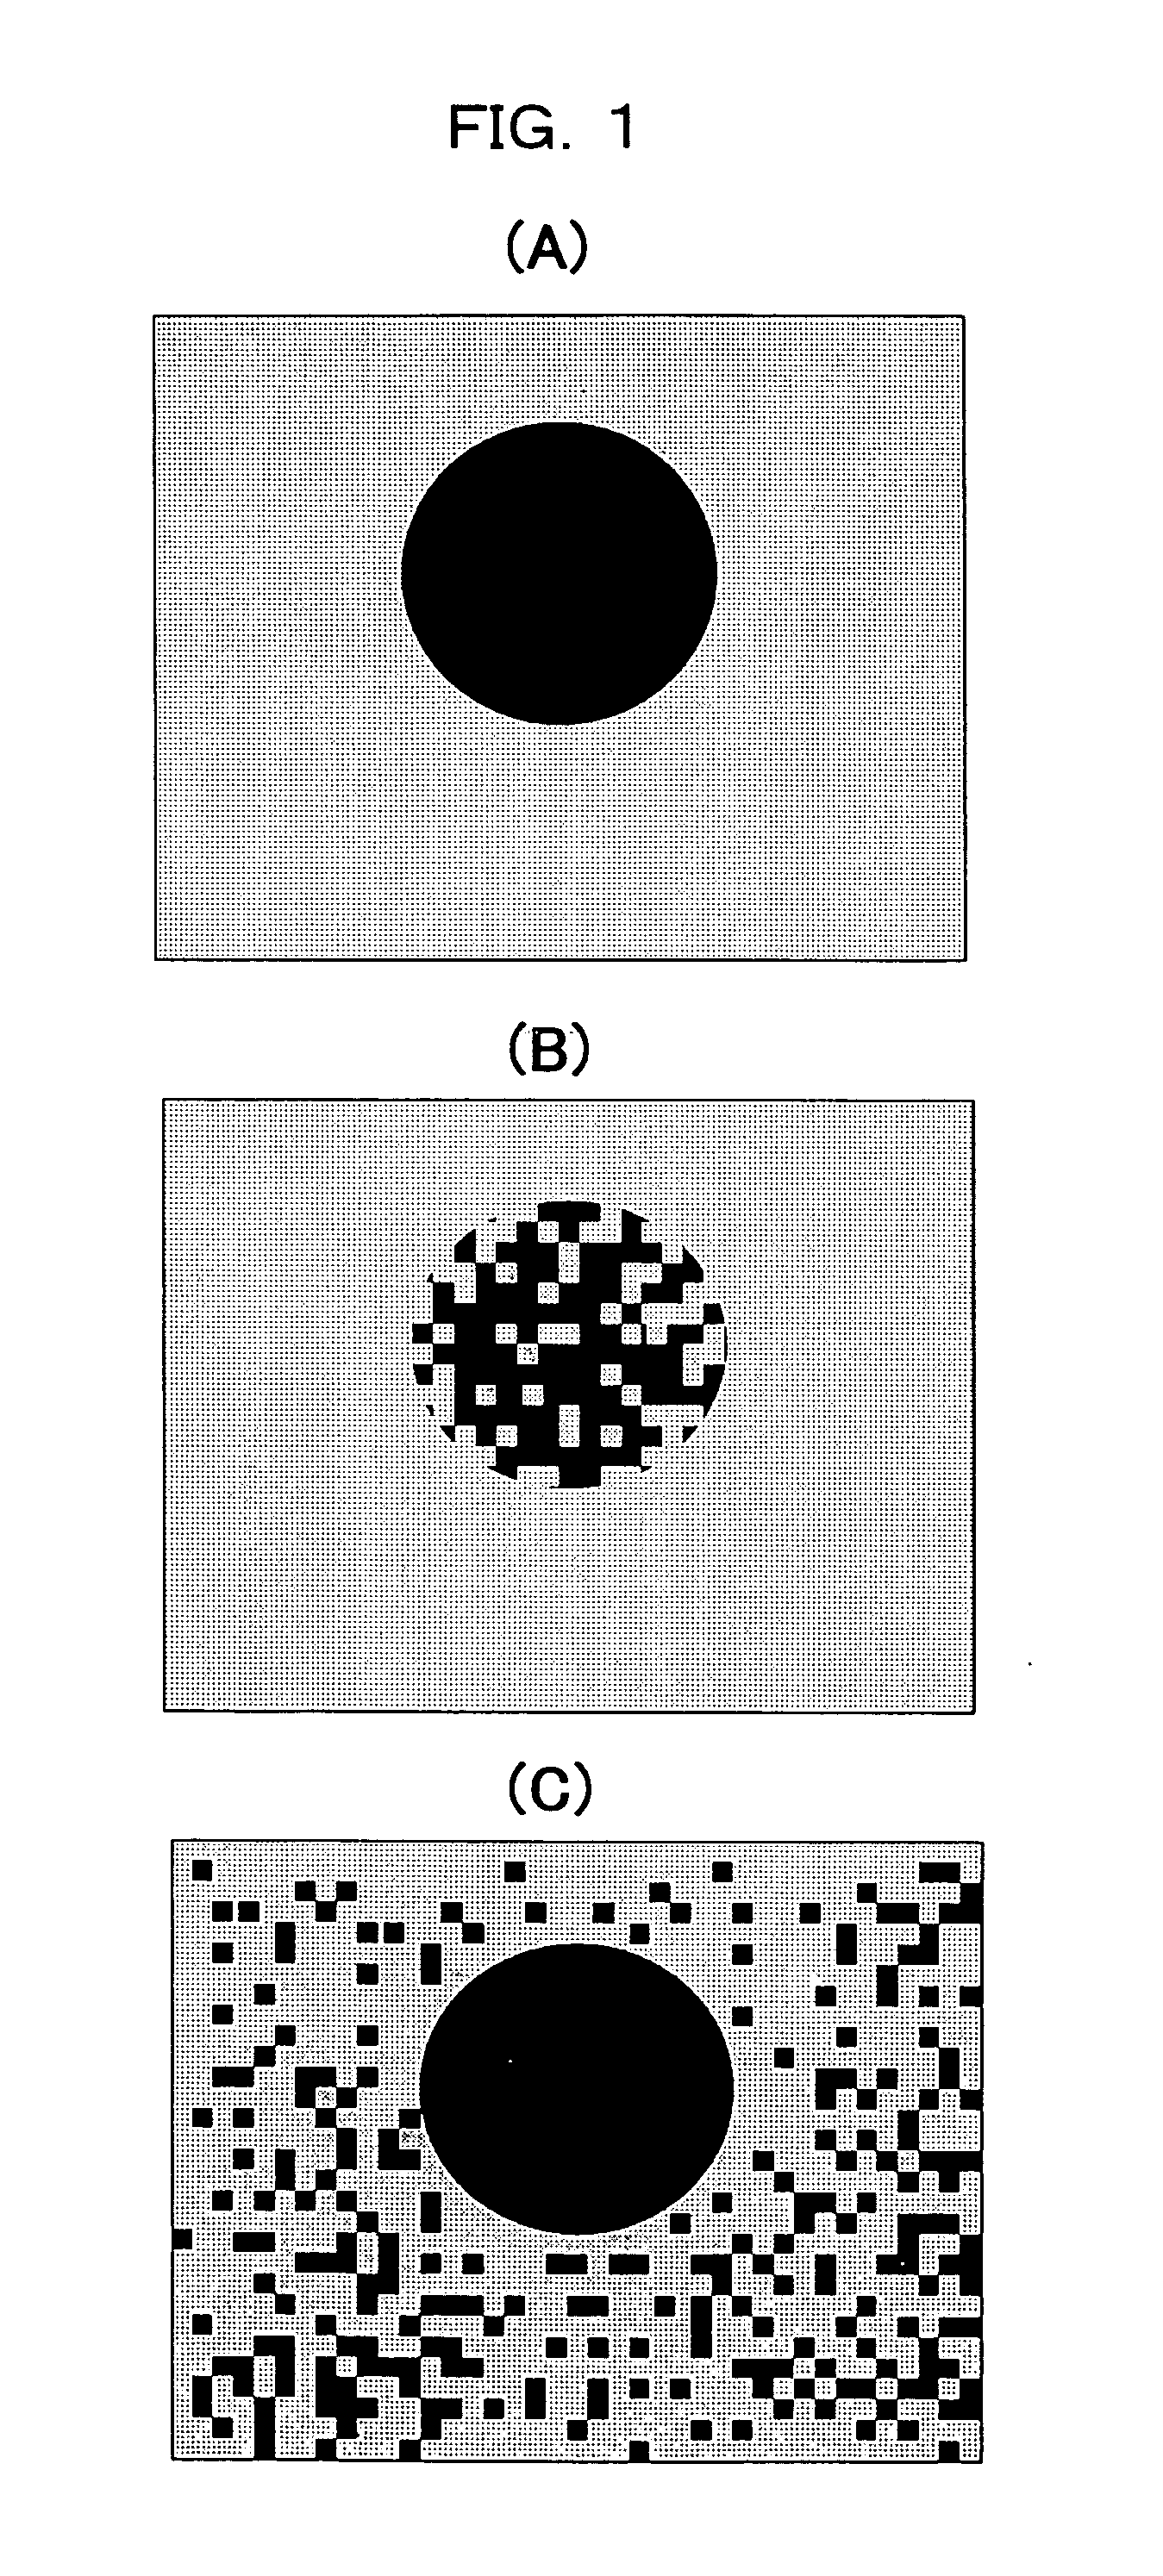
Since sufficient stress is not applied to the body tissue, points of zero distortion (areas that are recognized as being hard) are scattered through out the region that is uniformly soft, and the image becomes non-uniform.
However, conventionally, it has been difficult for an examiner to objectively determine whether elastic information recognizable from an elastic image of a region of interest differed depending on the compression condition because there has not been any consideration

Method used


Image

  • Method of Displaying Elastic Image and Diagnostic Ultrasound System
  • Method of Displaying Elastic Image and Diagnostic Ultrasound System
  • Method of Displaying Elastic Image and Diagnostic Ultrasound System

Examples


first embodiment

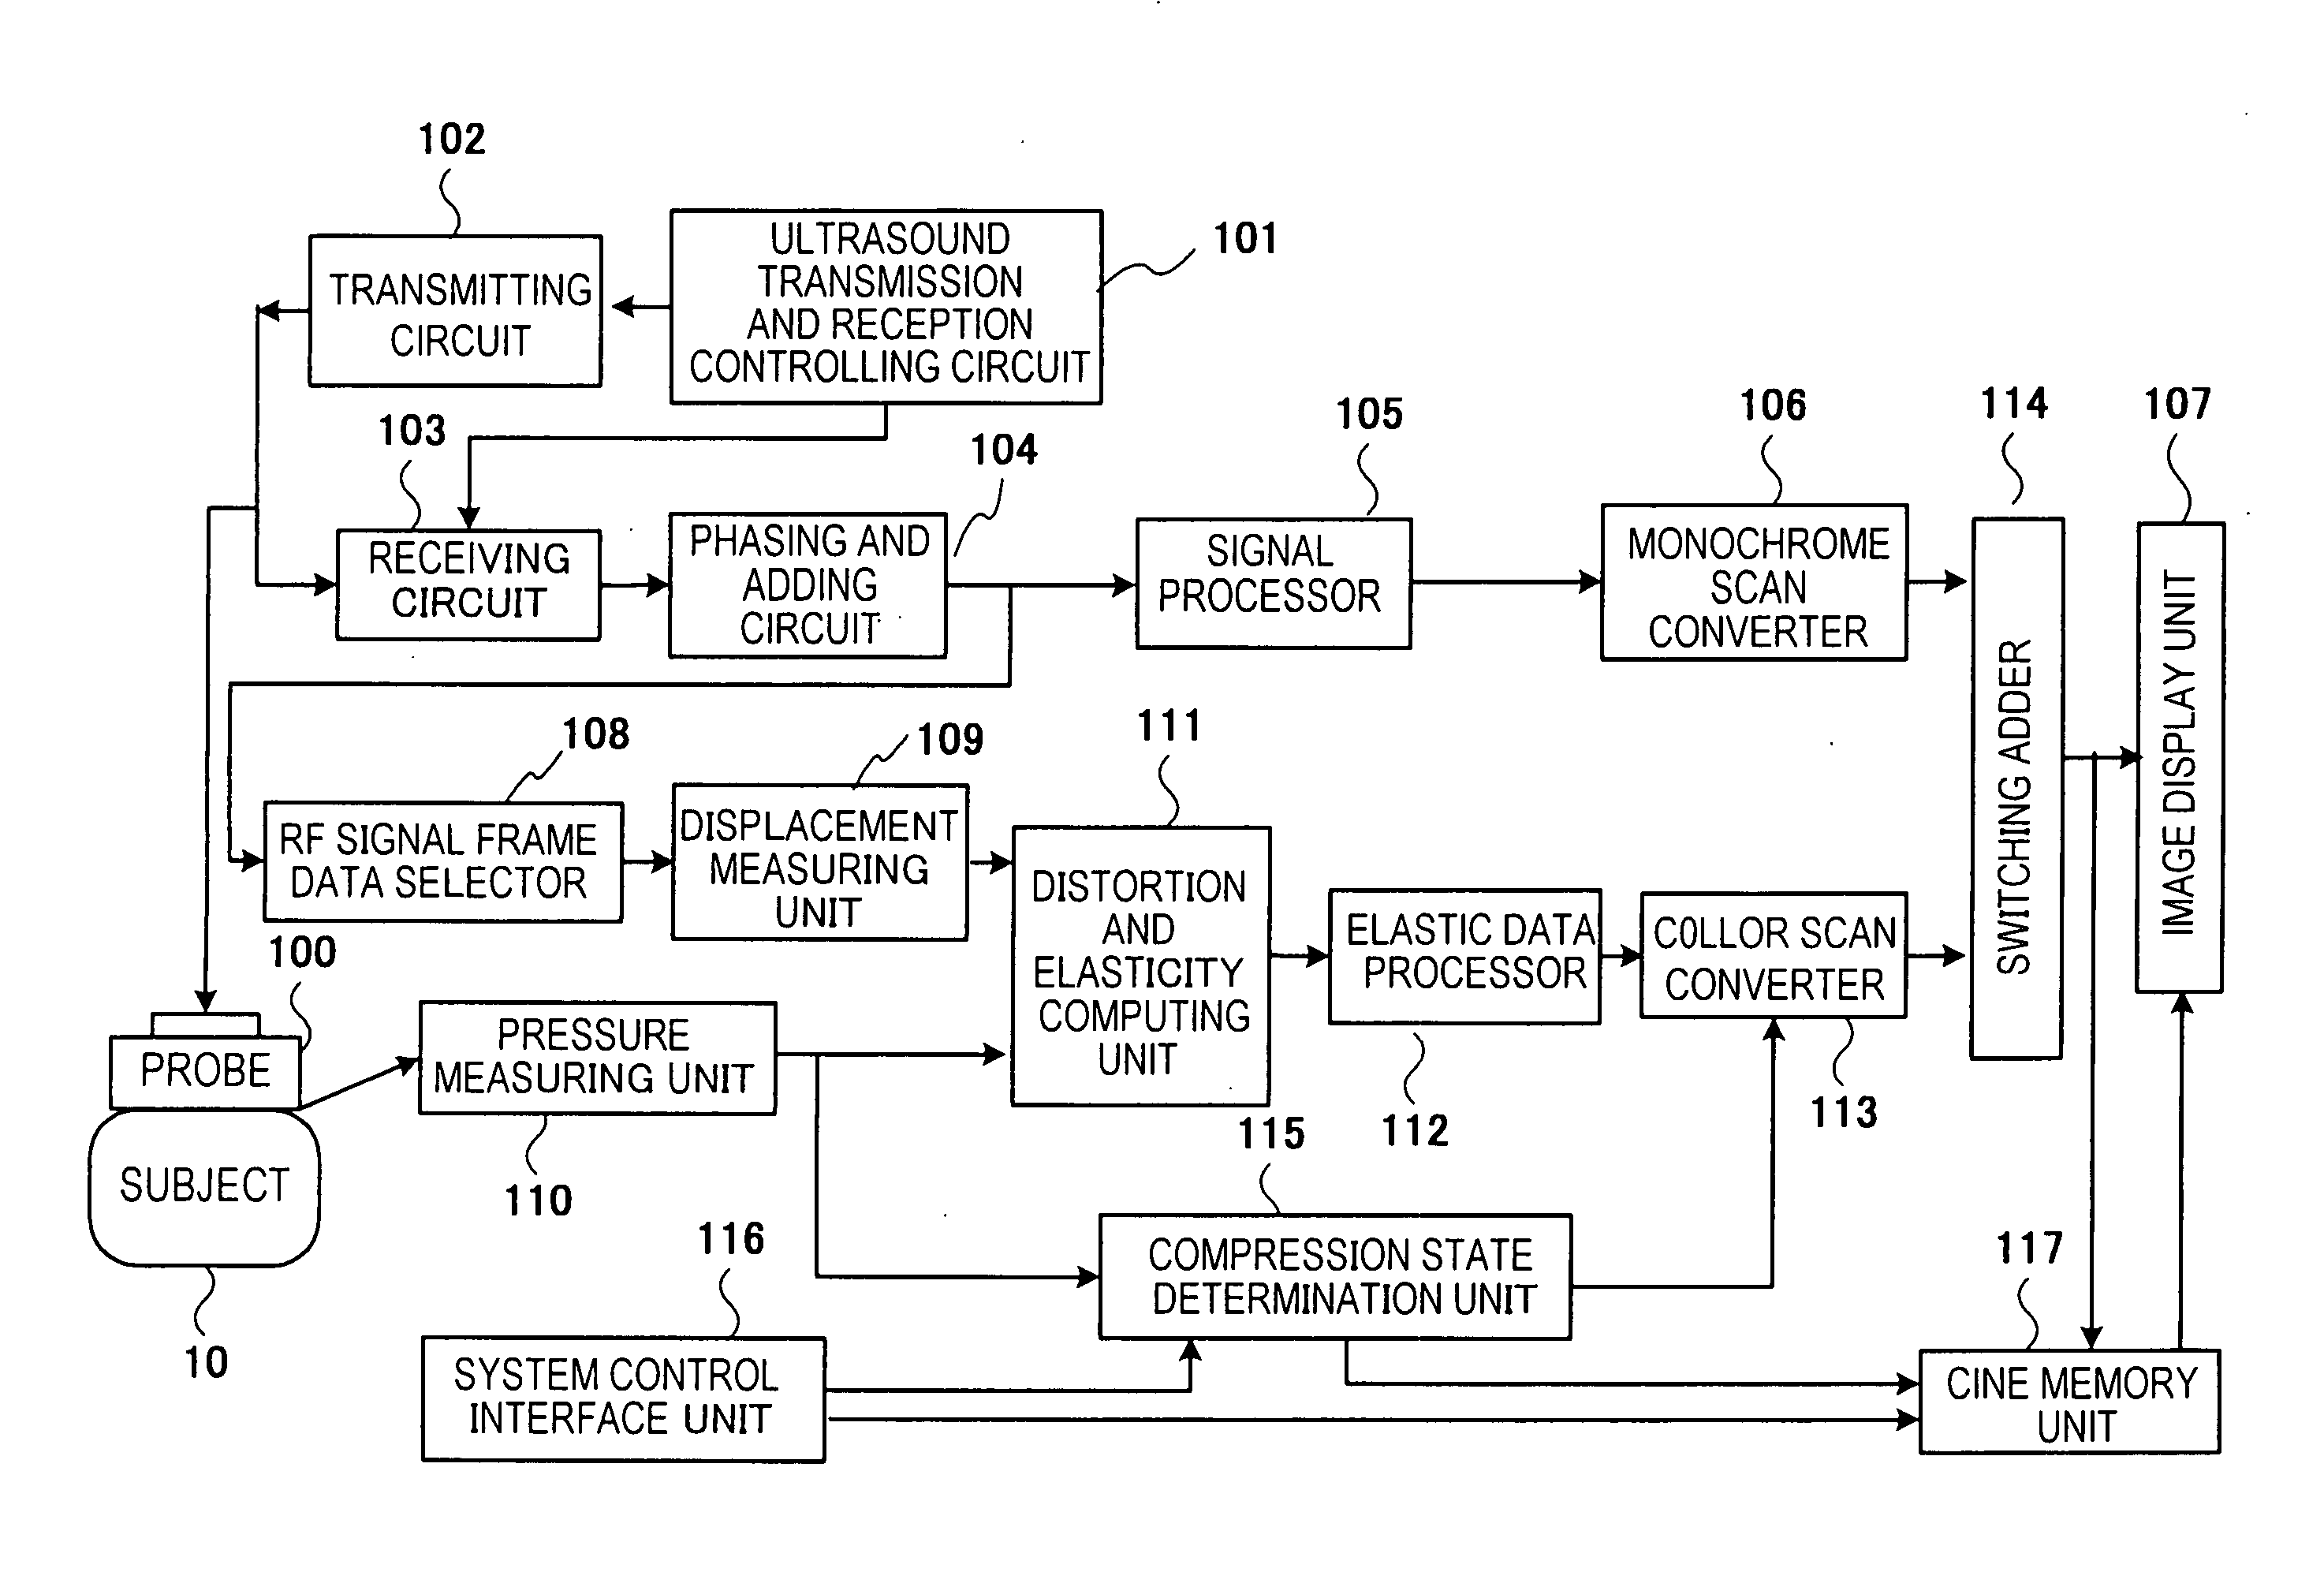
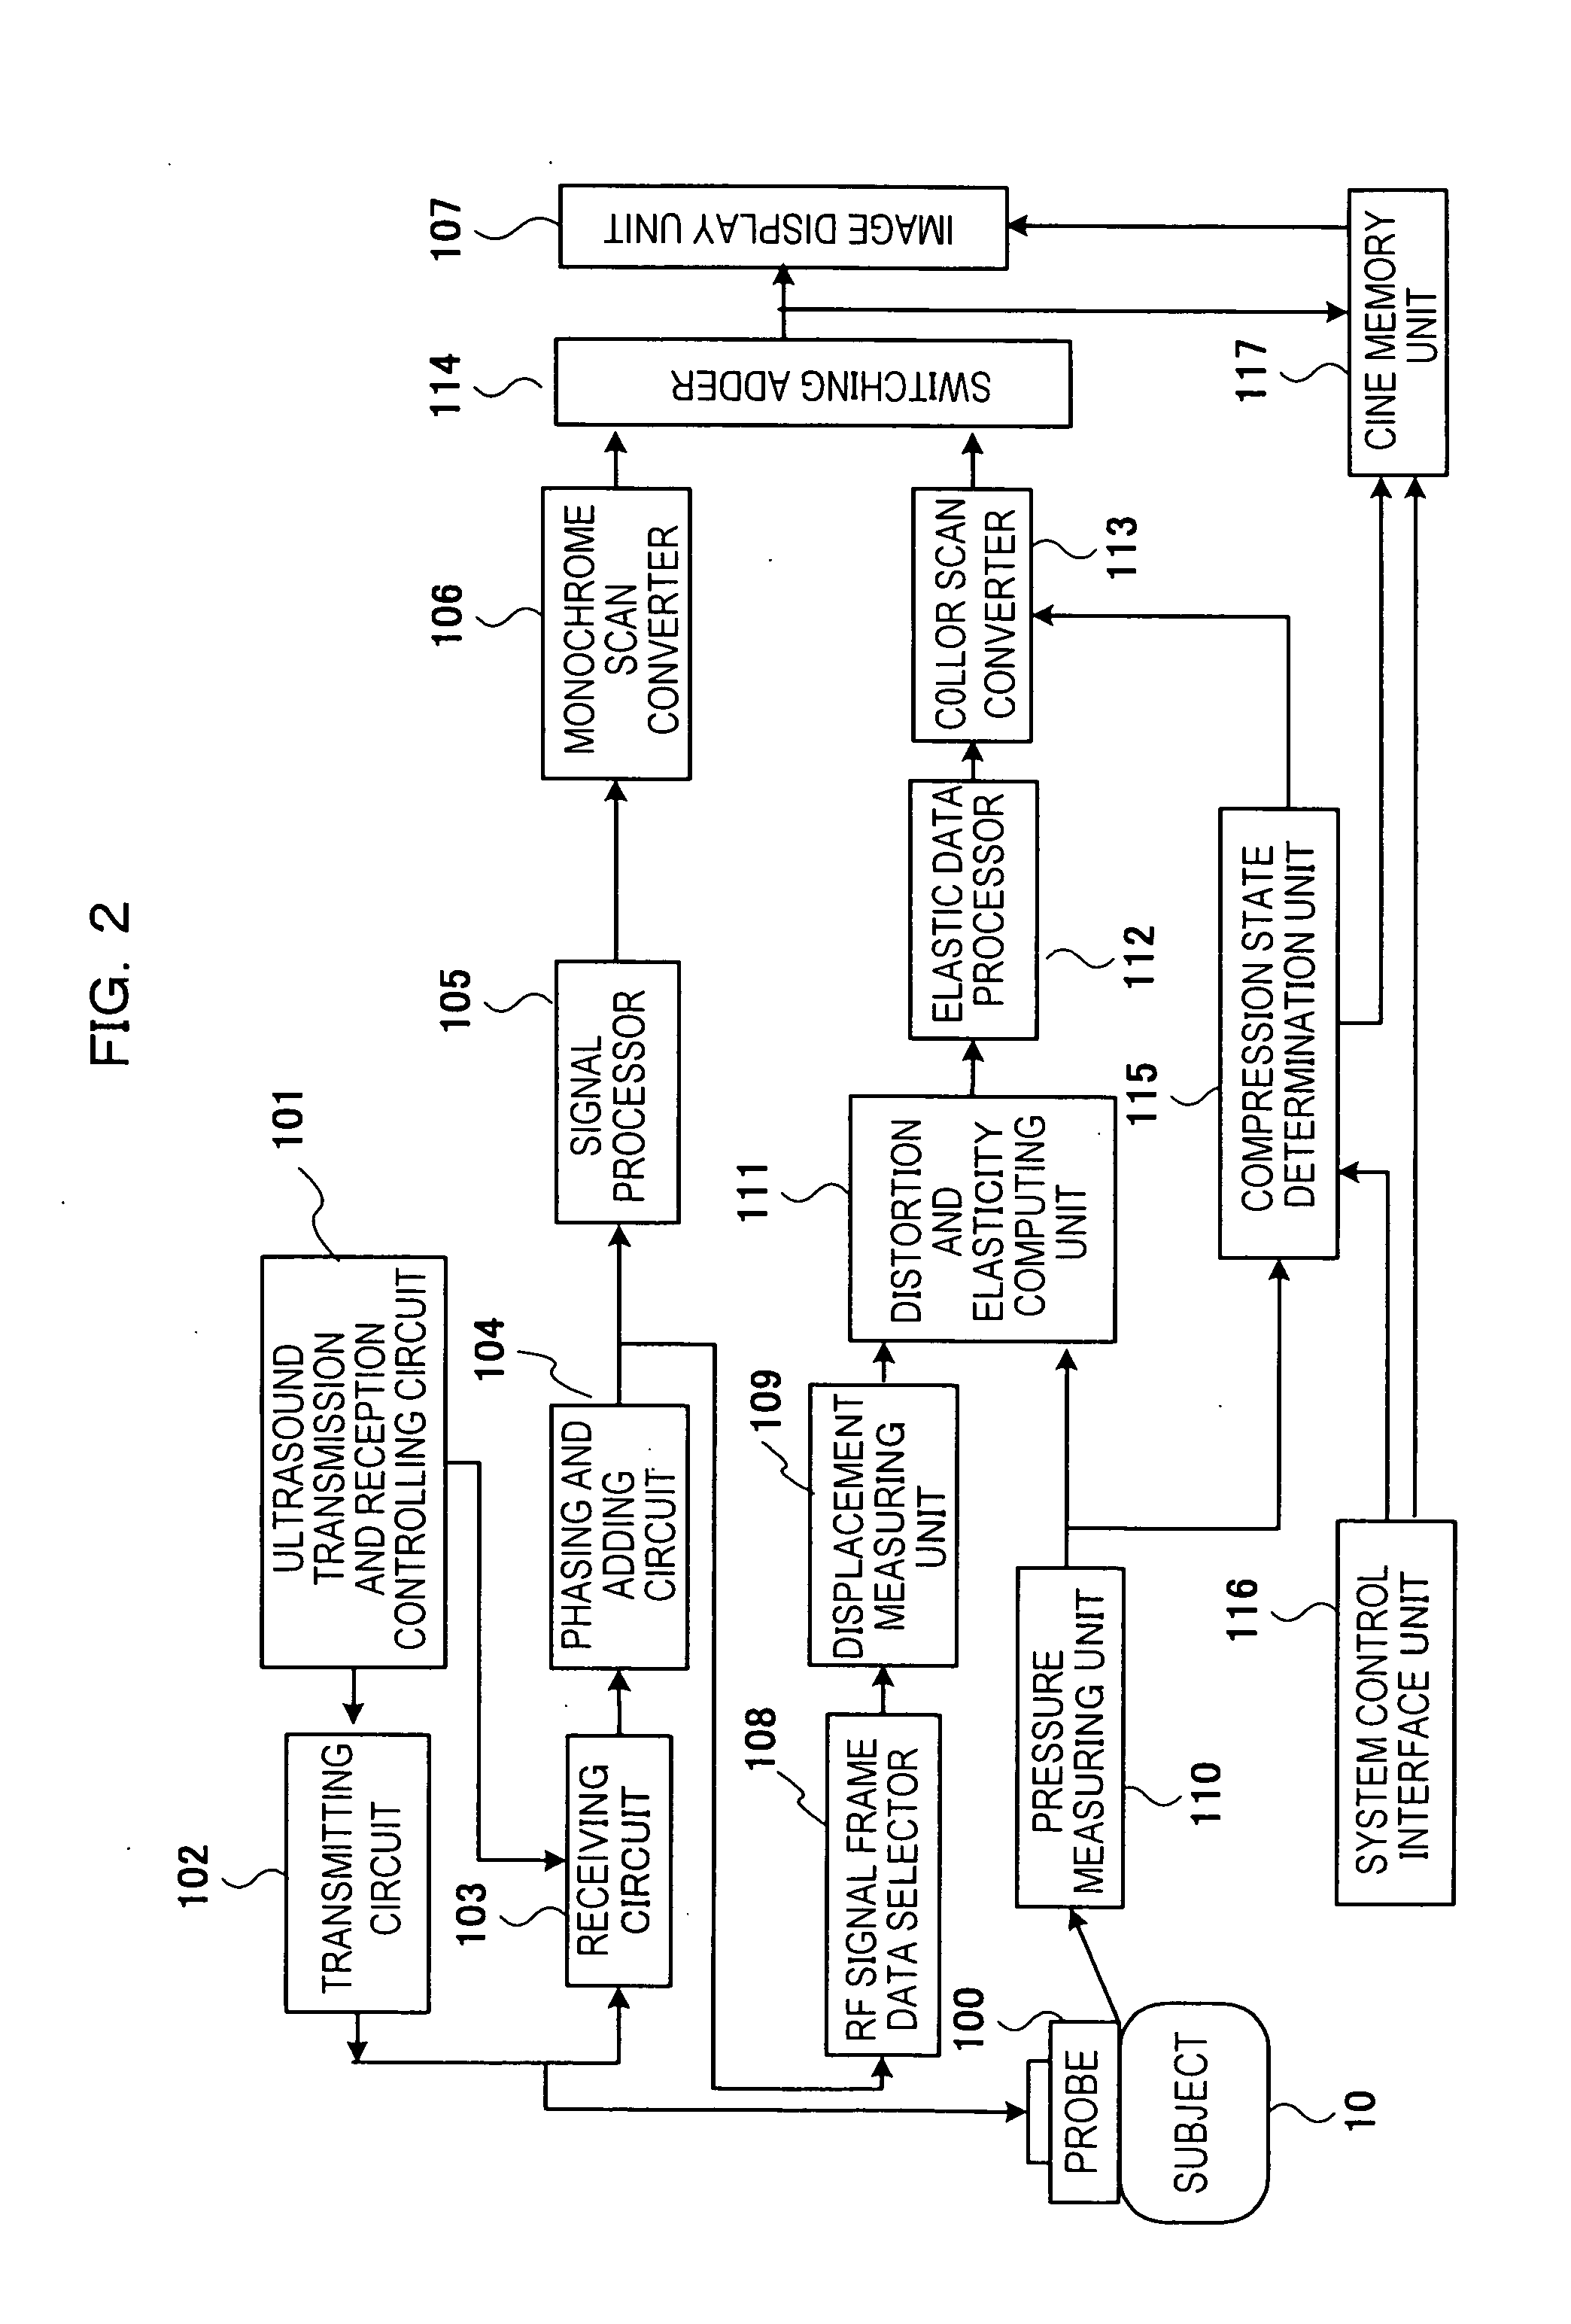
[0079]FIG. 5 is a block diagram illustrating the flow of a process carried out by the compression state evaluating unit 115 according to this embodiment. The compression state evaluating unit 115 includes a memory circuit 1151, a compression state evaluating circuit 1152, and an image configuring circuit 1153. The memory circuit 1151 stores pressure data of the measurement result output from the pressure measuring unit 110 and outputs it to the compression state evaluating circuit 1152. The compression state evaluating circuit 1152 receives the pressure data output from memory circuit 1151, carries out statistical processing, such as overflow processing and average value calculation, on the pressure data so that an optimal image is displayed when displaying the compression state, and outputs numerical value data obtained as a result as compression state evaluation data to the following image configuring circuit 1153. The image configuring circuit 1153 receives the compression state ...

second embodiment

[0101]In the first embodiment, a case in which a pressure data group output from a plurality of pressure sensors in the pressure measuring unit 110 is used to display a statistic characteristic as compression state information is described. However, the present invention is not limited, and sets of pressure data of the pressure sensors may be used to configure sets of compression state image data, and each set of compression state image data may be displayed independently. In other words, when a plurality of pressure sensors is disposed along the long axis direction of the ultrasound transmission and reception surface, as shown in FIG. 6, the positions of the pressure sensors and the corresponding positions in the elastic image and the cross-sectional image may be matched, and each set of compression state image data 10A that is configured independently for each set of the pressure data may be displayed, for example, as shown in FIG. 10. In FIG. 10, the heights of the bar graphs of ...

third embodiment

[0103]FIG. 11 illustrates an example in which the bar graphs in the displayed image in FIG. 9 is replace with a graphic representation 208 simulating the state of compression and deformation of the cross-section region being compressed by the probe shown in the upper section of FIG. 8. By displaying the state of the target tissue being compressed by the probe, the examiner can intuitively recognize the compression state. In FIG. 11, a pressure data value 209 is displayed at the lower area of the schematic diagram of the probe and the target tissue.


PUM


Abstract

To carry out objective or definitive diagnosis on the basis of an elastic image regardless of experience and proficiency, a method of displaying an elastic image includes the steps of measuring ultrasound cross-section data of a cross-section region of a subject by applying pressuring to the subject, determining a physical value correlating with the elasticity of tissue in the cross-section region on the basis of the ultrasound cross-section data, generating an elastic image of the cross-section region on the basis of the physical value and displaying the elastic image on a display device, determine compression state information relating to the compression state of the cross-section region on the basis of the pressure applied to the subject, and displaying the compression state information together with the elastic image on the display device.

Description

TECHNICAL FIELD[0001]The present invention relates to a method of displaying an elastic image for displaying an elastic image representing the hardness or softness of body tissue in a region to be diagnosed by ultrasound diagnosis and relates to a diagnostic ultrasound system.BACKGROUND ART[0002]A diagnostic ultrasound system transmits an ultrasonic wave from an ultrasound transducer into a subject, receives a reflected echo signal, which is ultrasonic wave, corresponding to the structure of the body tissue from inside the subject, and displays a cross-sectional image, such as a B-mode image, for diagnosis.[0003]Recently, it has been proposed to measure ultrasound image data by apply a compression force to a subject according to a manual or mechanical method, determining the displacement in regions of the body caused by the compression on the basis of two sets of ultrasound image data measured at different times, and generating an elastic image representing the hardness or softness ...

Claims


Application Information

Patent Timeline
IPC IPC(8): A61B8/00A61B8/08A61B8/12G01S7/52G01S15/89
CPCA61B5/0048A61B8/445A61B8/12A61B8/4281A61B8/461A61B8/463A61B8/485A61B8/5238A61B2562/0247A61B2562/028A61B2562/043A61B2562/046G01S7/52042G01S7/52074G01S15/8909G01S15/899A61B8/429A61B8/5223A61B2019/5276A61B8/0825A61B8/08A61B2090/378
Inventor MATSUMURA, TAKESHI
Owner FUJIFILM HEALTHCARE CORP
Why Eureka
Try Eureka