Graph plotting device and graph plotting method, yield analyzing method and yield improvement support system for executing the graph plotting method, program, and computer-readable recording medium

Active Publication Date: 2008-11-13
SHARP KK
View PDF19 Cites 21 Cited by
  • Summary
  • Abstract
  • Description
  • Claims
  • Application Information

AI Technical Summary

Benefits of technology

[0074]According to the recording medium of the present invention, allowing a computer to read the record content

Problems solved by technology

However, products may have many defective factors, which may intricately be intertwined with each other.
Therefore, it is usually difficult to extract latent correlations.
It is very

Method used


Image

  • Graph plotting device and graph plotting method, yield analyzing method and yield improvement support system for executing the graph plotting method, program, and computer-readable recording medium
  • Graph plotting device and graph plotting method, yield analyzing method and yield improvement support system for executing the graph plotting method, program, and computer-readable recording medium
  • Graph plotting device and graph plotting method, yield analyzing method and yield improvement support system for executing the graph plotting method, program, and computer-readable recording medium

Examples


first embodiment

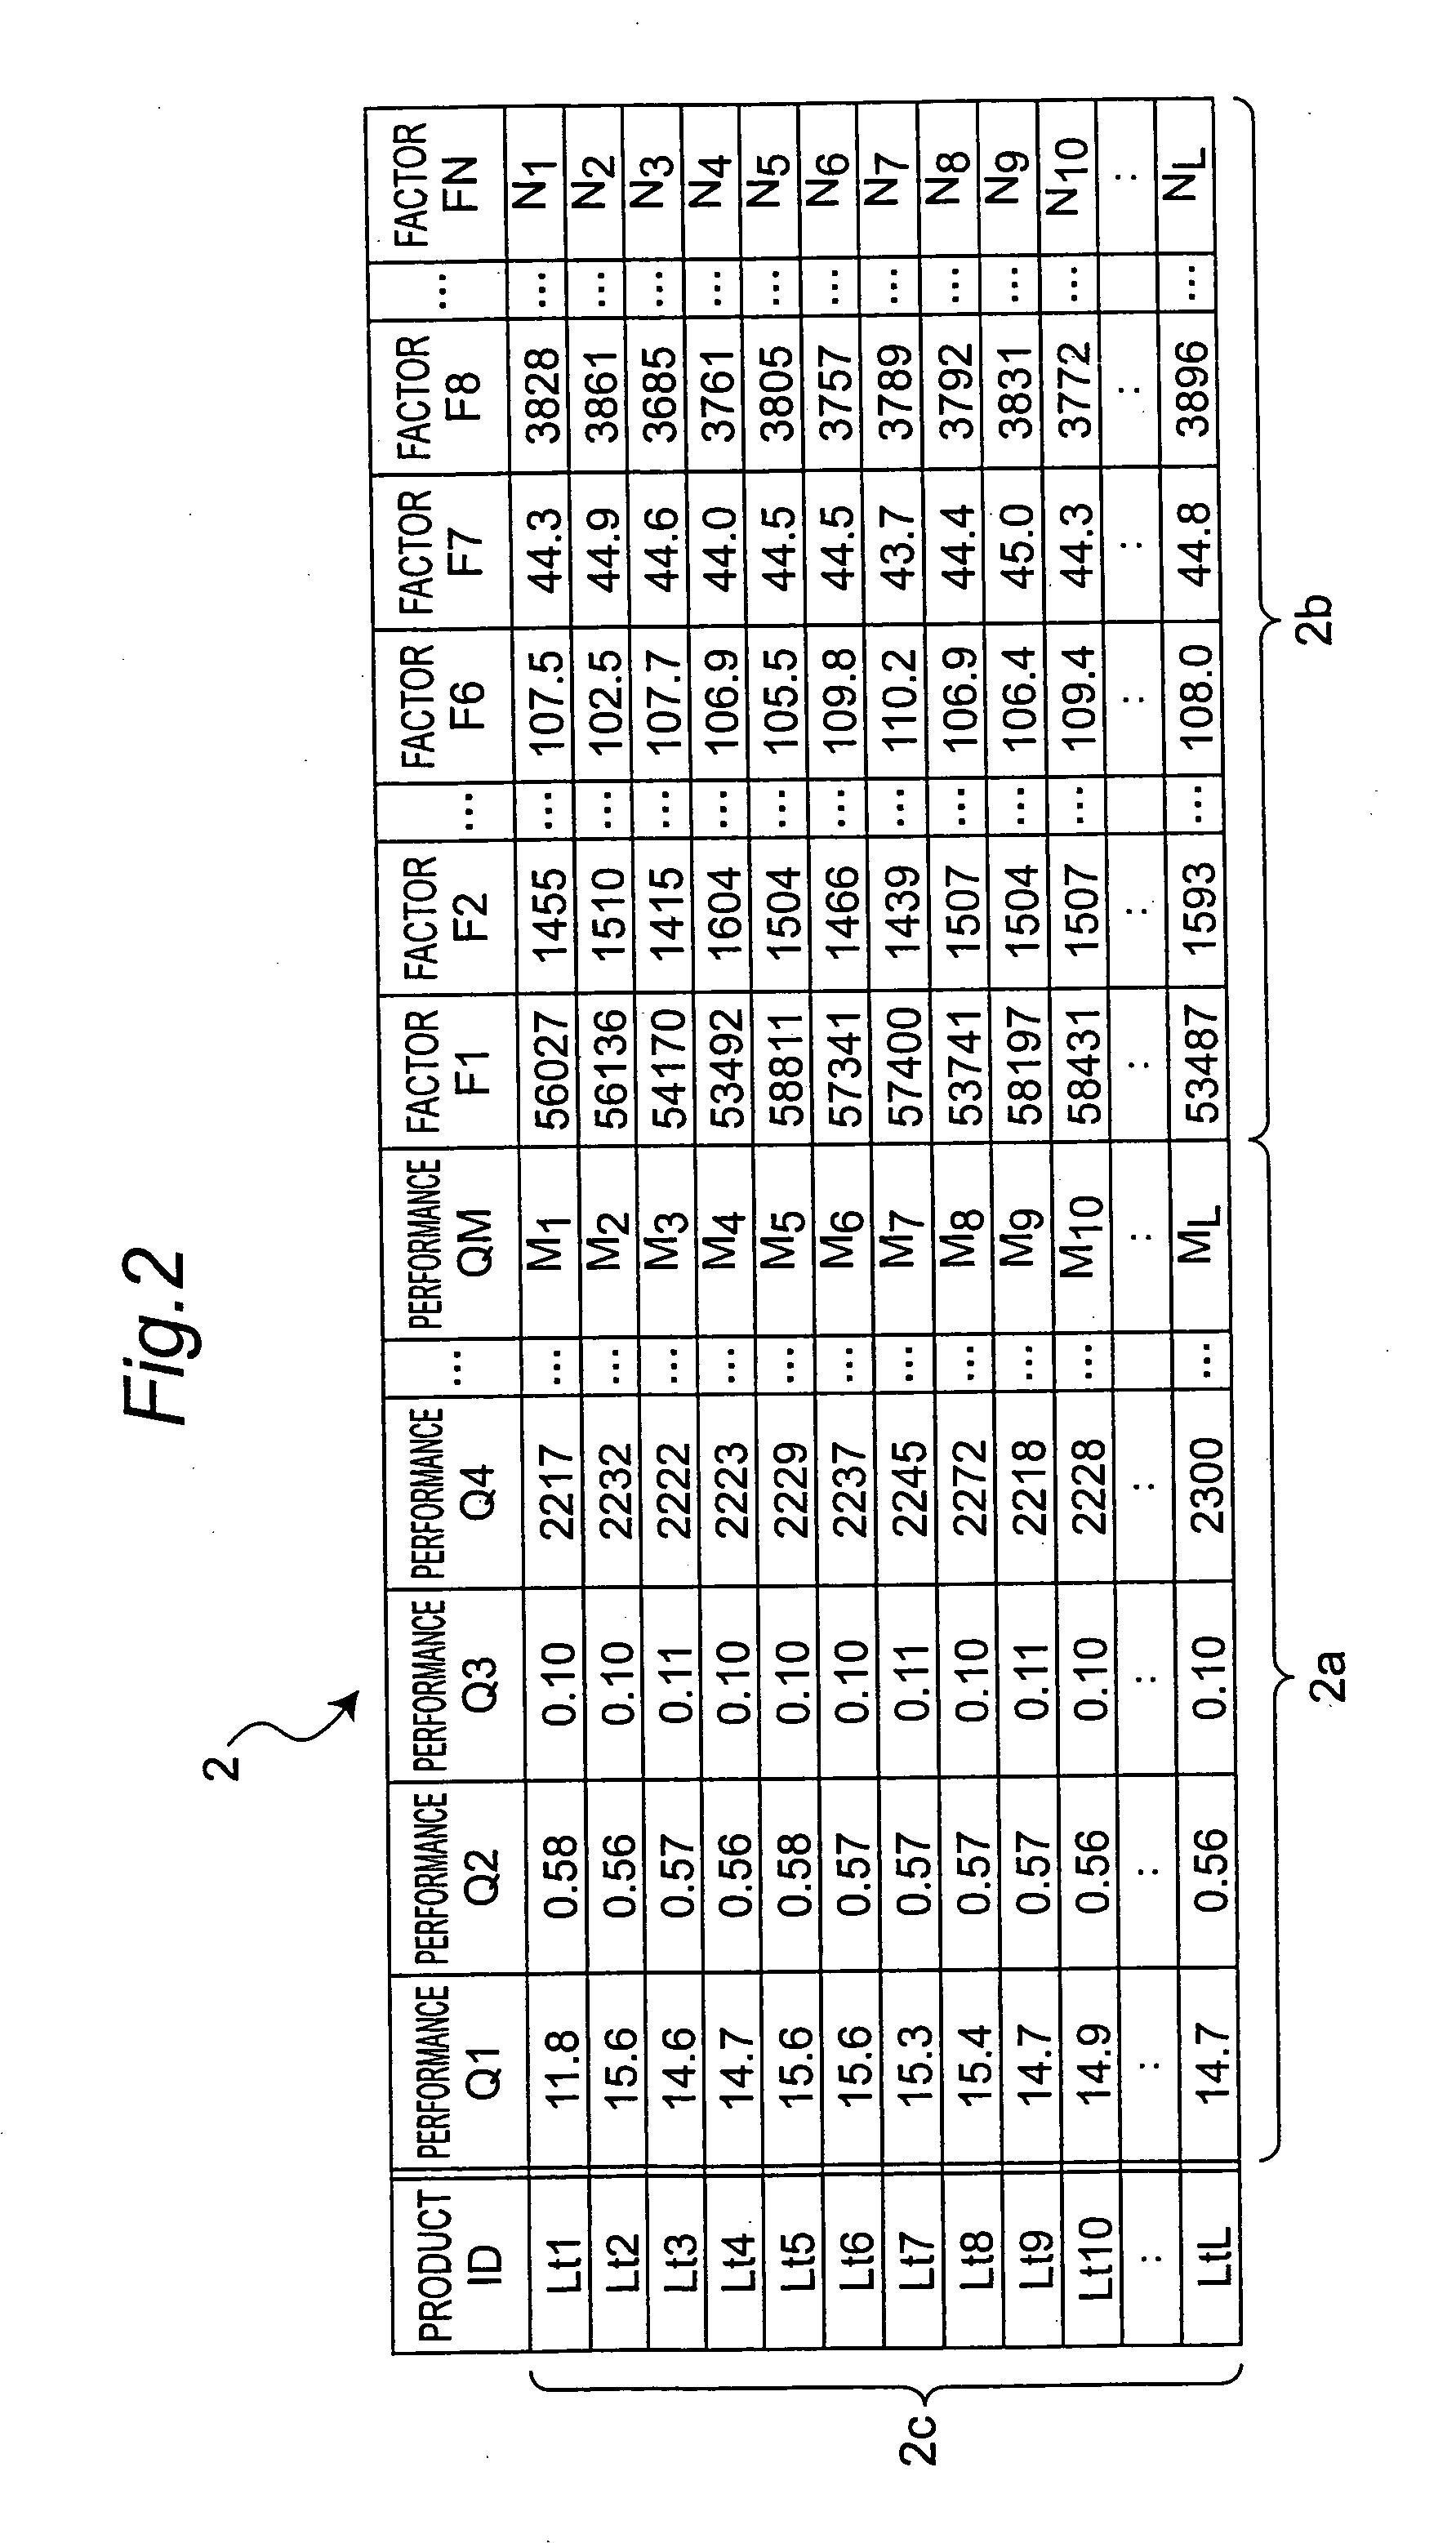
[0095]FIG. 2 shows an example of the content of a link data table 2 storing the data targeted for graph plotting by a later-described graph plotting device in one embodiment. In this example, the link data table 2 stores “performance” Q1, Q2, . . . , QM as M variates belonging to a first data group 2a and “factor” F1, F2, . . . , FN as N variates belonging to a second data group 2b so as to be associated with (linked to) each other for every product lot, Lt1, Lt2, . . . , LtL.

[0096]In an example in the semiconductor manufacturing field, the data represented by “performance” Q1, Q2, QM is, for example, the performance of a device obtained by wafer test, electric characteristics test and the like, whereas the data represented by “factor” F1, F2, . . . , FN is process data on oxide film thicknesses, line width and examination, or the like.

[0097]Each product lot is specified by L “product IDs” Lt1, Lt2, . . . , LtL as common identifiers 2c. In short, in the link data table 2, “performan...

second embodiment

[0124]In the semiconductor product manufacturing field, each product lot is sequentially processed in a plurality of the manufacturing steps to produce products. In each manufacturing step, a plurality of manufacturing machines capable of performing the respective manufacturing step are often used concurrently. Accordingly, when the yield of product lots falls, it is important to promptly analyze which manufacturing machine (operator) has a defective factor.

[0125]FIG. 9 is a view showing an example of the content of a link data table 8 storing the data targeted for graph plotting by the graph plotting device 1. In this example, the link data table 8 stores “performance” Q1, Q2, . . . QM as M variates belonging to a first data group 8a and “process name” P1, P2, . . . , PO as O variates belonging to a second data group 8b so as to be associated with (linked to) each other for every product lot, Lt1, Lt2, . . . , LtL.

[0126]In an example in the semiconductor manufacturing field, the da...

third embodiment

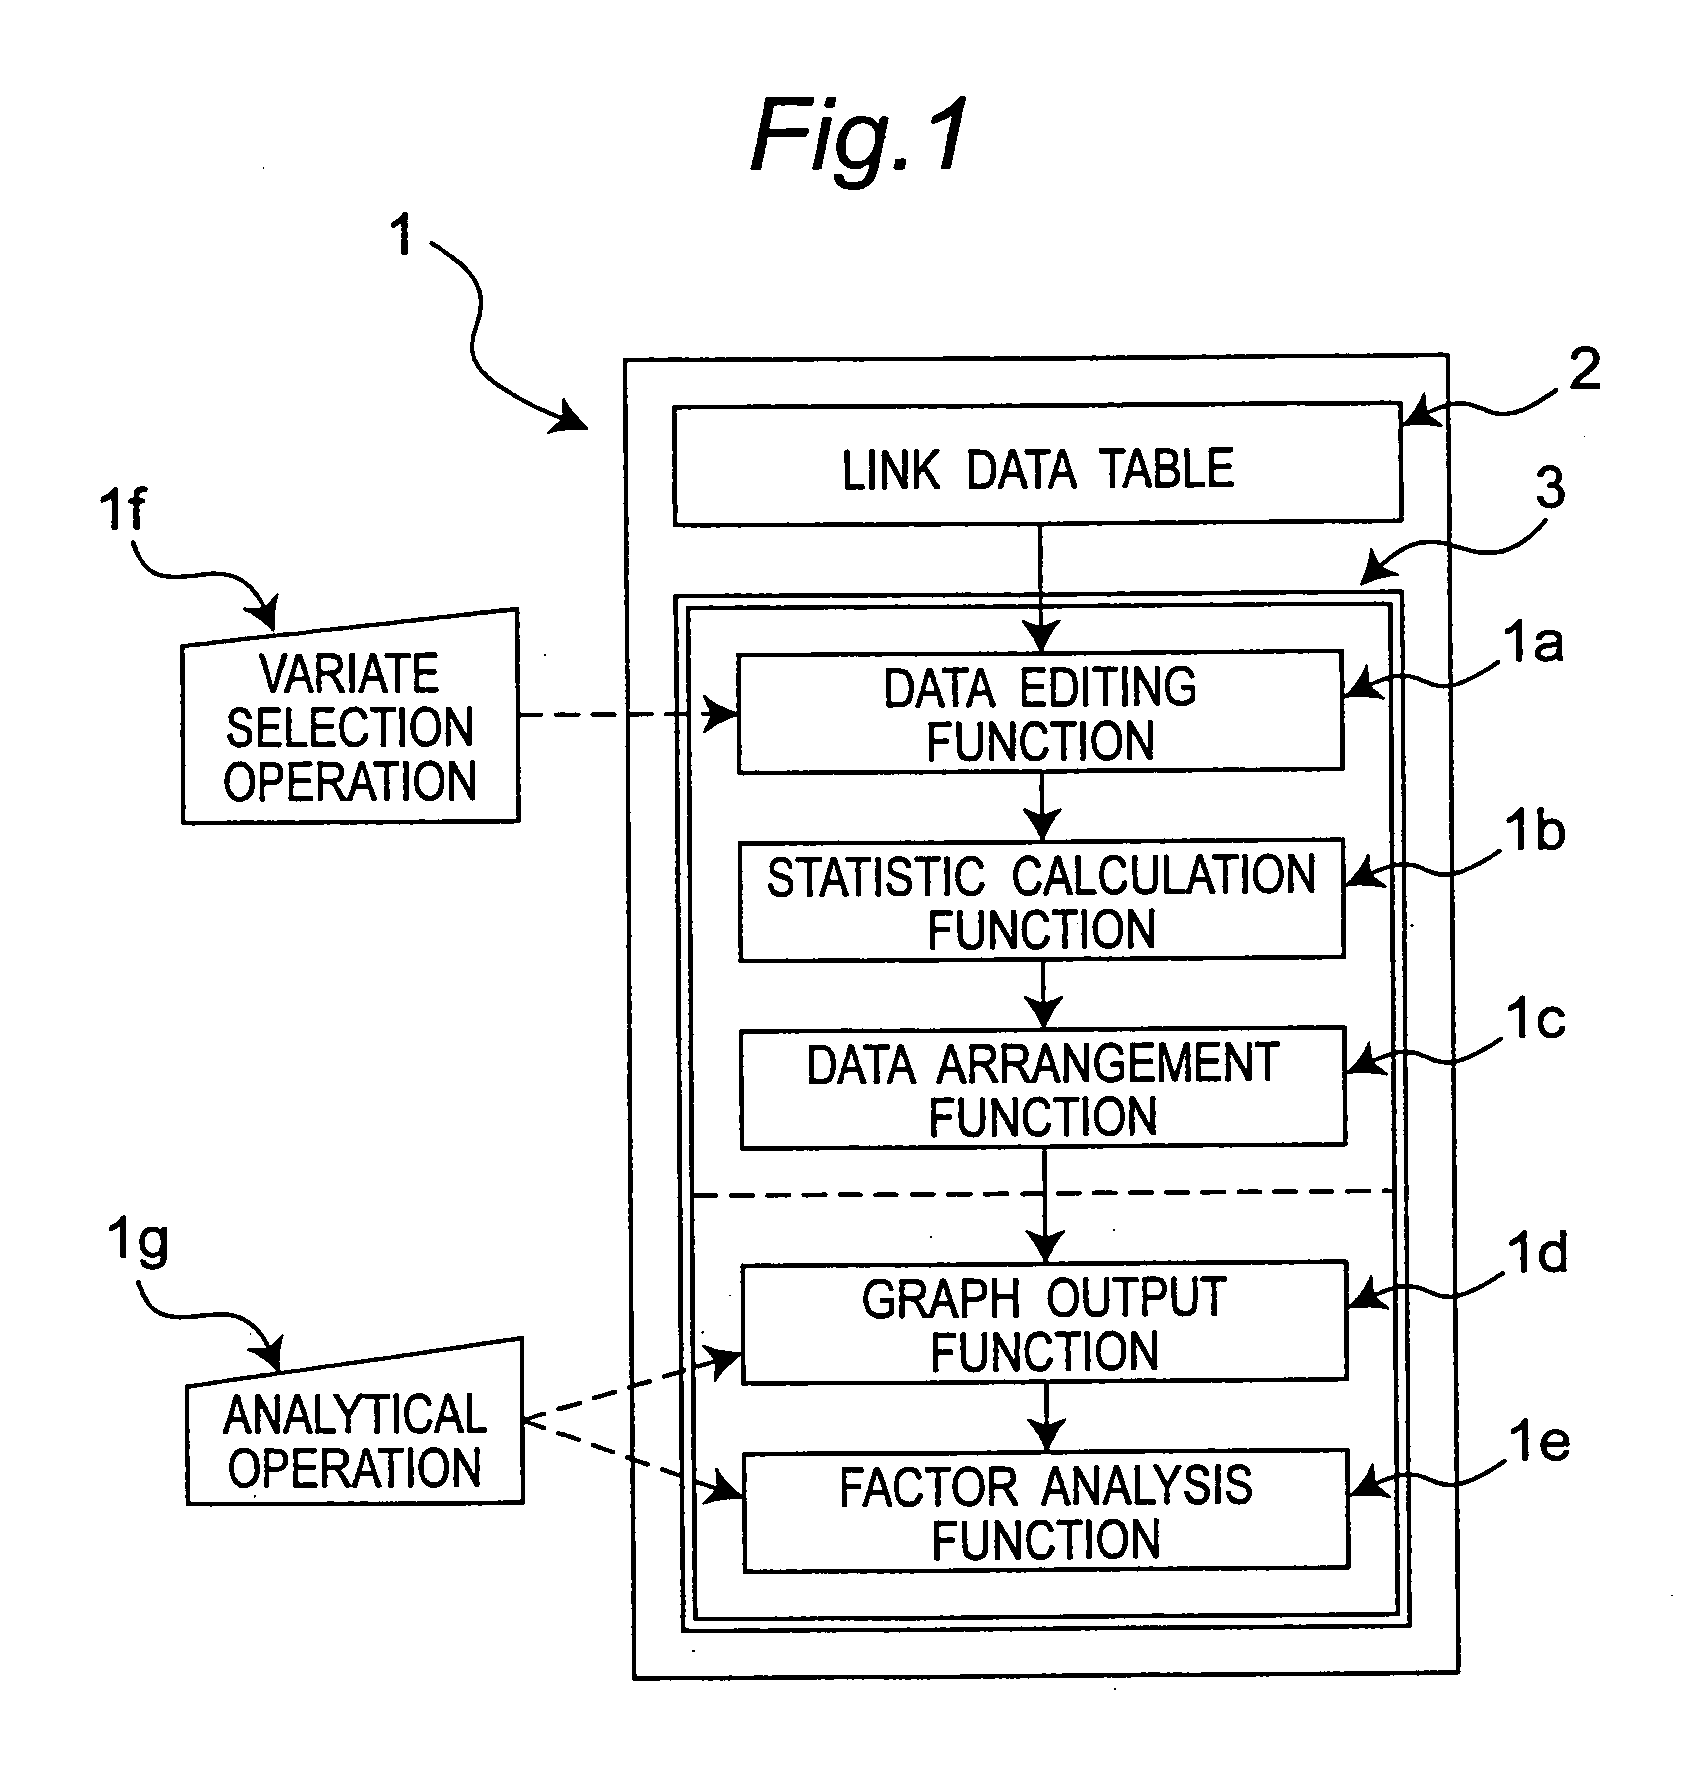
[0140]FIG. 10 shows the entire configuration of a yield improvement support system including the graph plotting device 1 shown in FIG. 1, the system suitable for managing manufacturing processes in the fields such as the semiconductor product manufacturing field.

[0141]The yield improvement support system is composed of a manufacturing process controlling device 10b as a server for managing manufacturing processes, a test process controlling device 10c as a server for measuring and managing the semiconductor performance (yield) of product lots, and a yield factor analyzing device 10a including the aforementioned graph plotting device 1, each of which can communicate with each other via a data communication channel 10d.

[0142]The manufacturing process controlling device 10b includes a database 10e for storing processing history data and process data which are variates relating to the manufacturing processes. The test process controlling device 10c includes a database 10f for storing m...


PUM


Abstract

In the present invention, a matrix display area for displaying m×n elements arranged in matrix form and a graph display area for displaying a graph image are set on an identical display screen. The m×n statistics between m variates belonging to a first data group and n variates belonging to a second data group are computed and displayed as matrix elements arranged in n rows and m columns in the matrix display area. A graph image representing a relation between two variates, one of which belongs to the first data group and the other of which belongs to the second data group, and corresponding to one matrix element specified by the matrix element specification section, is formed and displayed in the graph display area on the display screen.

Description

CROSS-REFERENCE TO RELATED APPLICATIONS[0001]This Nonprovisional application claims priority under 35 U.S.C. §119(a) on Patent Application No. 2007-126607 filed in Japan on May 11, 2007, the entire contents of which are hereby incorporated by reference.BACKGROUND OF THE INVENTION[0002]The present invention relates to a graph plotting device and a graph plotting method, and more specifically relates to a device and a method for plotting graph representing correlation between one variate and another variate.[0003]The present invention also relates to a yield analyzing method and a yield improvement support system which performs yield analysis while plotting a graph by executing such a graph plotting method.[0004]The present invention also relates to a computer-readable program for executing those methods.[0005]The present invention also relates to a computer-readable recording medium storing those methods.[0006]In the fields such as the semiconductor product manufacturing field, a lar...

Claims


Application Information

Patent Timeline
IPC IPC(8): G06T11/20G09G5/36H01L21/02H01L21/66
CPCG06T11/206
Inventor MINAMIDE, MASAHIKOTAKAHASHI, YOSHIO
Owner SHARP KK
Why Eureka
Try Eureka