Banding profile estimator using multiple sampling intervals

Inactive Publication Date: 2009-01-01
XEROX CORP
View PDF20 Cites 48 Cited by
  • Summary
  • Abstract
  • Description
  • Claims
  • Application Information

AI Technical Summary

Benefits of technology

[0010]U.S. Publication No. 2002/0159791, published Oct. 31, 2002, entitled SYSTEMS AND METHODS FOR REDUCING BANDING ARTIFACT IN ELECTROPHOTOGRAPHIC DEVICES USING DRUM VELOCITY CONTROL, by Chen, discusses an electrophotographic device which uses a closed loop controller that

Problems solved by technology

The scan line spacing variation is a significant contributor of artifacts in marking process.
For example, halftone banding caused by scan line spacing variation is one of the most visible and undesirable artifacts, appearing as light and dark streaks across a printed page perpendicular to the process direction.
It is often periodic and it can result from errors in the mechanical motion of rotating components within a marking engine.
Banding phase is difficult to measure since, relative to the printed page, it varies from page to page.
Thus, if one measured page one, and determined that the phase was such that a density peak occurs at the beginning of each page, upon applying a corresponding compensation to page two, poor performance would result—the ban

Method used


Image

  • Banding profile estimator using multiple sampling intervals
  • Banding profile estimator using multiple sampling intervals
  • Banding profile estimator using multiple sampling intervals

Examples


Embodiment Construction

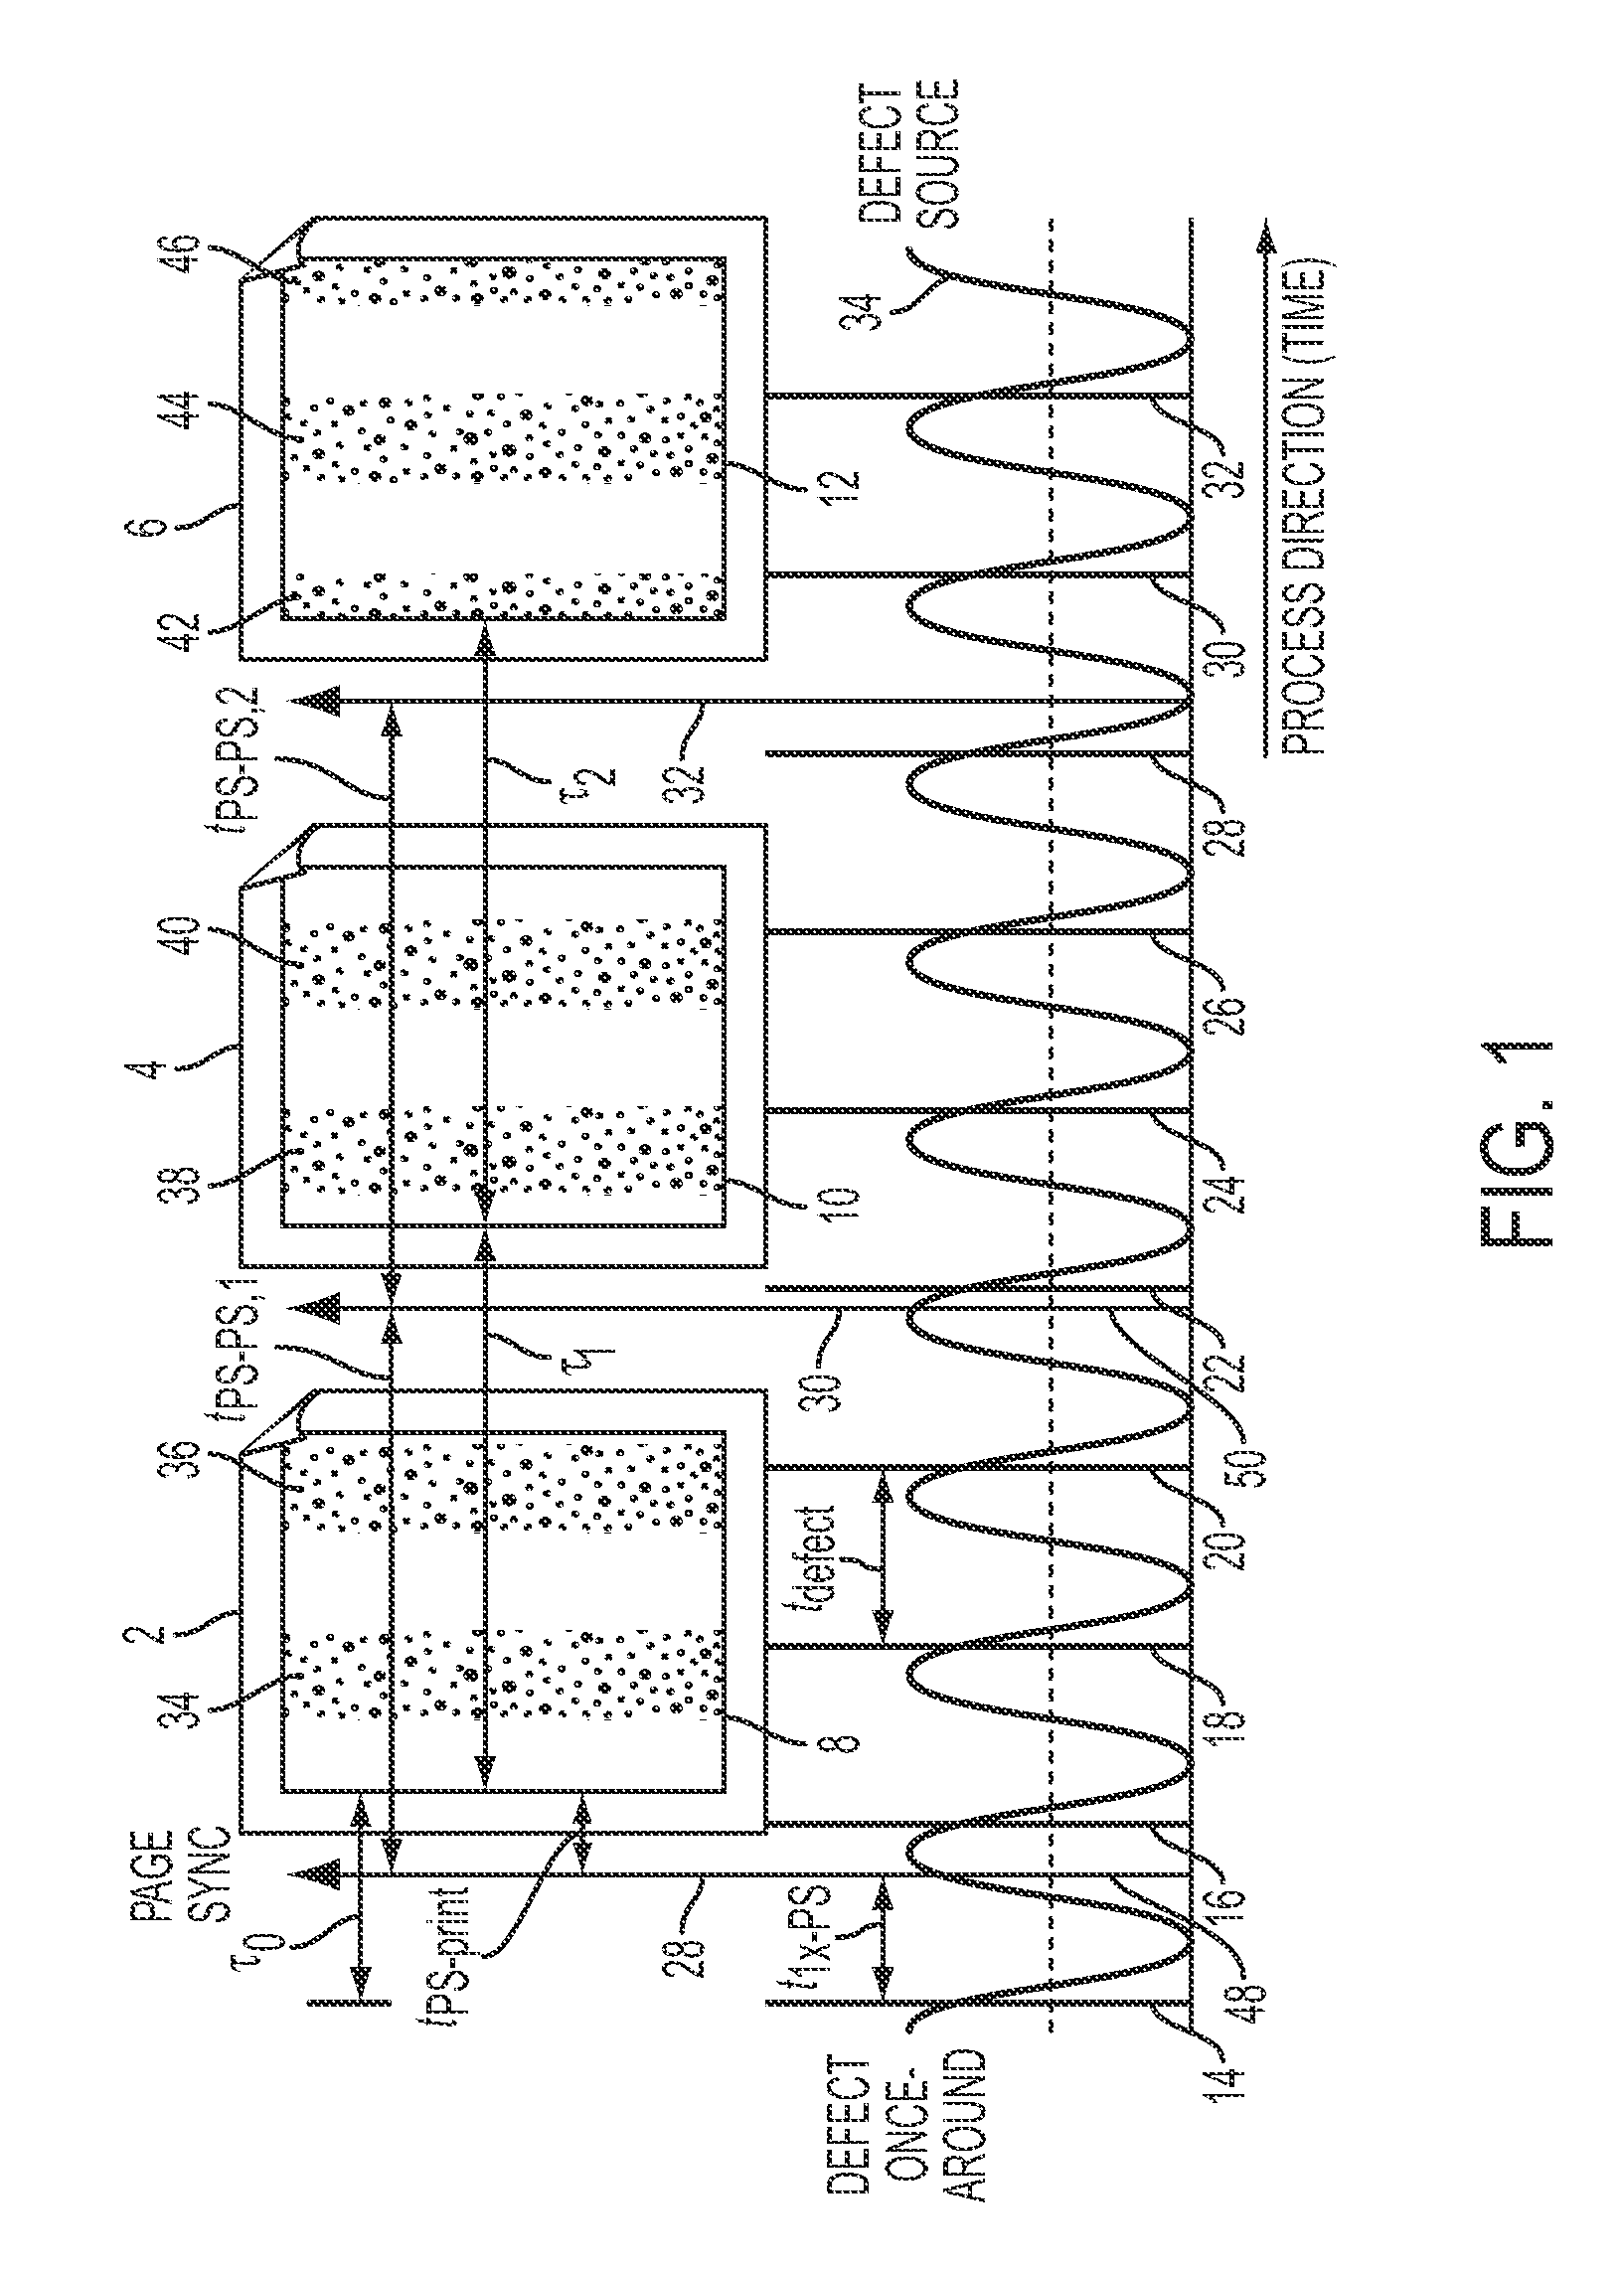
[0032]Referring now to the drawings wherein the showings are for purposes of illustrating the exemplary embodiments only and not for purposes of limiting the claimed subject matter, a series of images processed by a printing system (see FIG. 3) in a process direction (i.e., the direction of the paper travel in the printing system) is shown in FIG. 1. Consider a print job of M pages, the first three of which are shown in FIG. 1. The boxes with the folded upper right hand corners depict pieces of paper 2, 4, and 6 with printed images or test targets 8, 10, and 12, respectively. They could represent any known sampling interval, such as interdocument zones, customer image zones, image zones outside of the customer image zone, or printed pages. The multiple sampling intervals may be located on an intermediate belt, an intermediate drum, a photoreceptor belt, a photoreceptor drum and / or output media.

[0033]The images 8, 10, and 12 on the pieces of paper 2, 4, and 6 represent test targets d...


PUM


Abstract

A method of integrating multiple sampling interval image data with timing information from a defect once-around sensor and the machine page sync signals to estimate a banding profile. By augmenting the sampling interval data with the timing data, proper phasing of each frequency over each sampling interval can be maintained. Specifically, when the data over the multiple intervals is taken, the defect source once-around signal and the page sync signals are also recorded. The combination of this information allows the algorithm to extract phase and amplitude information of banding defects from the sampling intervals using a new matched-filter based parameter estimation algorithm. Estimated banding profiles are then generated from the known frequencies, and the estimated amplitude and phase values.

Description

CROSS REFERENCE TO RELATED PATENTS AND APPLICATIONS[0001]The following patent / application, the disclosures being totally incorporated herein by reference is mentioned:[0002]U.S. application Ser. No. 11 / 399,100 (Attorney Docket 20051634-US-NP), filed Apr. 6, 2006, entitled “SYSTEMS AND METHODS TO MEASURE BANDING PRINT DEFECTS,” by Peter Paul.BACKGROUND[0003]The exemplary embodiment disclosed herein relates to document processing systems. It finds particular application in conjunction with sensing and control of banding and will be described with particular reference thereto. However, it is to be appreciated that the exemplary embodiment is also amenable to other like applications.[0004]By way of background, in a typical printing system, a photoconductive drum or photoreceptor rotates at an angular velocity. As the photoconductive drum rotates, the photoconductive drum is electrostatically charged. A latent image is exposed line by line onto the photoconductive drum using a scanning l...

Claims


Application Information

Patent Timeline
IPC IPC(8): G06F15/00G06K15/00
CPCG06K15/027G06K15/00
Inventor PAUL, PETERRABBANI, SAHAND
Owner XEROX CORP
Why Eureka
Try Eureka