
A robust spectral analyzer for one-dimensional and multi-dimensional data analysis

a robust and multi-dimensional technology, applied in the field of spectral analysis, can solve the problems of poor performance and poor spectral estimates of raw periodograms, and achieve the effect of less sensitive, greater or improved detection power and accuracy

Active Publication Date: 2009-04-30
TAIWAN SEMICON MFG CO LTD
View PDF5 Cites 3 Cited by
  • Summary
  • Abstract
  • Description
  • Claims
  • Application Information

AI Technical Summary

Benefits of technology

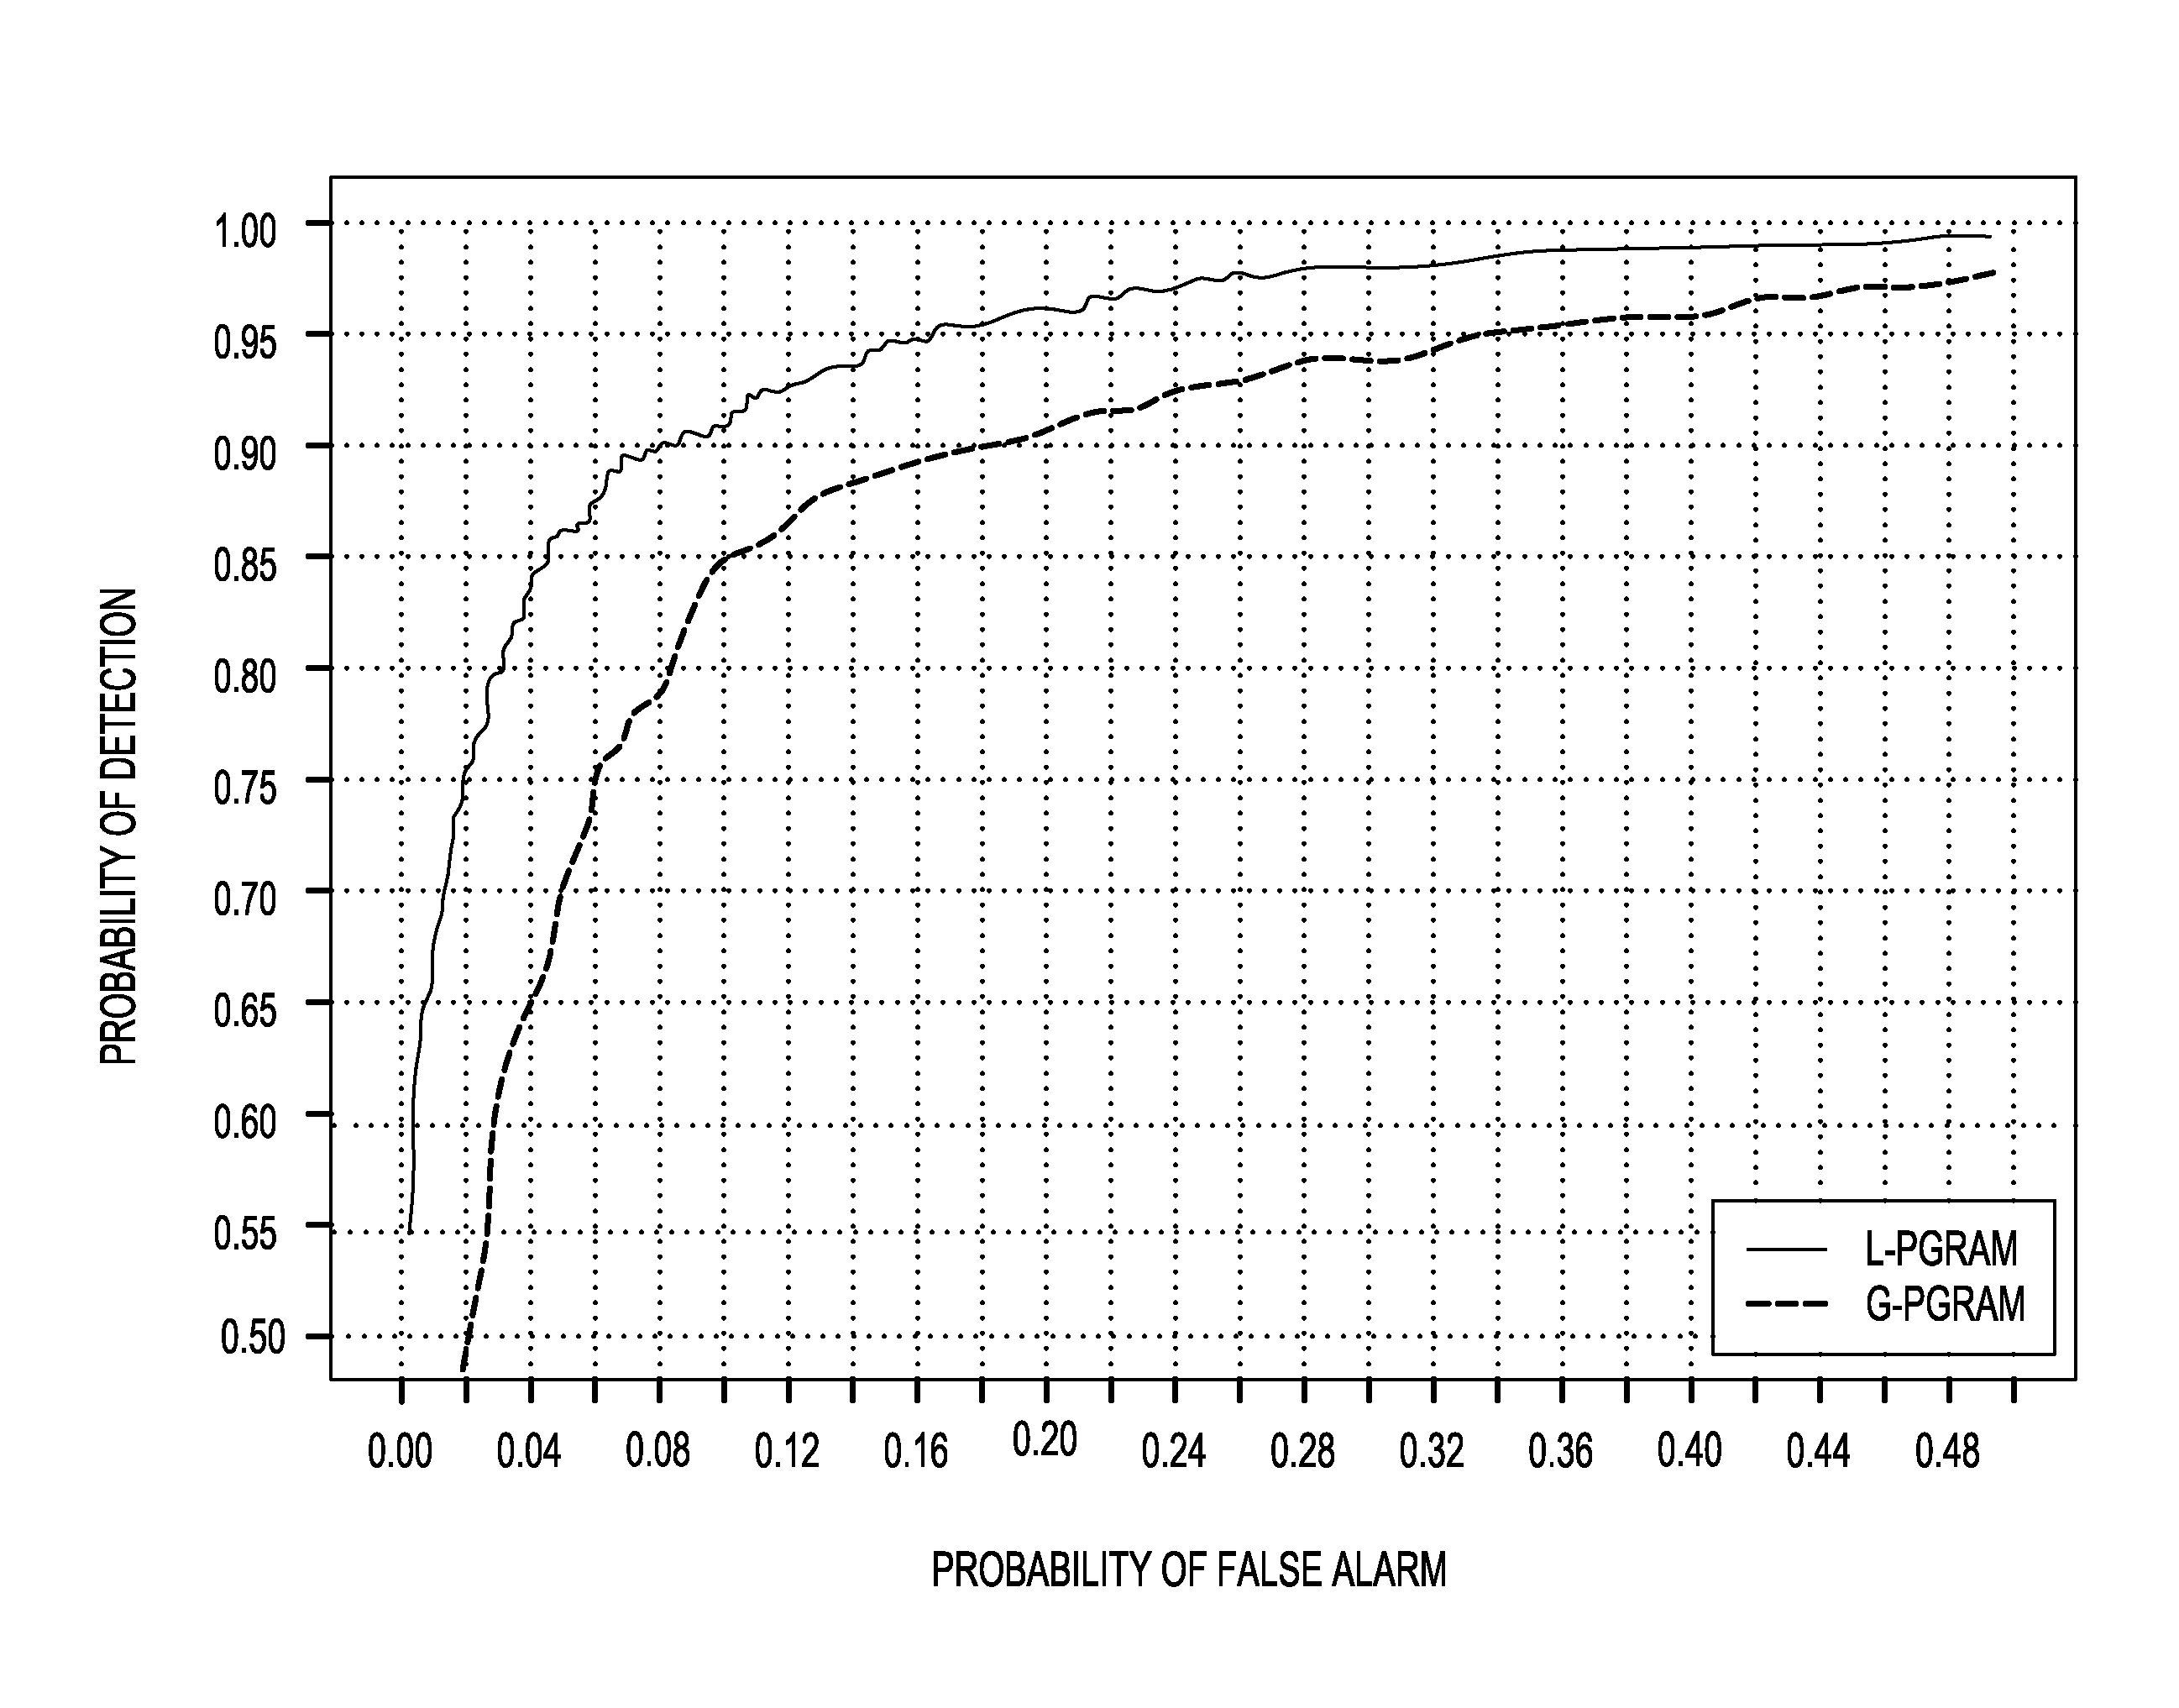
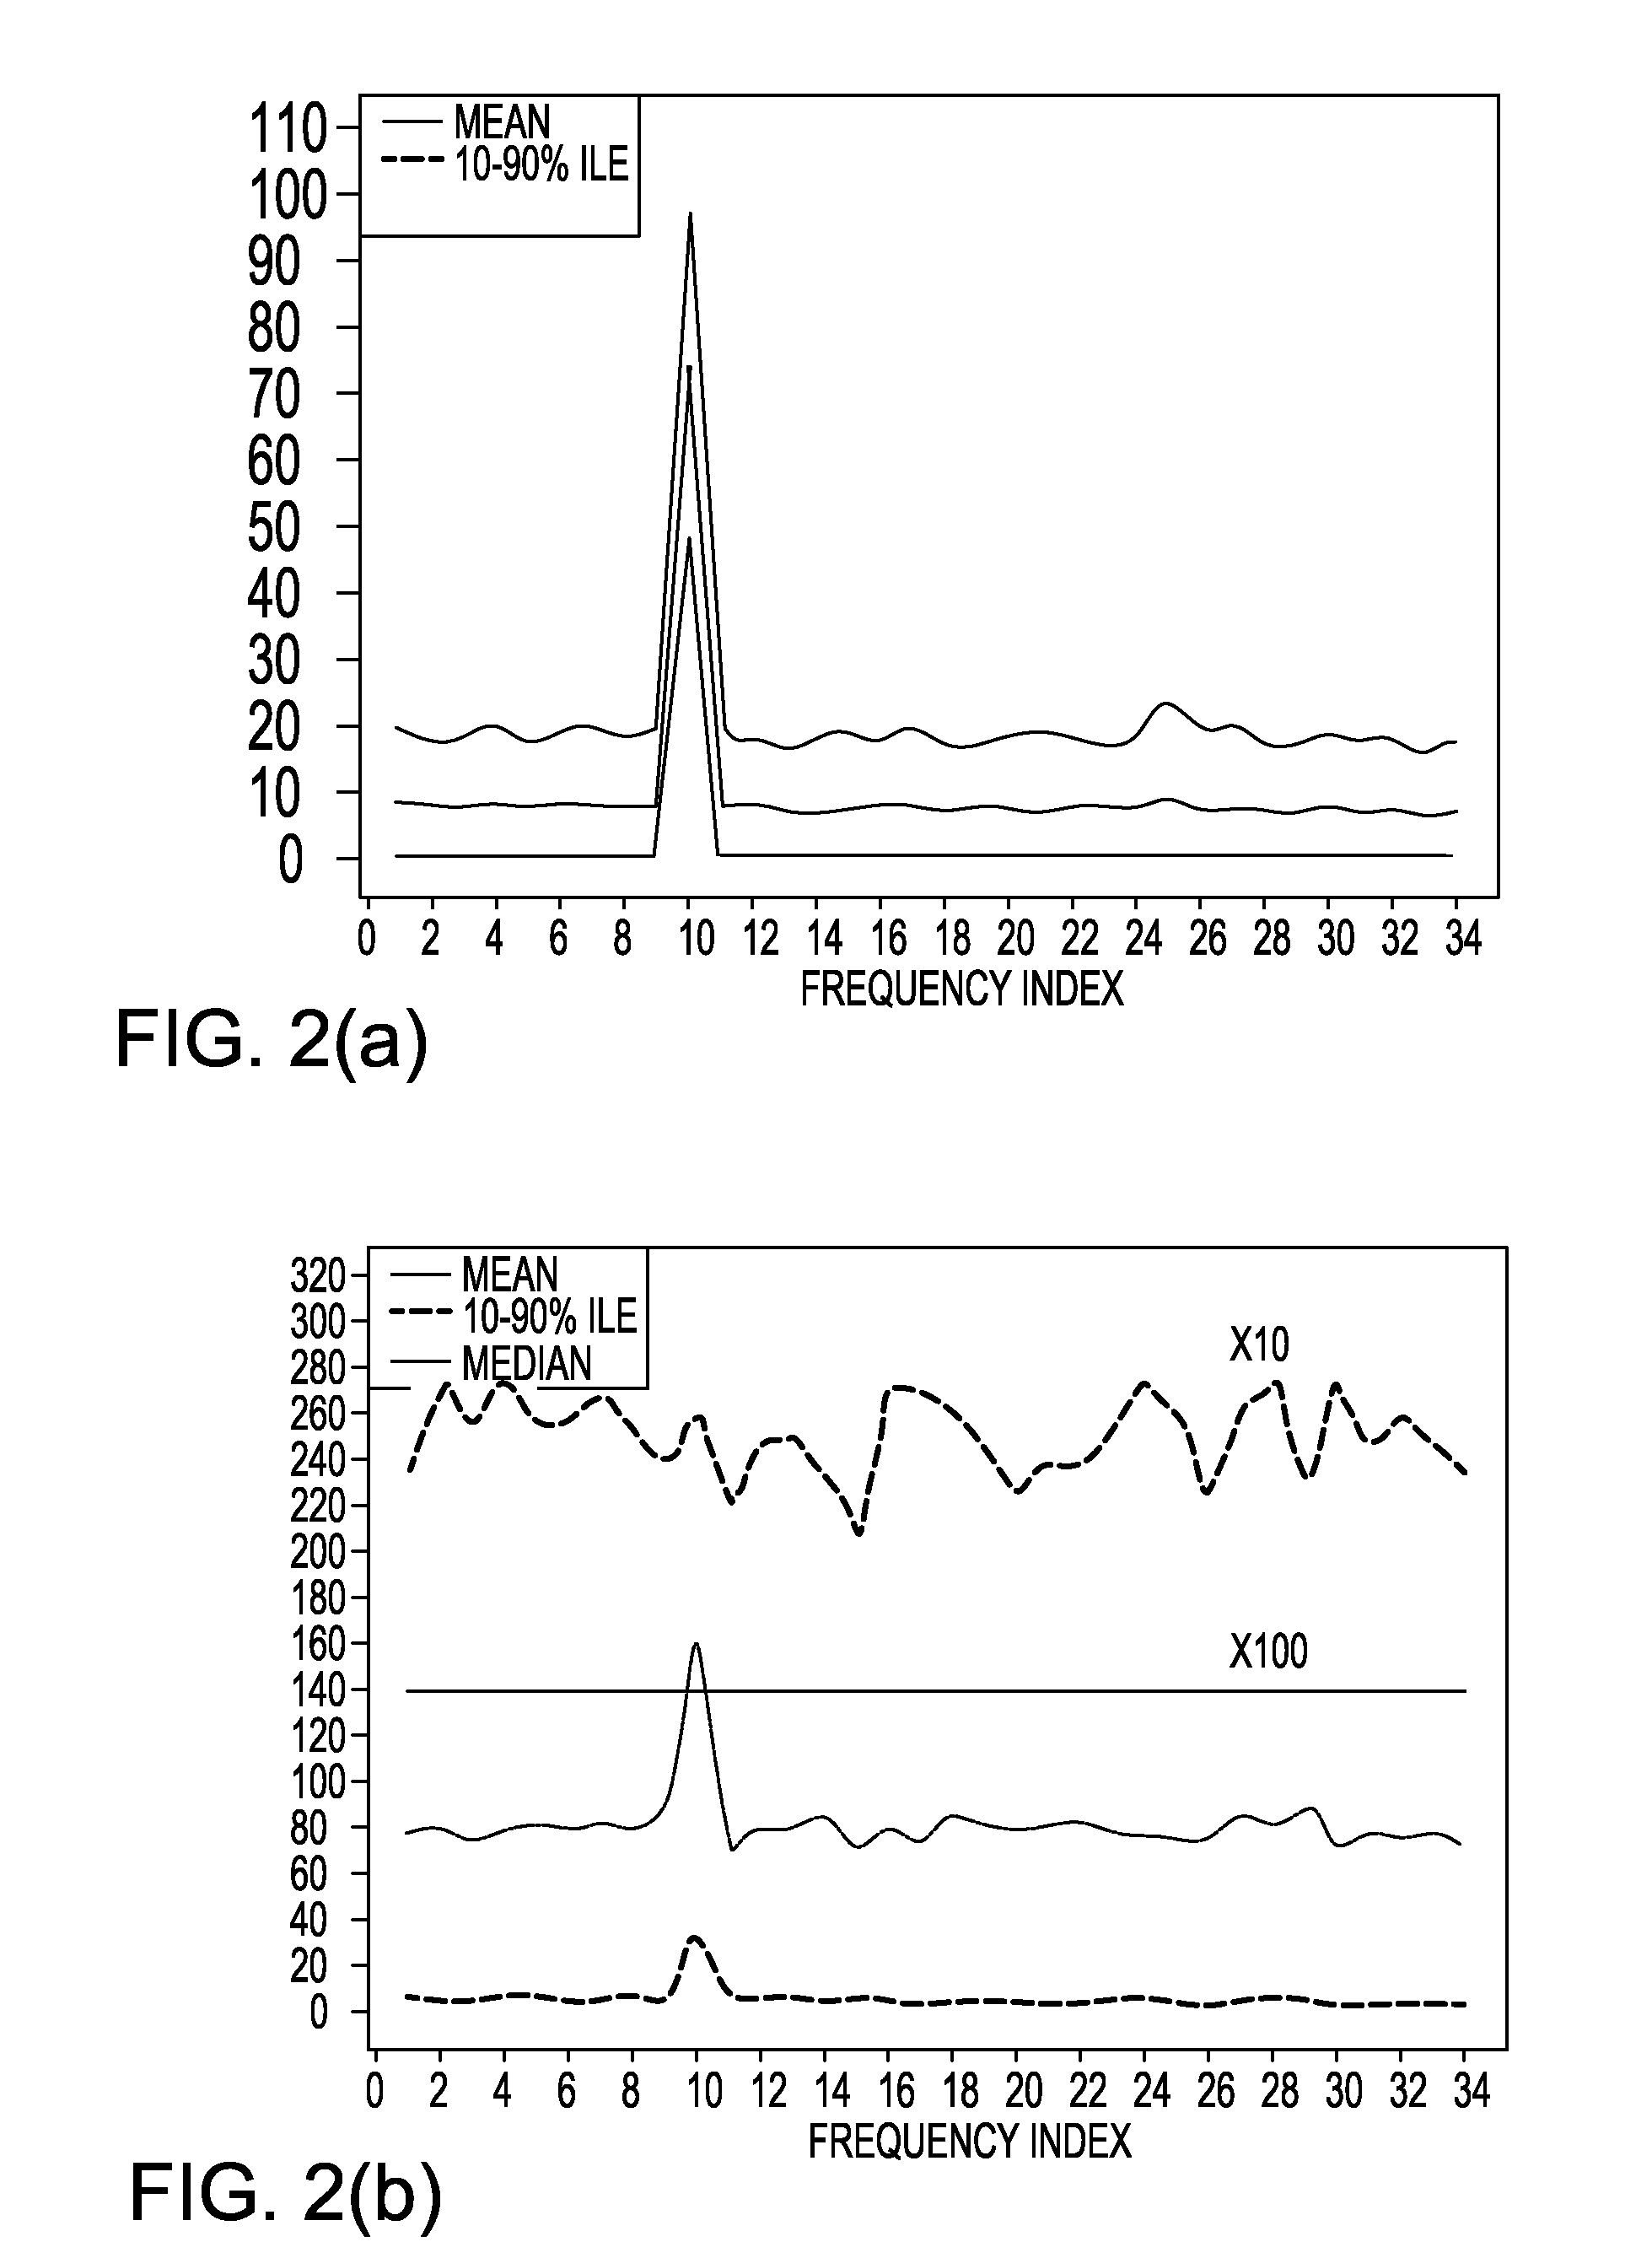
[0008]More particularly, the regression coefficients can be obtained using the L1-norm (i.e., by the method of least absolute deviations), wherein the sum of squared coefficients of the least absolute deviations regression is a periodogram-like function. The novel periodogram-like function is referred to herein as a Laplace periodogram. As compared with the Fourier transform-based conventional periodogram, the Laplace periodogram of the invention has a number of advantages. These advantages include that the inventive Laplace periodogram is less sensitive to outliers, is less susceptible to statistical variability for heavy-tailed data, realizes greater or improved detection power and accuracy for detecting and estimating sinusoidal signals in heavy-tailed noise, is invariant (up to a scaling factor) under sign-preserving memory-less transformation, is more reliable than clipping techniques, and is applicable to both gridded and non-gridded data, is applicable to data with missing values.

Problems solved by technology

Conventional techniques of spectral analyses, including periodograms and autoregressive models, are known to lack robustness for heavy-tailed data, resulting in poor performance in situations such as outlier contamination.
Typically, raw periodograms are not good spectral estimates because of statistical variability in view of the fact that the variance at a given frequency does not decrease as the number of samples used in the computation increases.

Method used


Image

  • A robust spectral analyzer for one-dimensional and multi-dimensional data analysis
  • A robust spectral analyzer for one-dimensional and multi-dimensional data analysis
  • A robust spectral analyzer for one-dimensional and multi-dimensional data analysis

Examples


Embodiment Construction

[0017]The detailed description of the invention and its various embodiments and implementations requires the following definitions. Let {X(t), t=1, 2, . . . , N} be a real-valued time series of length N. Then, for any fixed real value ω, let AN(ω) and BN(ω) be a minimizer of

Σ|X(t)−[A cos(ωt)+B sin(ωt)]|,

where Σ denotes the sum over t=1, 2, . . . , N. The Laplace periodogram of {X(t)} is defined as

LN(ω)=0.25N{[AN(ω)]2+[BN(ω)]2}.

[0018]The novel Laplace periodogram as defined may be used as a spectral analyzer for analyzing the serial dependence of a time series, which ability may be verified by the following postulate. That is:

[0019]If {X(t)} is a (zero-mean, zero-median) stationary process having a marginal probability density f(x), then, as N approaches infinity, LN(ω) is distributed as

0.5η2S(ω)Z,

where Z represents a random variable which has a chi-square distribution with 2 degrees of freedom, η2=1 / [2f(0)]2, and S(ω) is the zero-crossing spectrum of {X(t)} defined as

S(ω)=Σγ(τ)cos(ω...


PUM


Abstract

A method of analyzing a spectrum of one-dimensional or multi-dimensional signal X(t) requires a number of steps including deriving coefficients [AN(ω), BN(ω)] of an Lp-norm harmonic regression of tie signal with 0<p≦∞ and pγ2, squaring the coefficients, summing the squared coefficients, and scaling the summed, squared coefficients with a constant c to realize a periodogram of X(t) as LN(ω)=c{[AN(ω)]+[BN(ω)]2}. The method may include receiving the signal X(t), storing the received signal X(t), and outputting the periodogram LN(ω). The method may still further include scanning to maximize the periodogram LN(ω) by identifying its largest peak(s) and comparing the amplitude of the identified largest peak(s) with a threshold to determine if the largest peak(s) is(are) attributable to a presence of a periodic signal. The coefficients are preferable derived from a time series signal X(t), t=1, 2, . . . , N, but may include receiving a continuous-time signal and converting it to the time series signal.

Description

BACKGROUND OF THE INVENTION [0001]The present invention relates to spectral analysis, and more particularly relates to a method for robust spectral analysis, suitable for both light-tailed and heavy-tailed data, a spectral analyzer, signal detector and receiver system, which operates in accordance with the novel spectral analysis method.[0002]The spectral density or power spectral density of a signal describes how the energy or variance of a signal or time series is distributed with frequency. Spectral analysis is a widely used method for analyzing the serial and mutual dependence of one-dimensional and multi-dimensional time series data, and has important applications in science and engineering. For example, spectral analysis is applied in signal and image analyses, target detection techniques, pattern recognition and frequency estimation analyses. If f(t) is a finite-energy (square integrable) signal, the spectral density (Φ(ω)) of the signal is the square of the magnitude of the ...

Claims


Application Information

Patent Timeline
IPC IPC(8): G06F17/18
CPCG06F17/141G01R23/16
Inventor LI, TA-HSIN
Owner TAIWAN SEMICON MFG CO LTD
Learn More