System and Methods Using Quantum Dots as General Dosimeters
a general dosimeter and quantum dots technology, applied in the field of ionizing radiation detection, can solve the problems of inconvenient methods, and achieve the effect of reducing absorption and reducing peak amplitud
- Summary
- Abstract
- Description
- Claims
- Application Information
AI Technical Summary
Benefits of technology
Problems solved by technology
Method used
Image
Examples
example 1
Photoluminescent Peak Amplitude
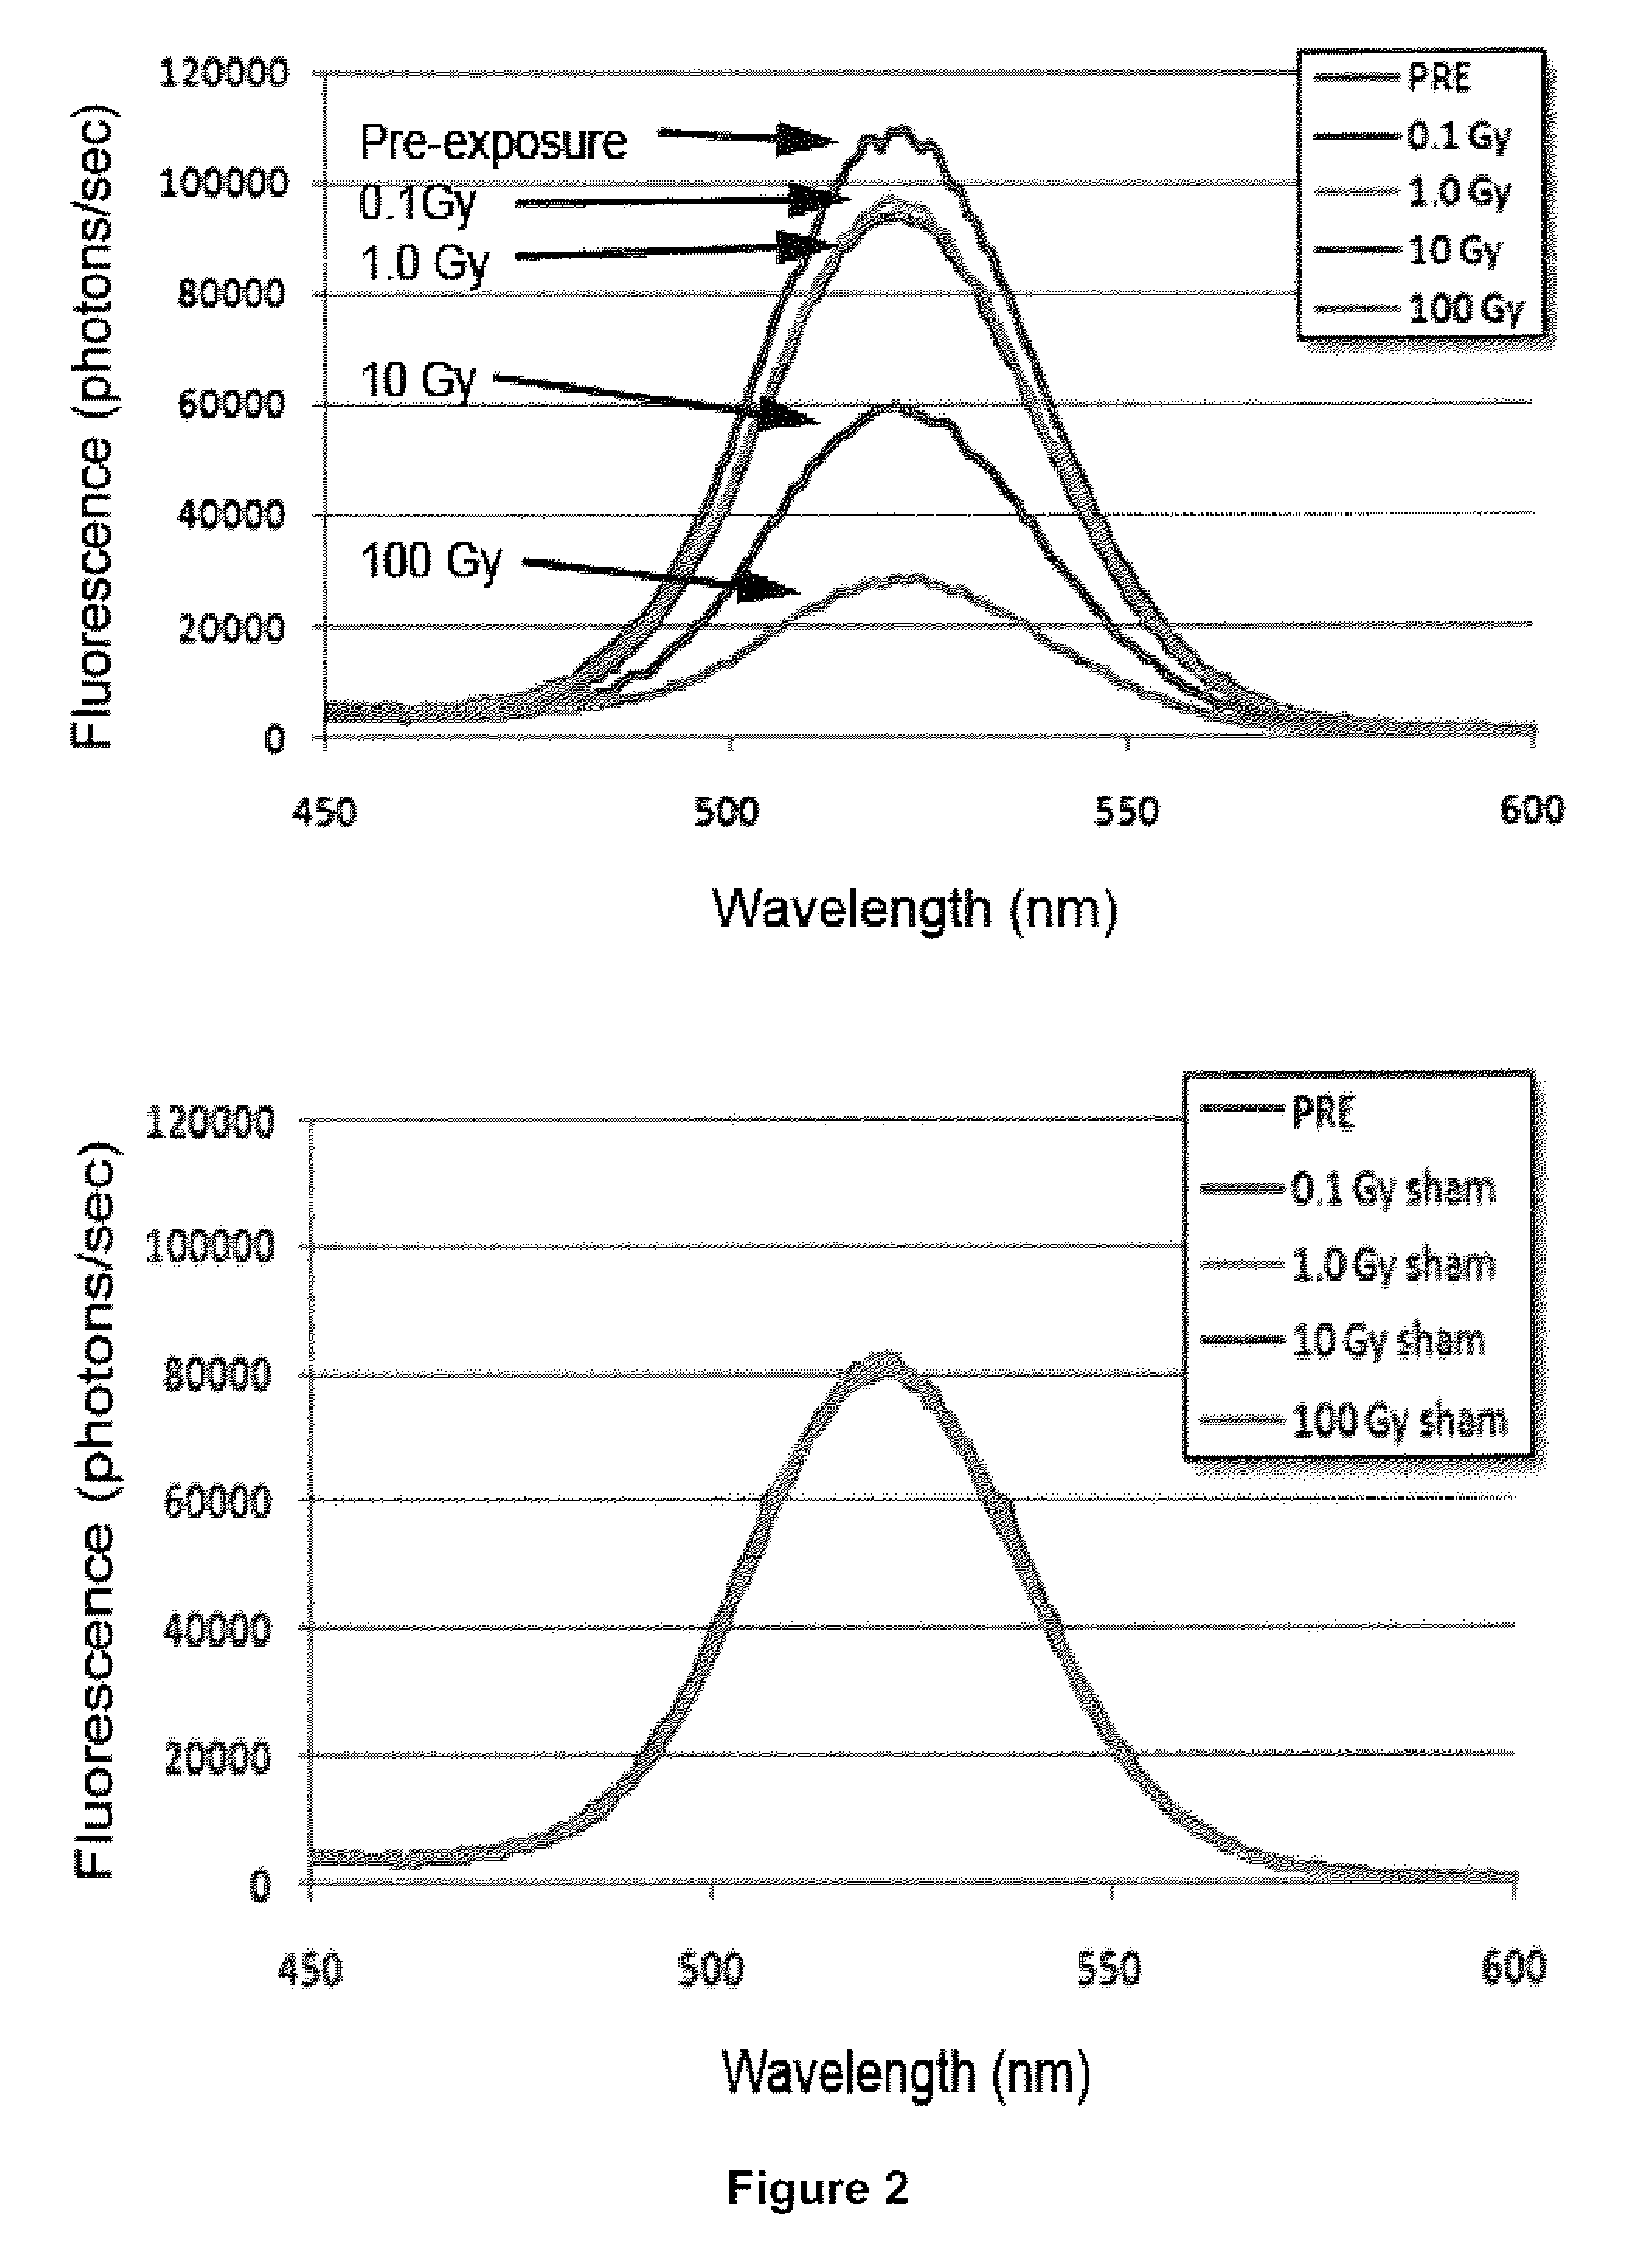
[0096]The following example demonstrates changes in QD photoluminescence as a result of exposure to ionizing radiation. The QDs in this example are most sensitive to changes between 1.0 and 100 Gy. The aspect of response that is considered here is a decrease in amplitude of a peak in the photoluminescence spectrum. Quantum Dots: CdSe / ZnS QDs were prepared according to Aldana et al [2001], Yu et al and Jakubek et al [2008], comprised of a 2-nm diameter CdSe core, with three 0.3-nm thick ZnS monolayer coatings (total QD diameter ˜4 nm), with a 524 nm fluorescence peak. For the irradiation experiment, 6 samples were prepared from this ensemble, each comprised of 0.300 g of as-prepared QDs suspended in 30 ml hexane. Each sample was contained in a sealed quartz cuvette with a 1-cm pathlength. Three samples were prepared for irradiation, and 3 reserved as unexposed controls. Irradiation: QDs were irradiated with a Co-60 teletherapy source (1.17 and 1.33 MeV ...
example 2
Photoluminescent Peak Position
[0097]The following example demonstrates changes in QD photoluminescence as a result of exposure to ionizing radiation. The QDs are most sensitive to changes between 1.0 and 10 Gy. The aspect of response that is considered here is a shift in a peak in the photoluminescent spectrum, following a decomposition of the peak into 3 components.
[0098]Preparation of QDs and irradiation was identical to Example 1. Spectroscopy: <1 min after each irradiation, all samples were interrogated by fluorescence spectroscopy (excitation at 380 nm by a xenon arc lamp; fluorescence measured from 450 to 600 nm by a scanning monochrometer coupled to a photomultiplier tube), and emission spectra fit to a 3-component mixed Gaussian model. Results shown in FIGS. 3 and 4.
[0099]In photoluminescent spectroscopic analysis, amplitude measurements (presented in Example 1) are dependent upon the signal strength, and hence the concentration of QDs in solution. Changes in peak position, ...
example 3
Tuning Nanocrystals to Different Sensitivities of Ionizing Radiation
[0100]This example demonstrates changes in QD photoluminescence as a result of exposure to ionizing radiation, and demonstrates that QDs can be tuned to have different sensitivities. Two ensembles of QDs are compared. The first ensemble, tuned for sensitivity between 1.0 and 100 Gy, was comprised of regular quantum dots with a CsSe core and ZnS shell. The second ensemble, tuned for sensitivity between 0 and 0.5 Gy was comprised to CdSe Magic Sized QDs. Results shown in FIG. 5.
PUM
 Abstract
Description
Claims
Application Information
 - R&D
- Intellectual Property
- Life Sciences
- Materials
- Tech Scout
- Unparalleled Data Quality
- Higher Quality Content
- 60% Fewer Hallucinations
Browse by: Latest US Patents, China's latest patents, Technical Efficacy Thesaurus, Application Domain, Technology Topic, Popular Technical Reports.
© 2025 PatSnap. All rights reserved.Legal|Privacy policy|Modern Slavery Act Transparency Statement|Sitemap|About US| Contact US: help@patsnap.com


