Source rock volumetric analysis

a source rock and volumetric analysis technology, applied in the field of source rock volumetric analysis, can solve the problems of increasing the difficulty of determining the required empirical parameters in unconventional reservoirs, increasing the difficulty of determining the required empirical parameters, and increasing the difficulty of determining the formation water resistivity, so as to reduce or eliminate the erroneous toc values, increase the compressional slowness of source rocks, and competitive advantage

Inactive Publication Date: 2011-06-16
CONOCOPHILLIPS CO
View PDF11 Cites 39 Cited by
  • Summary
  • Abstract
  • Description
  • Claims
  • Application Information

AI Technical Summary

Benefits of technology

[0021]Since SW is determined directly, an SW equation can be rearranged to determine porosity directly. The same assumptions traditionally needed to compute SW will be needed to compute porosity; however, the entire process has been simplified and those assumptions are not carried through SW to other calculations. Additionally, the Passey method (1990), a widely-used source rock evaluation technique for quantifying total organic carbon, becomes more robust when using the DeltaLogR calculated from R0 and RT directly. Using the log of RT minus the log of R0 with the Passey workflow in place of DeltaLogR reduces or eliminates erroneous TOC values calculated in clay-poor formations. The disclosed invention also provides a new method for determining TOC volume directly, independent of all existing methods.
[0022]Archie demonstrated SW, the fraction of pore space filled with water, to be proportional to the nth root of the ratio of resistivities R0 and RT. For source rocks, the deviation in resistivity over and above the value of the native condition, R0, is attributed to the fact that organic matter has produced fluid hydrocarbons and those fluids have displaced native formation waters. Indirectly, it is the product of both the existence of TOC and its maturation that results in the resistivity effect exploited above. In accordance with observations made by Passey, as well as with compre...

Problems solved by technology

As the petroleum industry pursues unconventional resources (i.e. “tight” rocks and “source” rocks), conventional interpretation methods for determining formation characteristics become difficult and more complicated to apply successfully.
Determining the required empirical parameters is more difficult (and sometimes impossible) in unconventional reservoirs due to the very low permeability of these “tight” rocks.
Also, since very little water is produced from these formations, the determination of formation water resistivity is also difficult.
Furthermore, porosity measurements are very difficult without substantial lab work on core samples or extensive logging due to the complex mineralogy often encountered in source rocks.
Finally, lab work to determine conventional empirical parameters is difficult because such tests require flowing fluids through the samples and their low values of permeability hinder one's ability to perform these tests.
Although a variety of methods have been developed to determine porosity, water saturation, and ultimately hydrocarbon content in a...

Method used


Image

  • Source rock volumetric analysis
  • Source rock volumetric analysis
  • Source rock volumetric analysis

Examples


example 1

Non-Conventional Reservoir

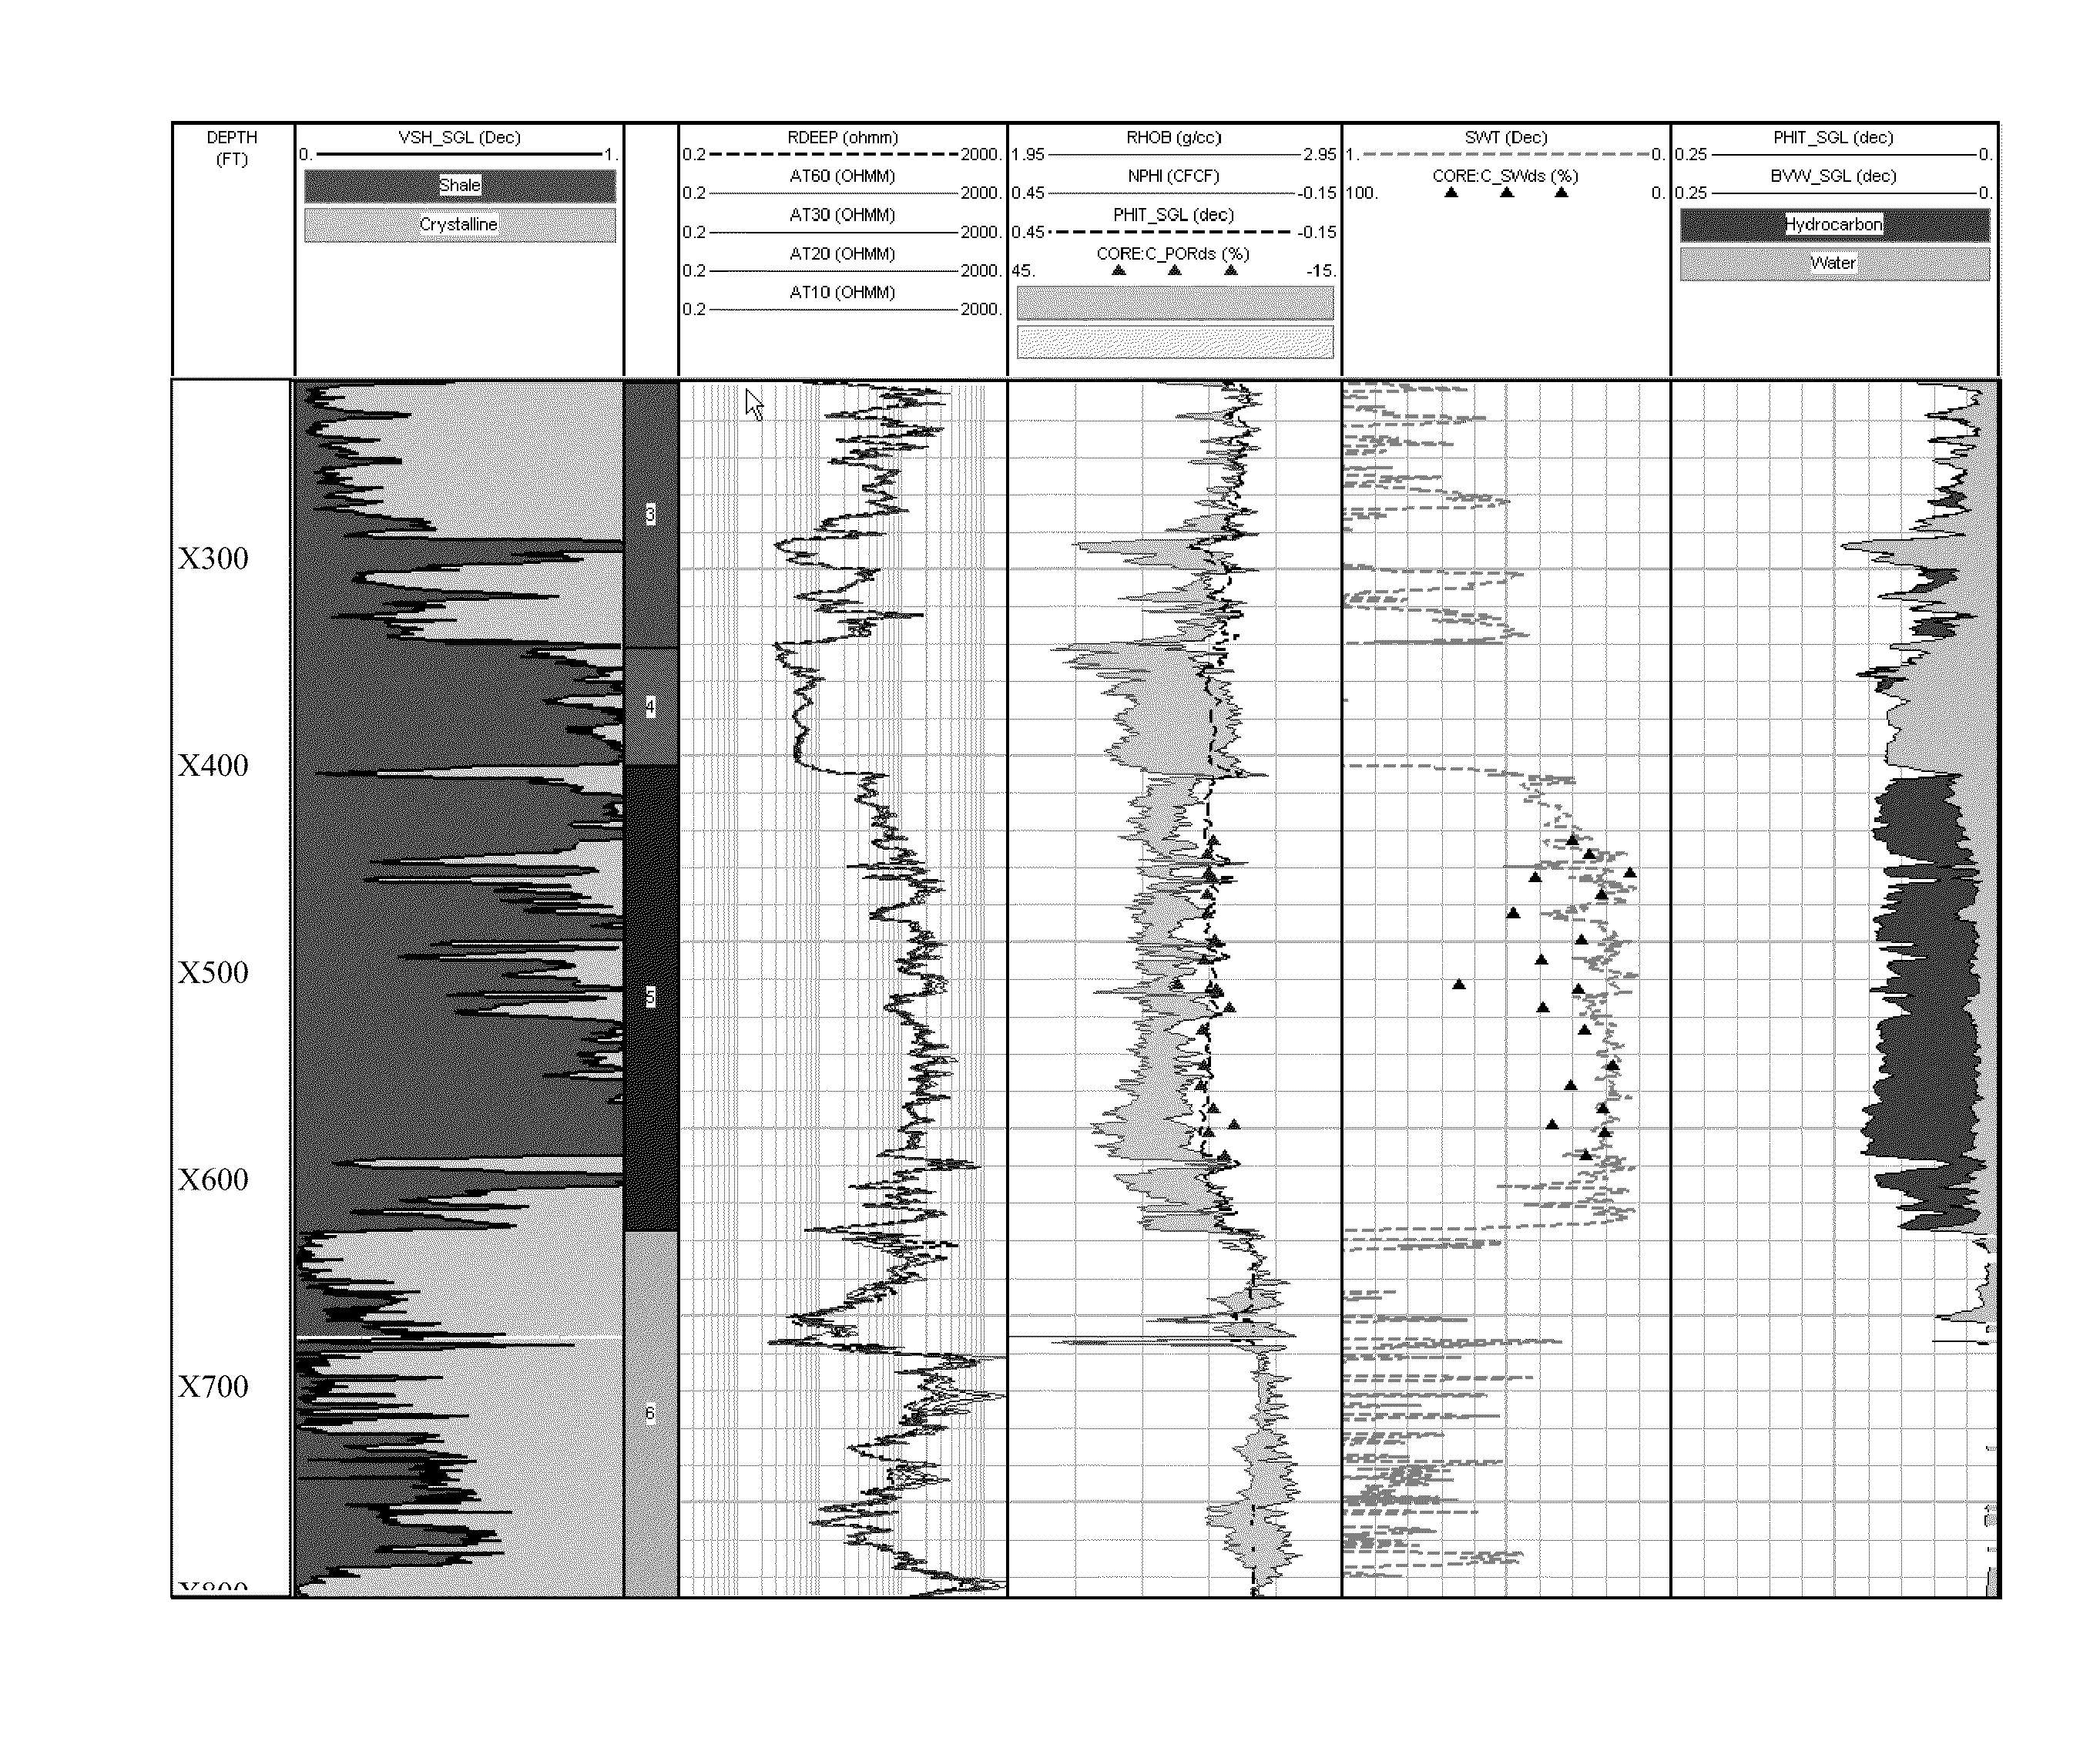
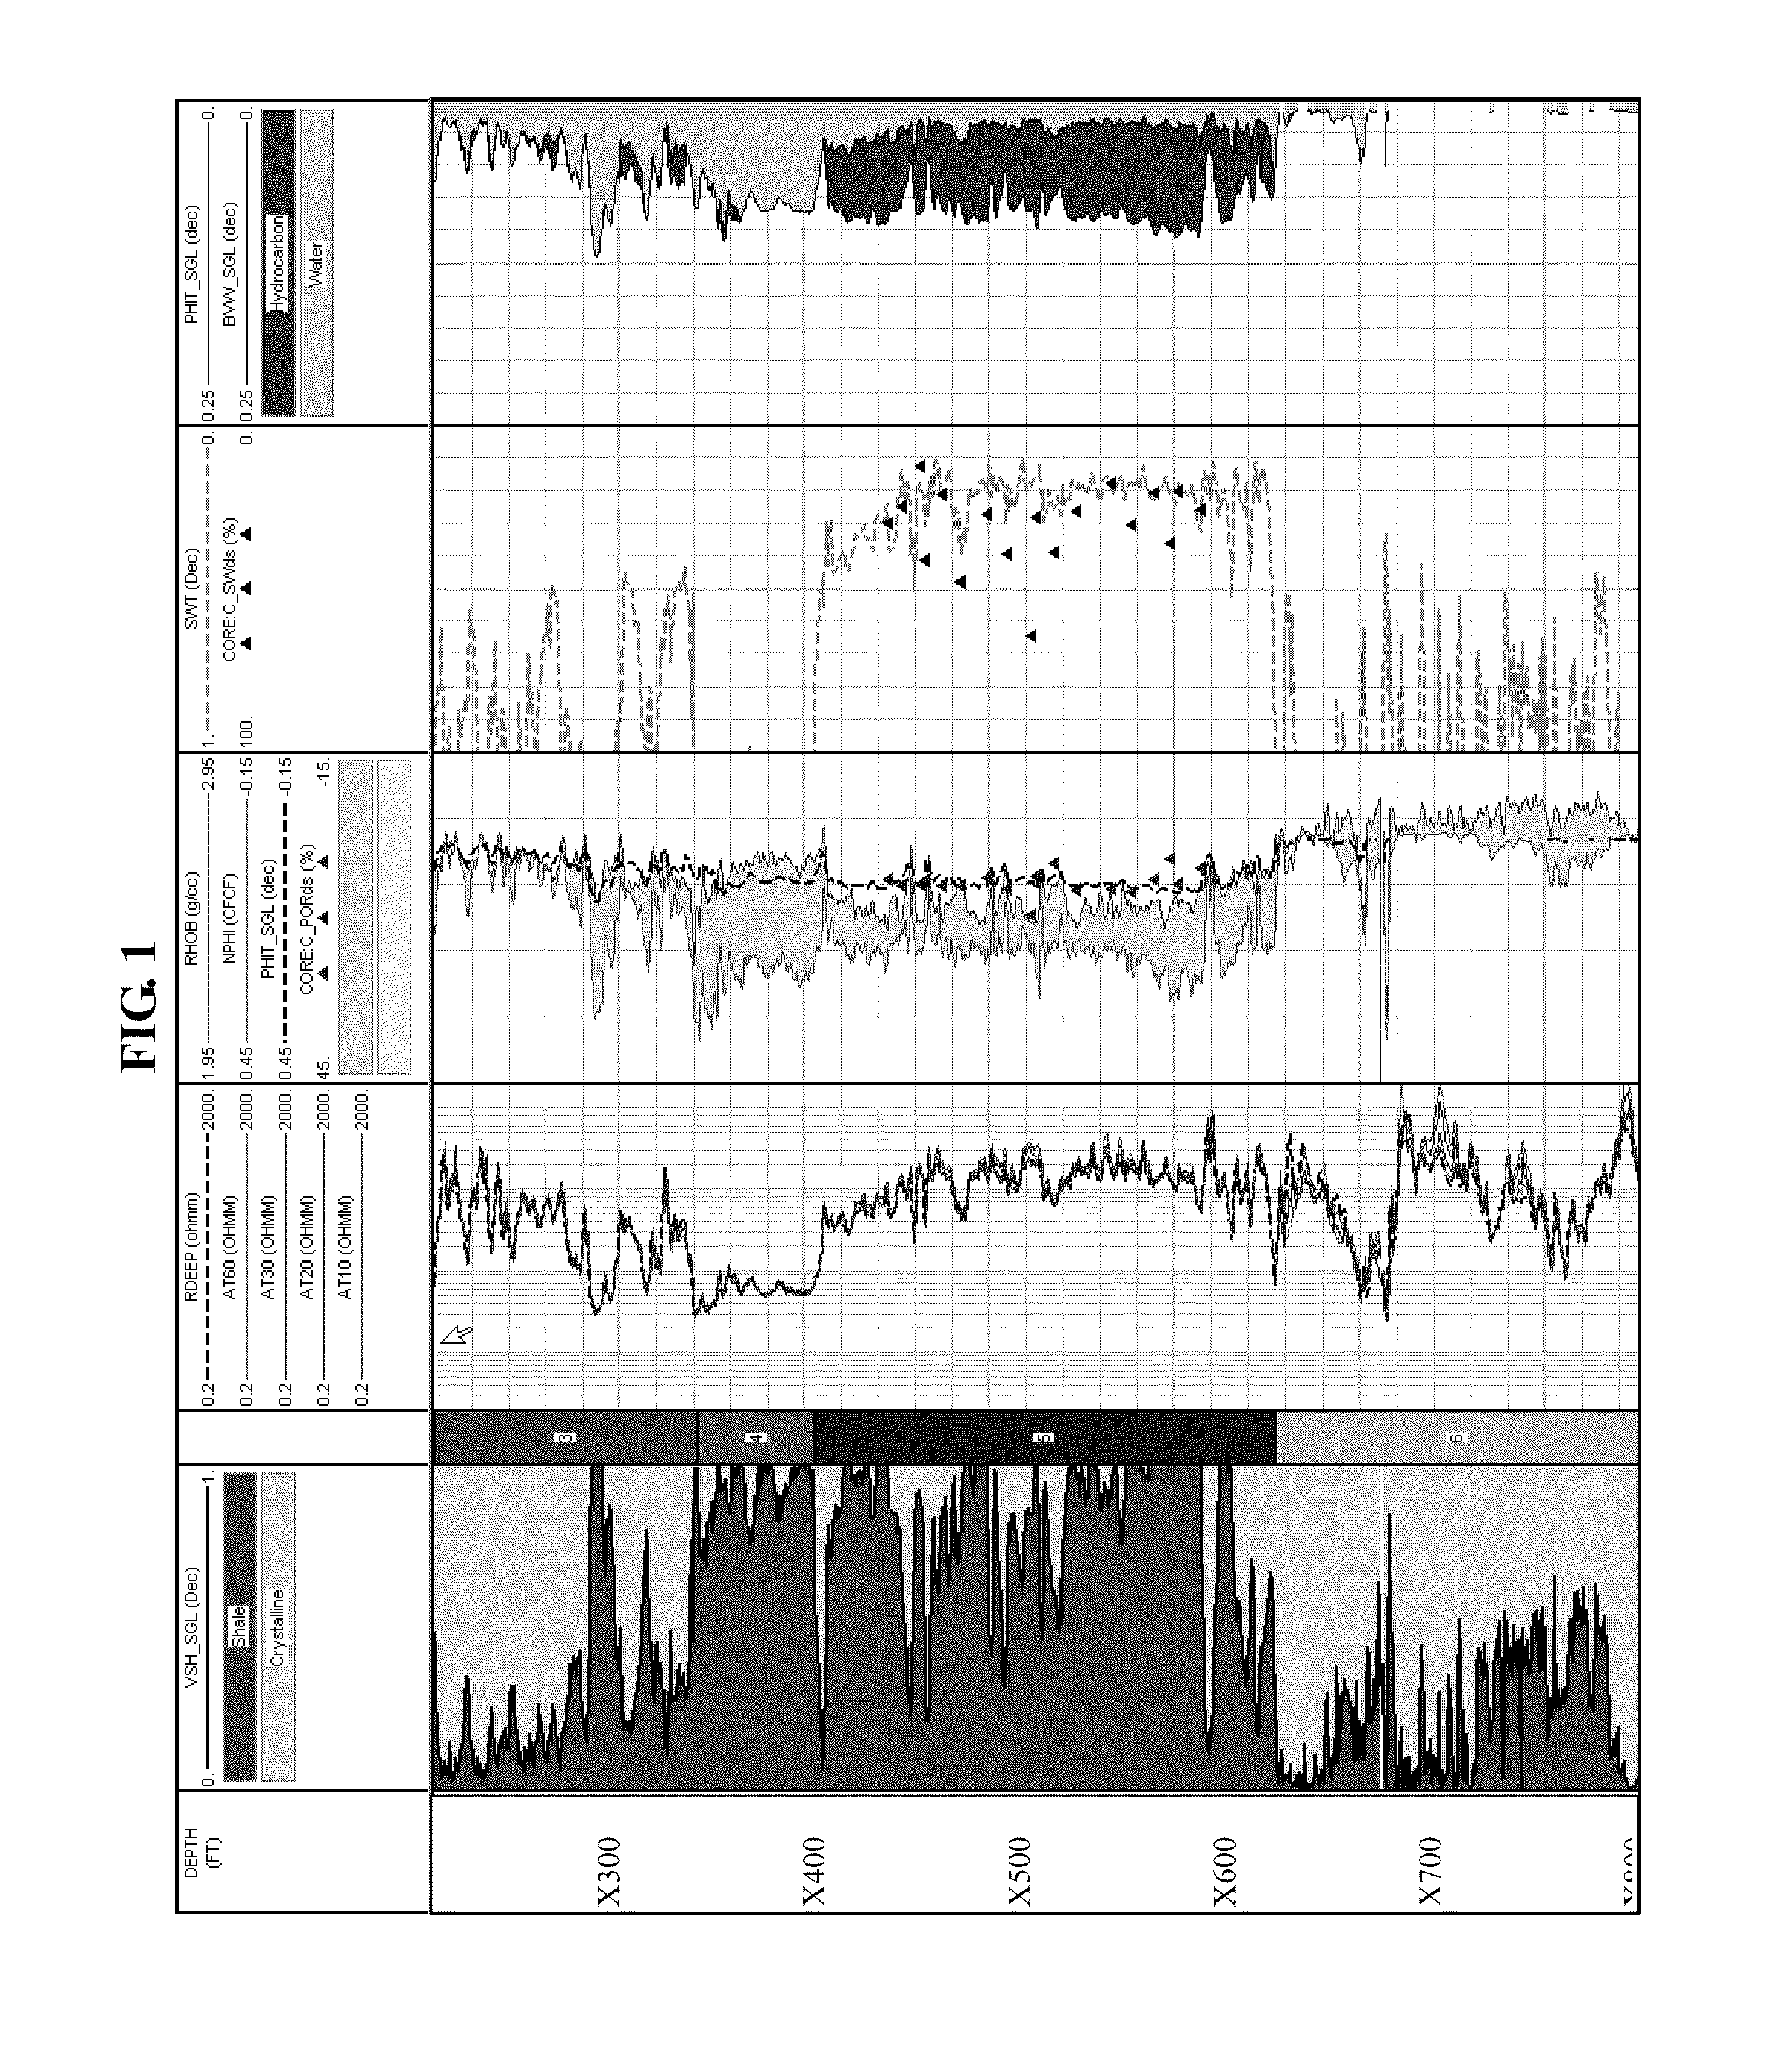
[0055]As shown in FIGS. 3-6, using single well-bore at three or more locations within the formation, resistivity was measured and used to calculate GR, porosity, Volume, Rho, TOC, and other properties of Formation I-V.

[0056]Many complex mineralogy scenarios must be accounted for to obtain an accurate measurement of saturation, porosity, resistivity, and TOC. Substantial mineral density variation, i.e. pyrite of about 5 g / cc and clay at about 2.1-2.9 g / cc, indicates that formation density measurements across all mineral types will be difficult. Additionally, kerogen formations present different problems because kerogen is not crystalline and at about 1.25 g / cc, dramatically affects standard porosity / resistivity calculations. To overcome this, our system uses standard measurements, frequently measured during routine well bore logging, to calculate throughout the formation, resistivity and porosity for non-standard, unconventional porous media including source...

example 2

Saturation Evaluation

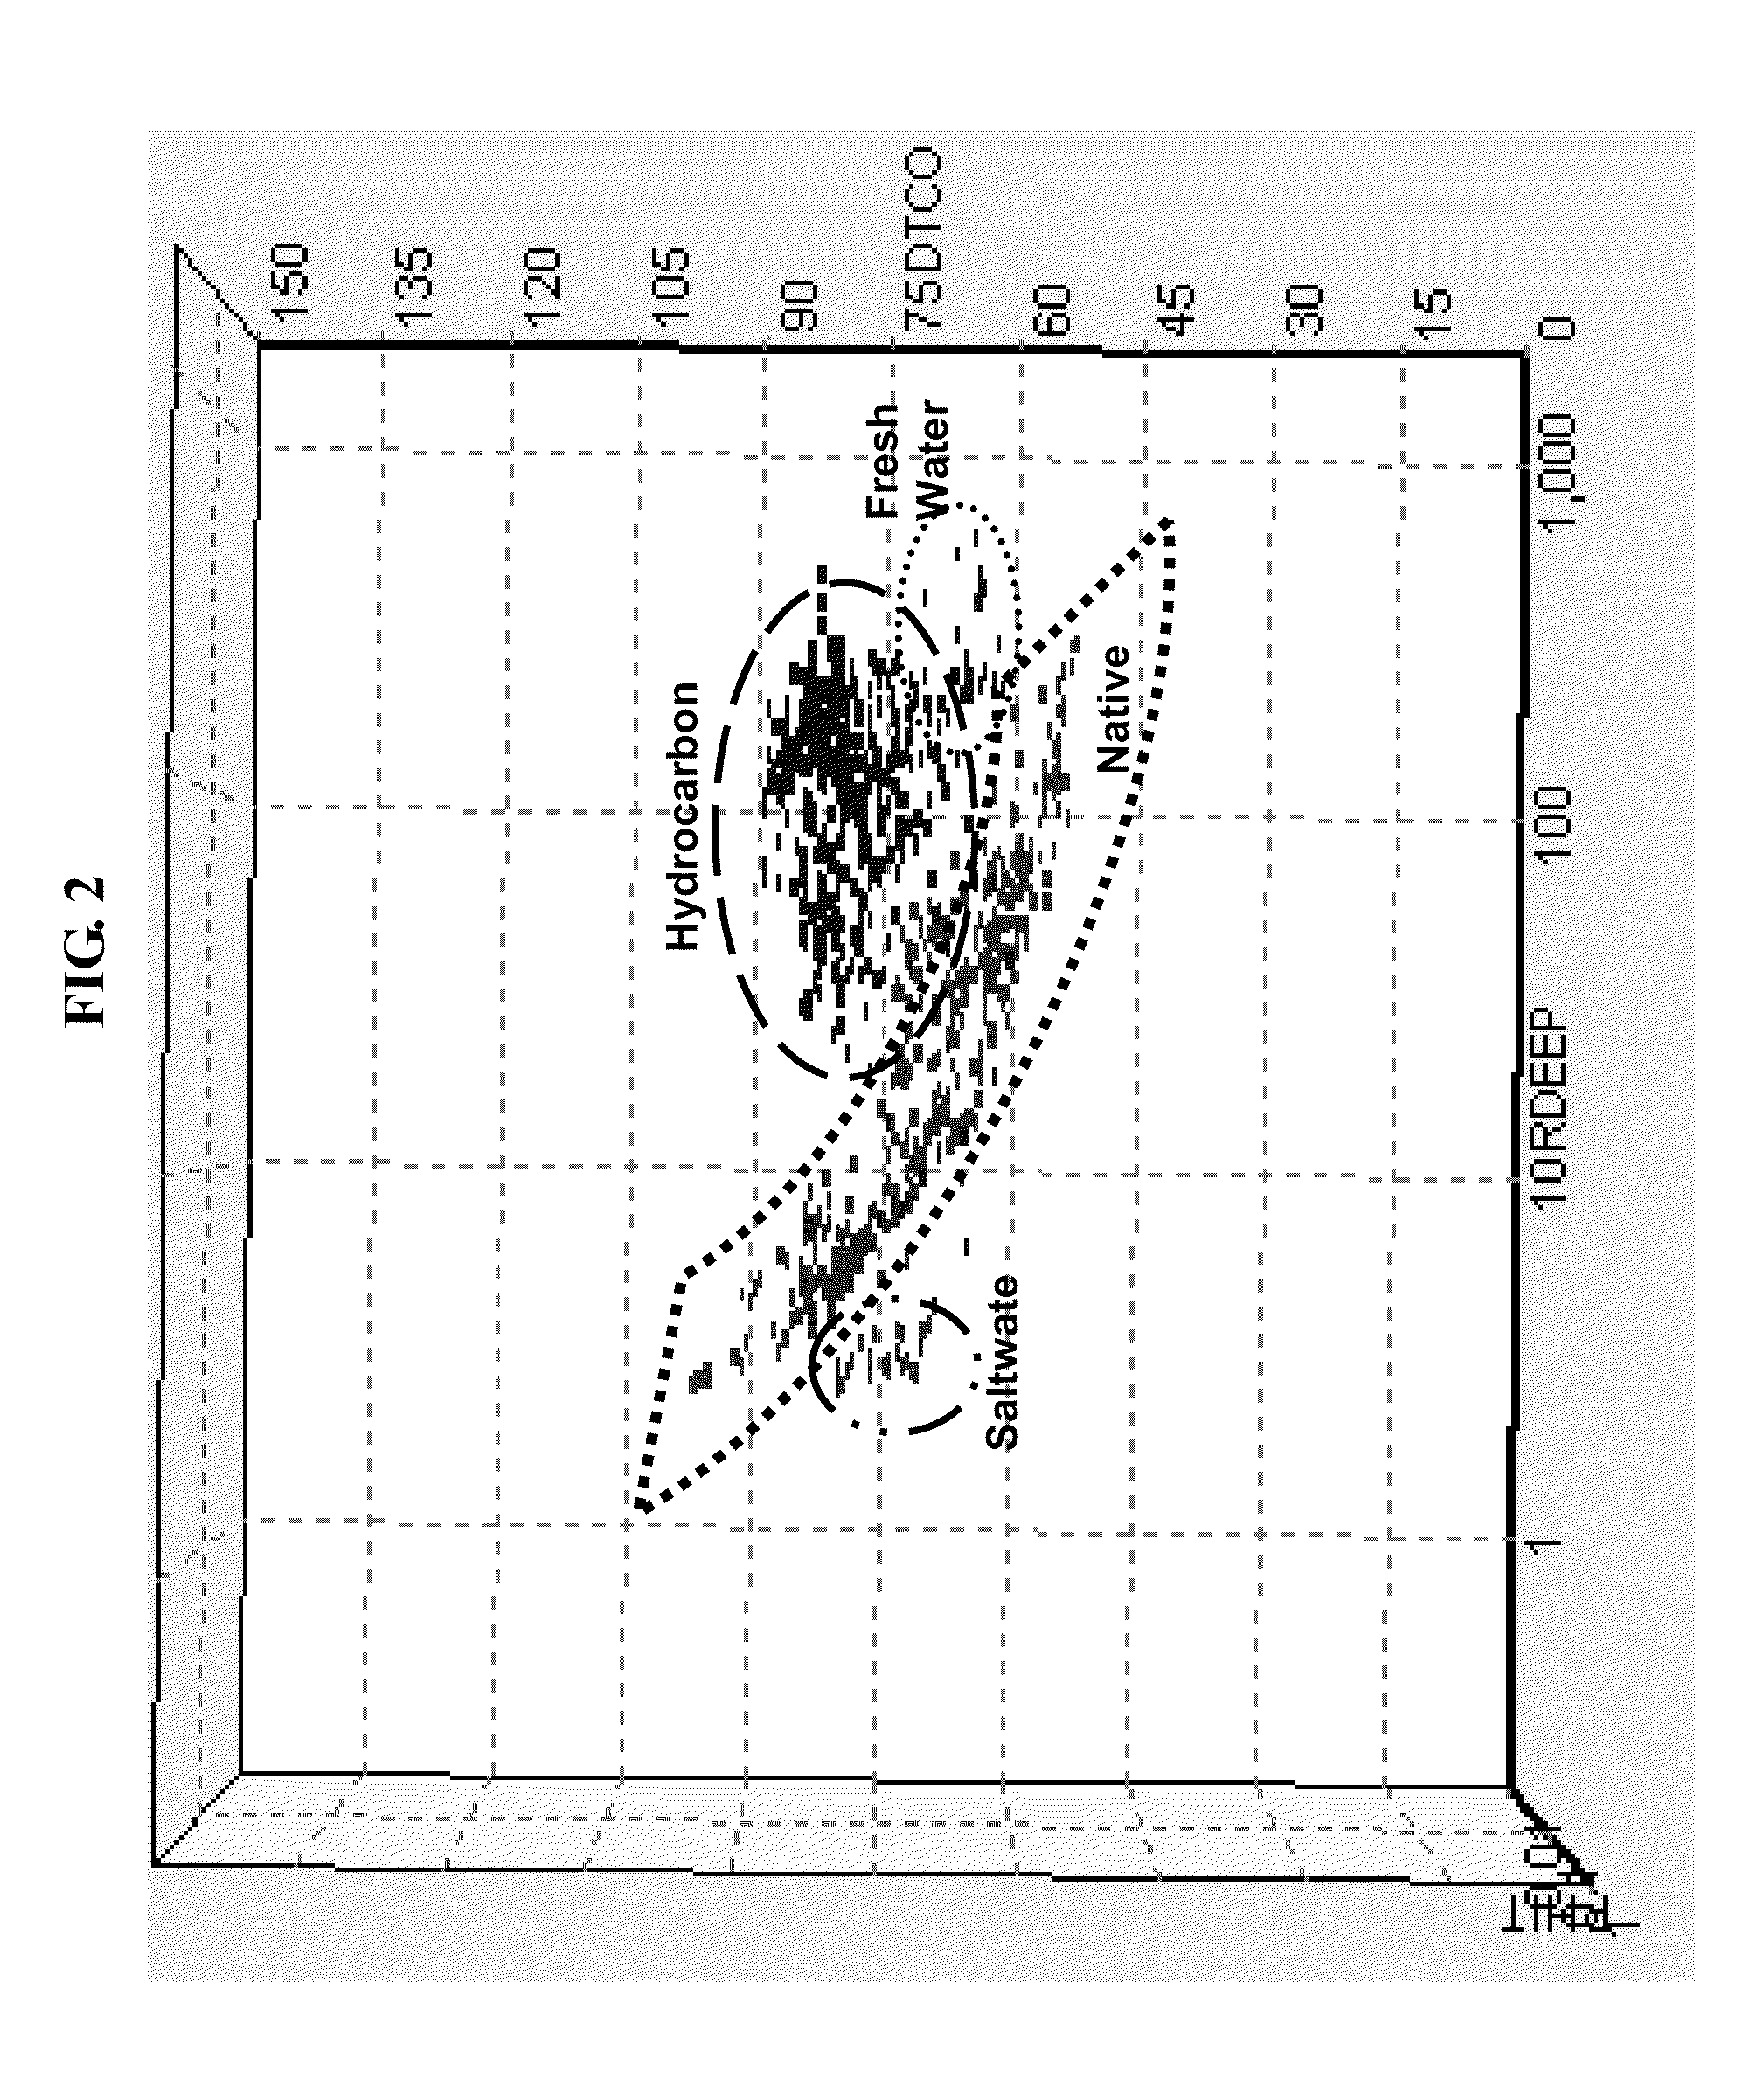
[0058]An algorithm was developed to automate the SW, porosity, resistivity and TOC calculations in situ using existing or a minimal amount of well log data. Special runs are typically not required when calculating SW using the present algorithm. By plotting resistivity vs. compressional slowness, a regression representing SW=100% is used to determine the R0 for all non-reservoir rocks. Other plots including porosity, sonic-porosity, and the like may be used for regression analysis dependent upon the data available and accuracy of the measurements. Water saturation for the entire reservoir is calculated using Archie's 1941 calculation. The regression results can be verified using standard measures of distribution, error, and mode. This calculated SW and R0 can be used in a variety of equations to determine RW, φ, VSH, TOC, ΔLogR, and other related properties.[0059]1. Locate the trend in a cross plot of resistivity vs. compressional slowness that represents the ab...

example 3

Comparing Core Data

[0096]As shown in FIGS. 3-6, a variety of formation types were analyzed using resistivity measurements. Note that in each case the calculated saturation, volume, porosity, and TOC were near actual well-bore data and accurately depicted TOC values that could be used to begin drilling and production.

[0097]In one embodiment, a software algorithm operable to a database containing subterranean formation characteristics, would produce volumetric information for each well including but not limited to, water saturation, porosity, total organic carbon, and shale volume.

[0098]SW calculations are shown for Formation I (FIG. 3), Formation II (FIG. 4), Formation III (FIG. 5), and Formation IV (FIG. 6). Even with the variety of conditions described in FIGS. 3-6, the saturation evaluation described in Example 2, provides a more accurate and complete analysis of the formations being analyzed. As seen from the core data, the hydrocarbon content can be accurately determined with a ...


PUM


Abstract

An empirical method of measuring water saturation in hydrocarbon bearing formations is described. The system described herein accurately calculates water saturation, formation volume, total organic carbon, and other formation parameters under a variety of formation conditions.

Description

PRIOR RELATED APPLICATIONS[0001]This application is a non-provisional application which claims benefit under 35 USC §119(e) to U.S. Provisional Application Ser. No. 61 / 218,701 filed Jun. 19, 2009, entitled “Source Rock Volumetric Analysis,” which is incorporated herein in its entirety.FIELD OF THE DISCLOSURE[0002]The present disclosure generally relates to methods and apparatus for determining a variety of fractional volumes associated with hydrocarbon accumulations; the knowledge of which being critical for the profitable extraction of hydrocarbons. Methods include quantifying water saturation (SW), Porosity (POR), hydrocarbon pore volume (HPV), clay volume (VCL), total organic carbon (TOC), and crystalline matrix (VCRYS) volume fractions in source rocks and low permeability formations.BACKGROUND OF THE DISCLOSURE[0003]Determining the characteristics for source rocks that enhance commercial exploitation requires knowledge of stored hydrocarbons and their accessibility from an indiv...

Claims


Application Information

Patent Timeline
IPC IPC(8): G06F19/00
CPCG01V3/20
Inventor KLEIN, JAMES D.SALAZAR, JES S M.
Owner CONOCOPHILLIPS CO
Why Eureka
Try Eureka