
Method for evaluating fluorescence correlation spectroscopy measurement data

a fluorescence correlation and measurement data technology, applied in the field of methods for evaluating fluorescence measurement data, can solve problems such as inability to use known methods, and achieve the effect of preventing unnecessary adjustment computations

Active Publication Date: 2011-08-25
CARL ZEISS MICROSCOPY GMBH
View PDF2 Cites 0 Cited by
  • Summary
  • Abstract
  • Description
  • Claims
  • Application Information

AI Technical Summary

Benefits of technology

[0012]The invention allows more refined filtering without requiring an elaborate and time-consuming adjustment computation. Finer filtering allows higher accuracy when determining the sample properties. A decision whether to perform an adjustment computation at all can then be made based on the suitability degree determined Some out of several regions can be selected for an adjustment computation while others can be discarded in this way. Alternatively, adjustment computations can be performed unconditionally for all regions and the respective suitability degree for the correlation analysis can be stored as a quality characteristic in addition to the adapted model function parameters. In this way, the results can later be filtered by suitability degree without having to perform another adjustment computation. At any rate, filtering advantageously is not tied to the value associated with one or several specific model parameters. In particular, it will be possible to distinguish sample regions that are relevant for evaluation from non-relevant sample regions even before the elaborate adjustment computation by advantageously determining the suitability degree before performing an adjustment computation for adapting a model function to the correlation. This cannot be done with the known methods, especially not in sample regions that only contain noise.
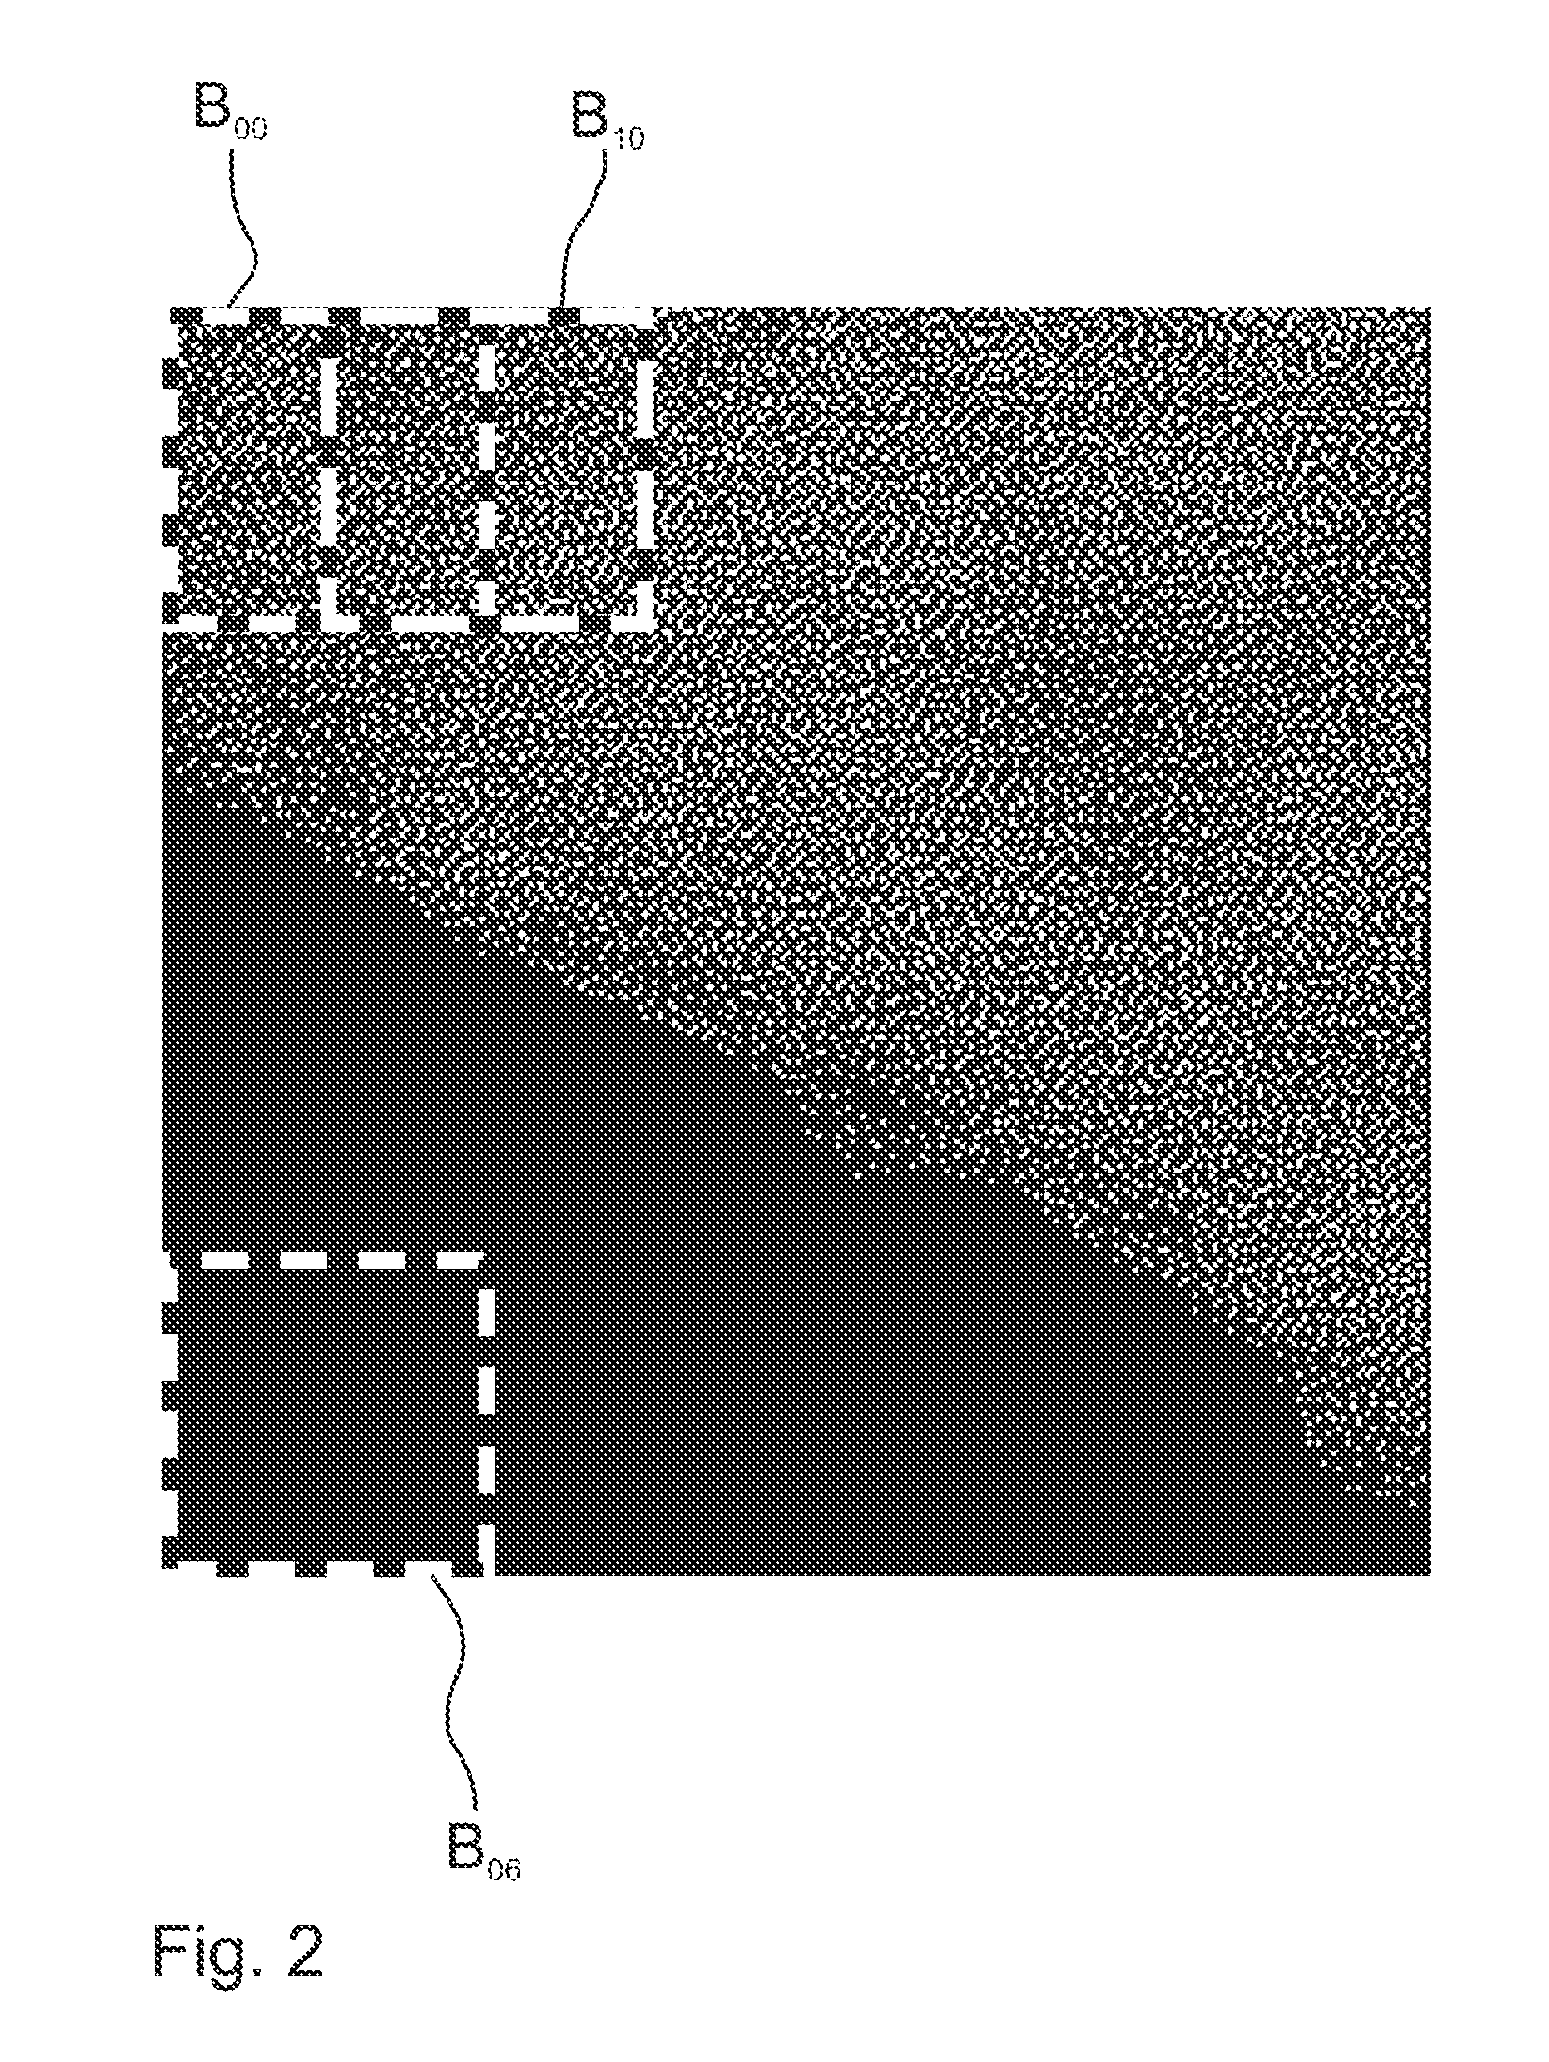
[0017]In a preferred embodiment, a proper subset of the correlation (i.e. its data points), especially a proper subset of a quadrant of the correlation, is used as the comparative set. The proper subset can be rectangular and, in particular, a square shape. This also helps to simplify and accelerate the method with almost unchanged accuracy. The corner point of the quadrant may also be the maximum of the correlation instead of the coordinate origin. Limitation to a maximum of one quadrant utilizes the fact that the information that is essential for detecting a shift is particularly contained in the fourth quadrant (relative to the correlation maximum).
[0018]It is advantageous for determining the significantly deviating correlation data points to determine a value of a statistical variable within the comparative set and to find those correlation data points significantly deviating which have a value that exceeds a threshold that can be, or is, preset relative to the value of the statistical variable. The informative data points can be found easily and fast in this way.
[0022]In a first embodiment, the respective suitability degrees are determined for multiple regions, one of the regions is selected for an adjustment computation based on the suitability degrees, and the respective adjustment computation is performed. This prevents unnecessary adjustment computations that would only affect the result adversely.
[0023]In an alternative second embodiment, adjustment computations are performed for multiple regions, and the respective suitability degree is stored with the results of these adjustment computations. This allows later filtering of the results of the adjustment computations and determining the accuracy of the model parameters. It is advantageous to first record the correlation spectroscopy measurement data using a laser scanning microscope.

Problems solved by technology

This cannot be done with the known methods, especially not in sample regions that only contain noise.

Method used


Image

  • Method for evaluating fluorescence correlation spectroscopy measurement data
  • Method for evaluating fluorescence correlation spectroscopy measurement data
  • Method for evaluating fluorescence correlation spectroscopy measurement data

Examples


Embodiment Construction

[0034]In describing preferred embodiments of the present invention illustrated in the drawings, specific terminology is employed for the sake of clarity. However, the invention is not intended to be limited to the specific terminology so selected, and it is to be understood that each specific element includes all technical equivalents that operate in a similar manner to accomplish a similar purpose.

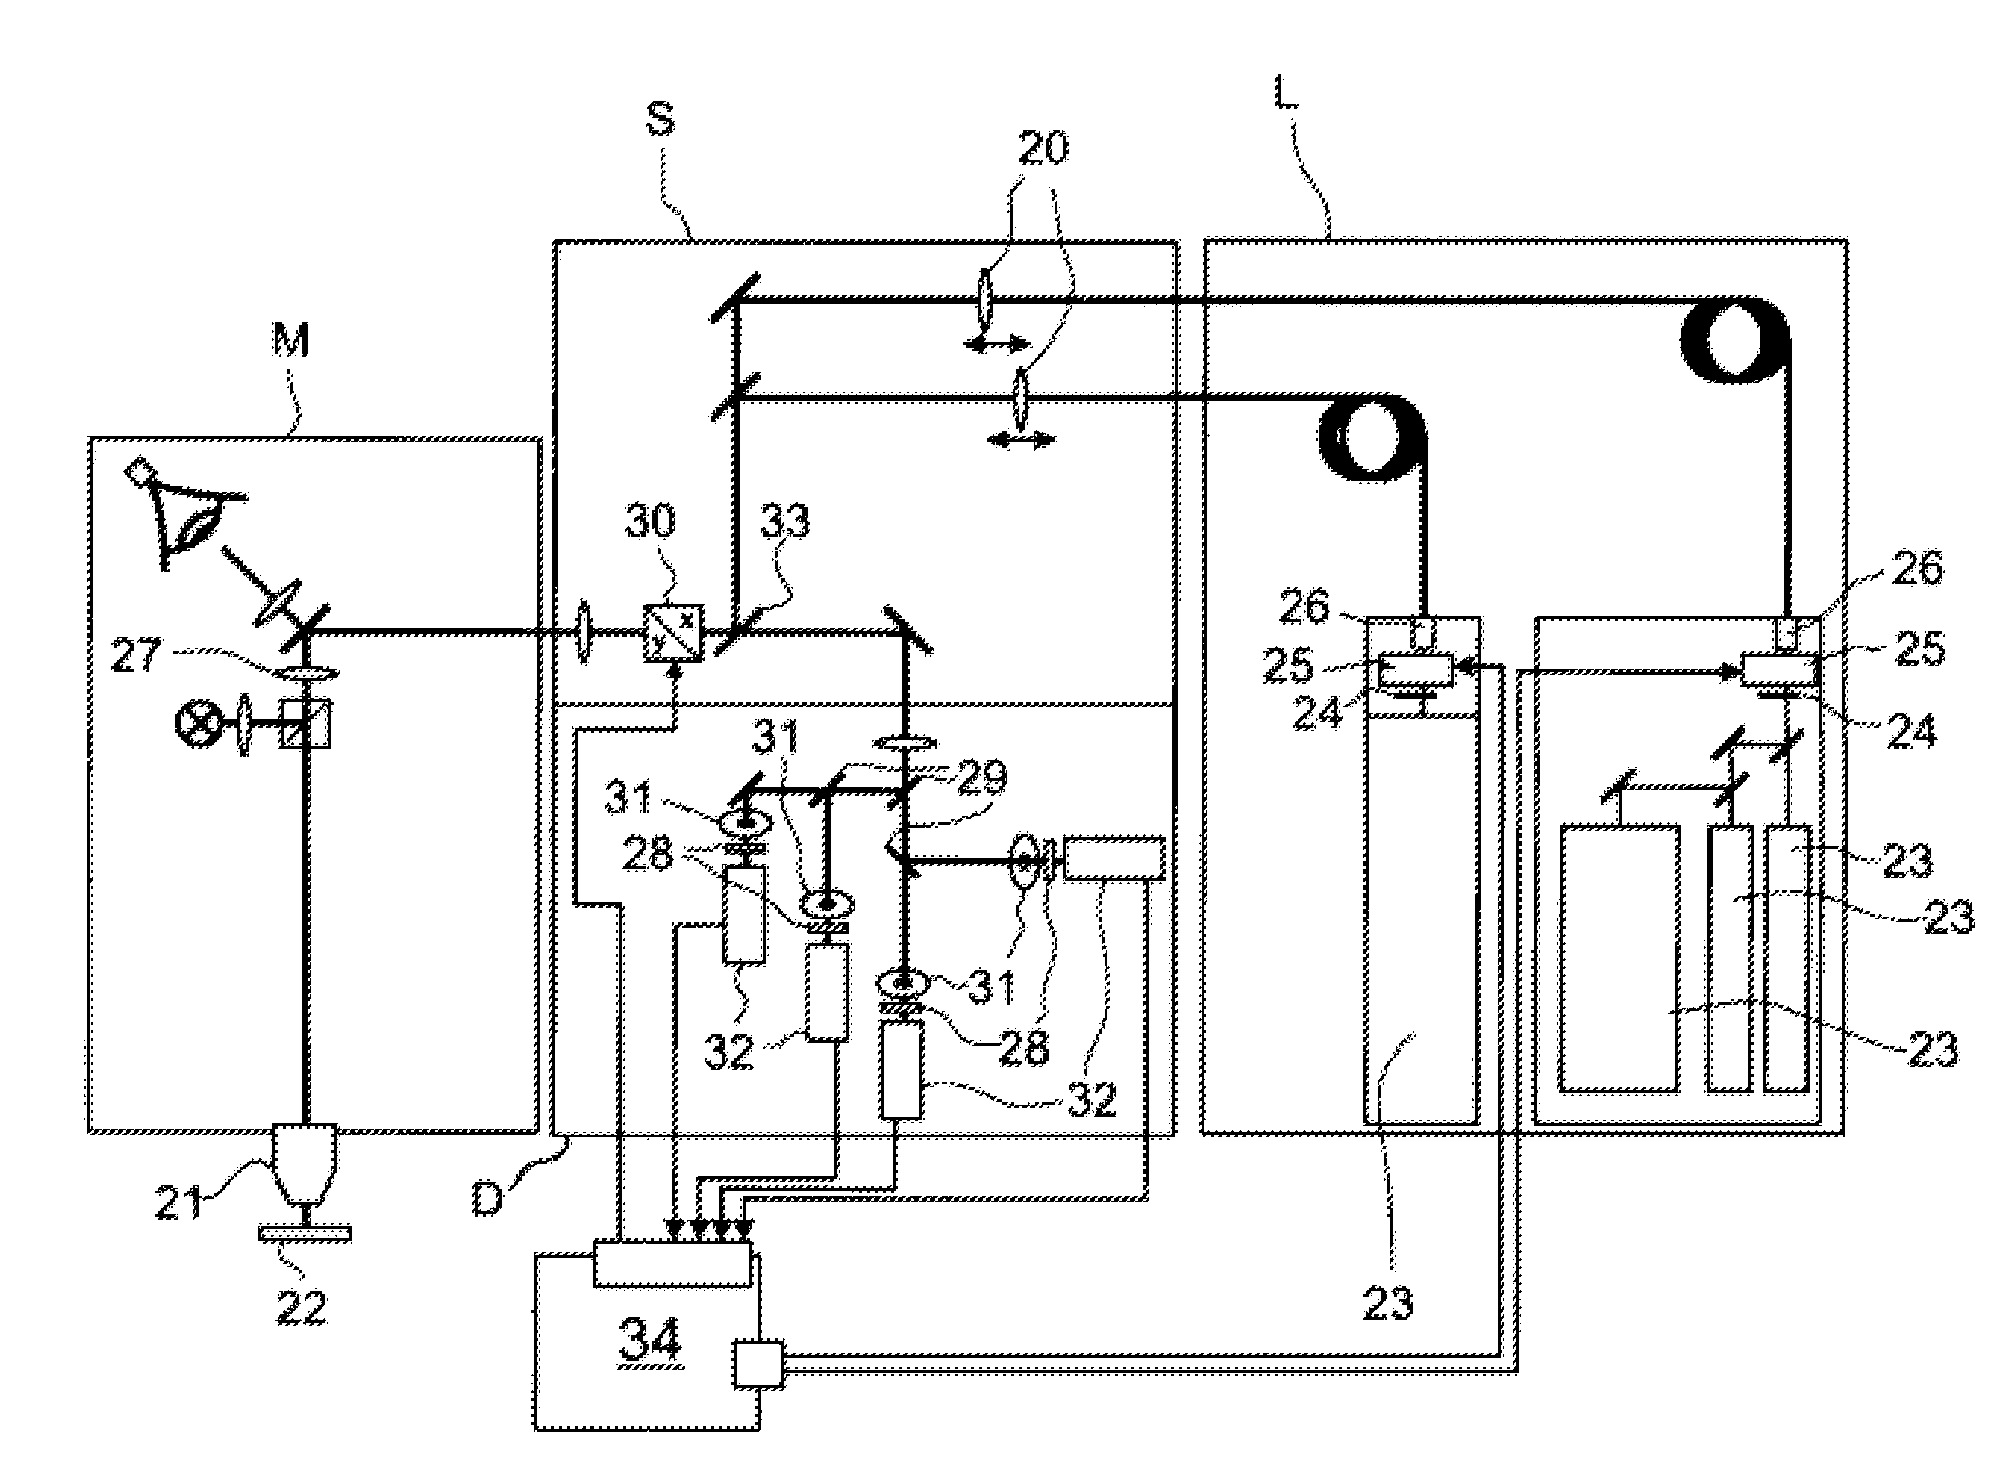
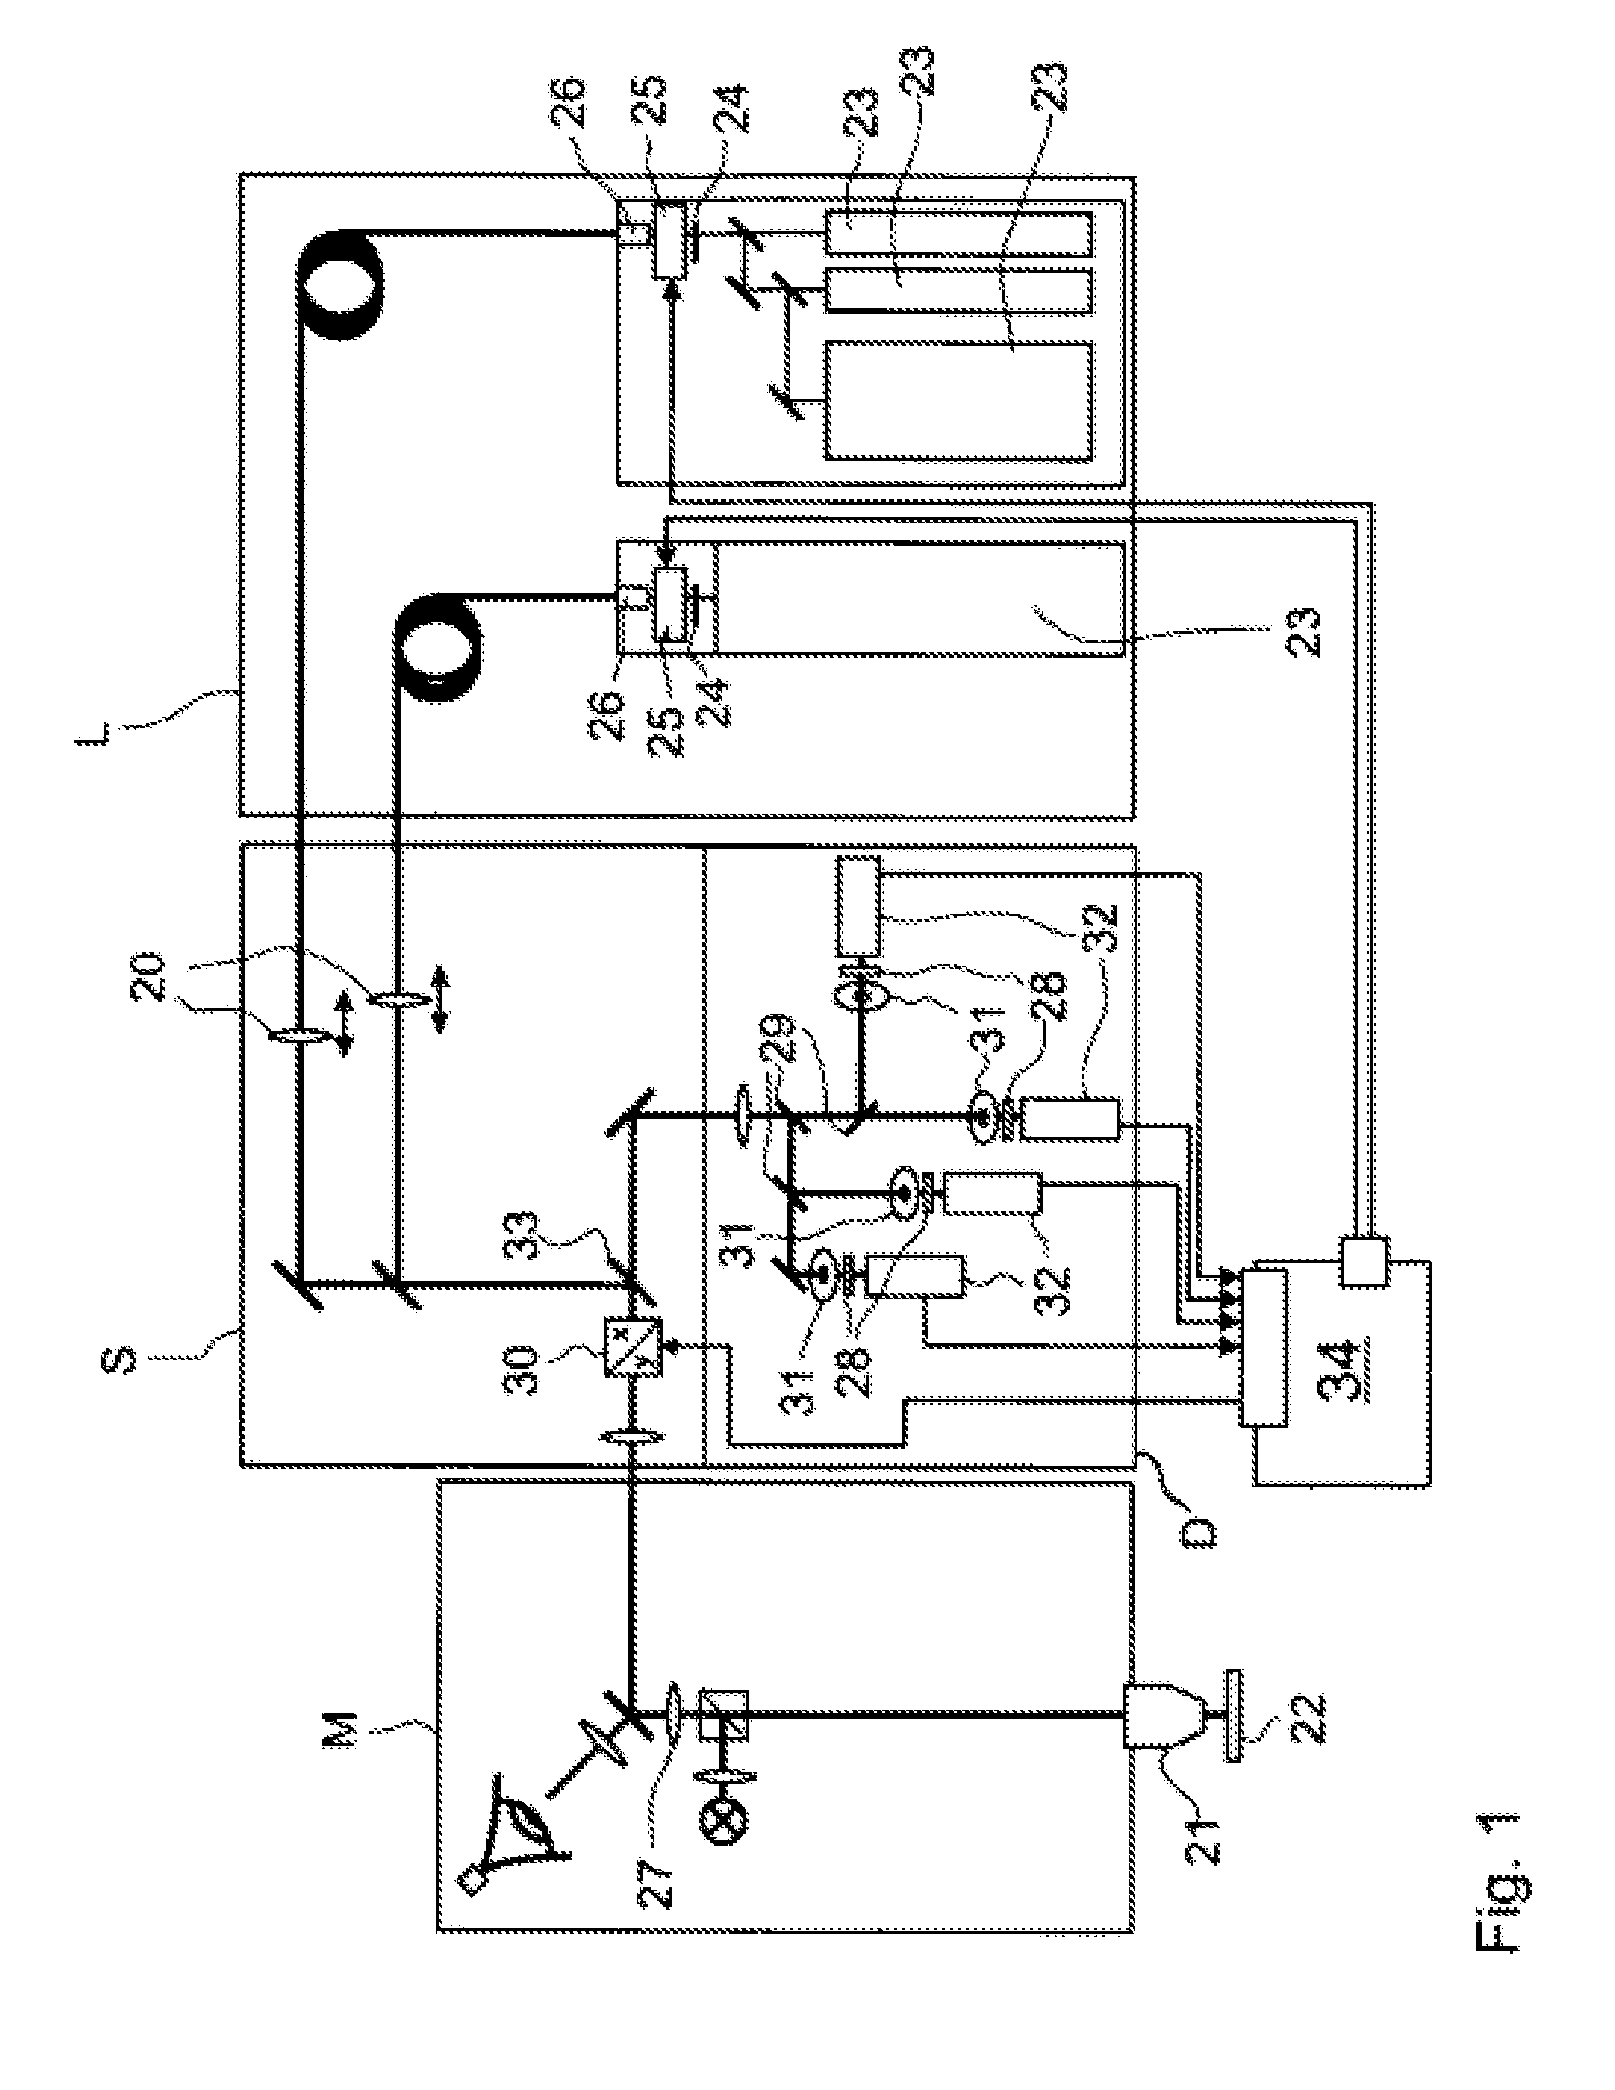
[0035]FIG. 1 is a diagrammatic view of an LSM (Laser Scanning Microscope) that is controlled using a control unit 34. The LSM is of modular design and consists of a lighting module L with lasers 23, a scanning module S, a detection module D, and the microscope unit M with the microscopic lens 21. The control unit 34 can influence the light from the lasers 23 through barn doors 24 and attenuators 25 before it is fed via optical fibers and coupling optics 20 into the scan unit S and concentrated there. The light passes via the main beam splitter 33 and the X-Y scanning unit 30 comprising tw...


PUM


Abstract

With the different methods of fluorescence correlation spectroscopy, physical and biological transport processes in or between cells in the microscopic range, for example diffusion processes, can be analyzed. For this purpose, correlations of the fluorescence measurement data are determined for different sample regions and mathematical transport models are adapted thereto. Erroneous fluorescence correlation analyses were previously identified on the basis of the properties of the adapted model function parameters and were discarded. The a-priori knowledge necessary for the identification had to be obtained in time-consuming series of tests. With the invention, sample properties can be determined in a simpler, quicker and more exact way from fluorescence correlations. A suitability degree for one or more regions of the sample is determined for a correlation evaluation, describing quantitatively the information content of the respective region, or the error to be expected from a correlation evaluation, and can thus already be used before a correlation evaluation as a criterion for filtering / selecting the respective region. In this way, elaborate correlation calculations can be dispensed with in non-informative sample regions.

Description

CROSS-REFERENCE TO RELATED APPLICATIONS[0001]The present patent application is a continuation application of International Patent Application No. PCT / EP2009 / 006819, filed Sep. 22, 2009, which is based on, and claims priority to, German Patent Application No. 10 2008 049 877.7, filed Sep. 30, 2008, both of which are incorporated herein in their entireties by reference.BACKGROUND OF THE INVENTION[0002](1) Field of the Invention[0003]The invention relates to a method for evaluating fluorescence measurement data in at least one-dimensional spatial resolution from a sample and a control unit for a laser scanning microscope.[0004](2) Description of Related Art Including Information Disclosed Under 37 CFR 1.97 and 1.98[0005]Fluorescence correlation spectroscopy (FCS) can be used to examine variable substance concentrations in the microscopic range caused by diffusion and other transport processes in a sample. Physical and biological transport processes in or through a single volume having ...

Claims


Application Information

Patent Timeline
Patent Type & Authority Applications(United States)
IPC IPC(8): G06F17/18G06F15/00
CPCG01N21/6458G02B21/008G02B21/0076
Inventor WAGNER-CONRAD, STEPHANNOVIKAU, YAUHENIWEISSHART, KLAUS
Owner CARL ZEISS MICROSCOPY GMBH
Learn More