Methods for reducing test-retest variability in tests of visual fields

a technology of visual field and variability, applied in the field of test-retest variability in visual field tests, can solve the problems of difficult to determine whether a patient's condition is stable or progressing, defects in visual field, and rapid change of sensitivity

Inactive Publication Date: 2012-07-19
THE RES FOUND OF STATE UNIV OF NEW YORK
View PDF1 Cites 11 Cited by
  • Summary
  • Abstract
  • Description
  • Claims
  • Application Information

AI Technical Summary

Benefits of technology

[0011]In an embodiment, the invention includes a method of improving or at least partially correcting test-retest variability in perimetry, comprising: recording the parameters of gaze direction, time, flash brightness and subject response to a series of test flashes at a series of locations to generate visual field results; and adjusting test-retest variability in the visual field results by accounting for gaze direction. The step of adjusting test-retest variability may comprise associating the gaze direction with the flash brightness and the patient response for each said time at a said location; constructing a spatial map of patient responses for each of a series of the said locations; and accounting for test-retest variability based upon the spatial maps.

Problems solved by technology

This makes it difficult to determine whether a patient's condition is stable or progressing, since the determination amounts to assessing the presence or absence of a trend (progression) in the presence of noise (test-retest variability).
A number of pathologies, either of the eye or of the later visual pathway, result in defects of the visual field.
Furthermore, one of the difficulties in assessing details of scotomas, and one which may be related to variability, is the question of where scotoma edges are located.
One reason why scotoma edge location is an important issue is that sensitivity can change rapidly as one crosses such an edge.
Moreover, if fixational eye movements are involved in generating test-retest variability, studying eye movements during visual field testing might illuminate the issue.
However, there have heretofore been no published studies of sensitivity near edges in which the time course of eye movements has been related to the time course of the test results (i.e., the time course of the staircase of test presentations used to arrive at the test results).
From a clinical standpoint, a frustrating aspect of visual field testing with static perimetry is that there can be a lot of variation between one test and the repeat of the same test, either on the same day or at some later time.
In a completely normal eye, this variation is not large, but in a damaged eye it can become very large.
This means that it can be difficult to tell whether a change in a test value is due to variability, or whether it is due to a real change of the underlying condition of the patient.
For example, one of the difficult aspects of glaucoma is “progression,” namely, worsening of the disease.
Test-retest variability makes assessment of progression very difficult.

Method used


Image

  • Methods for reducing test-retest variability in tests of visual fields
  • Methods for reducing test-retest variability in tests of visual fields
  • Methods for reducing test-retest variability in tests of visual fields

Examples


example 1

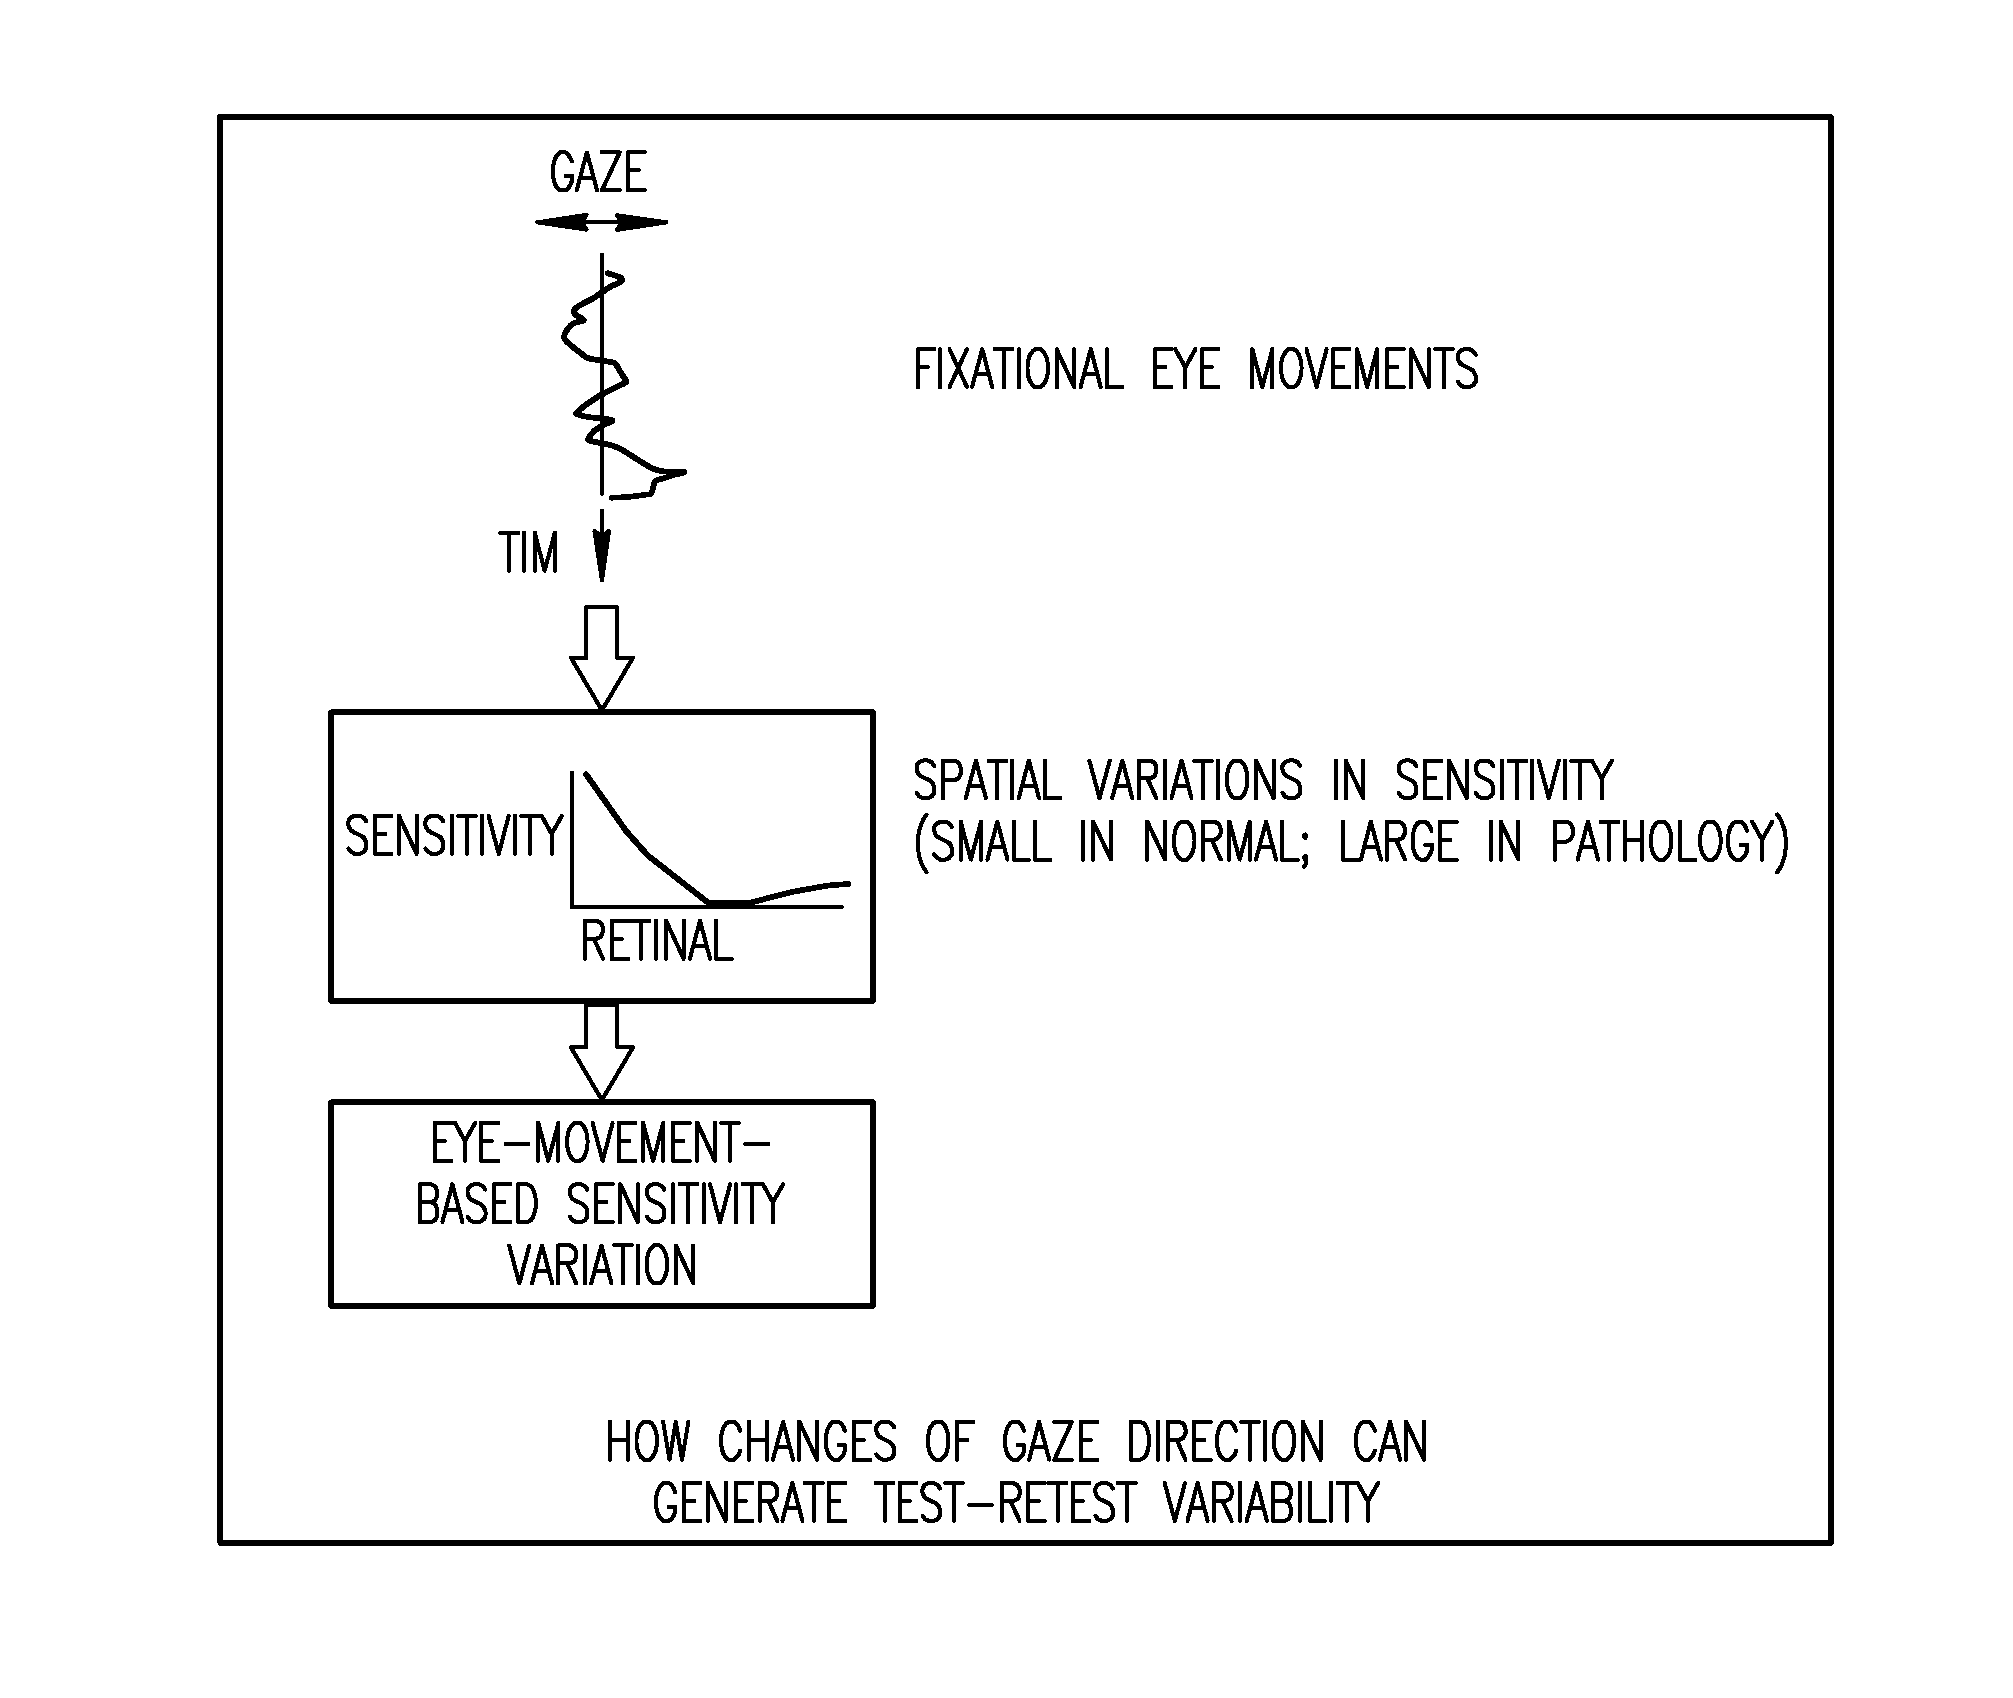
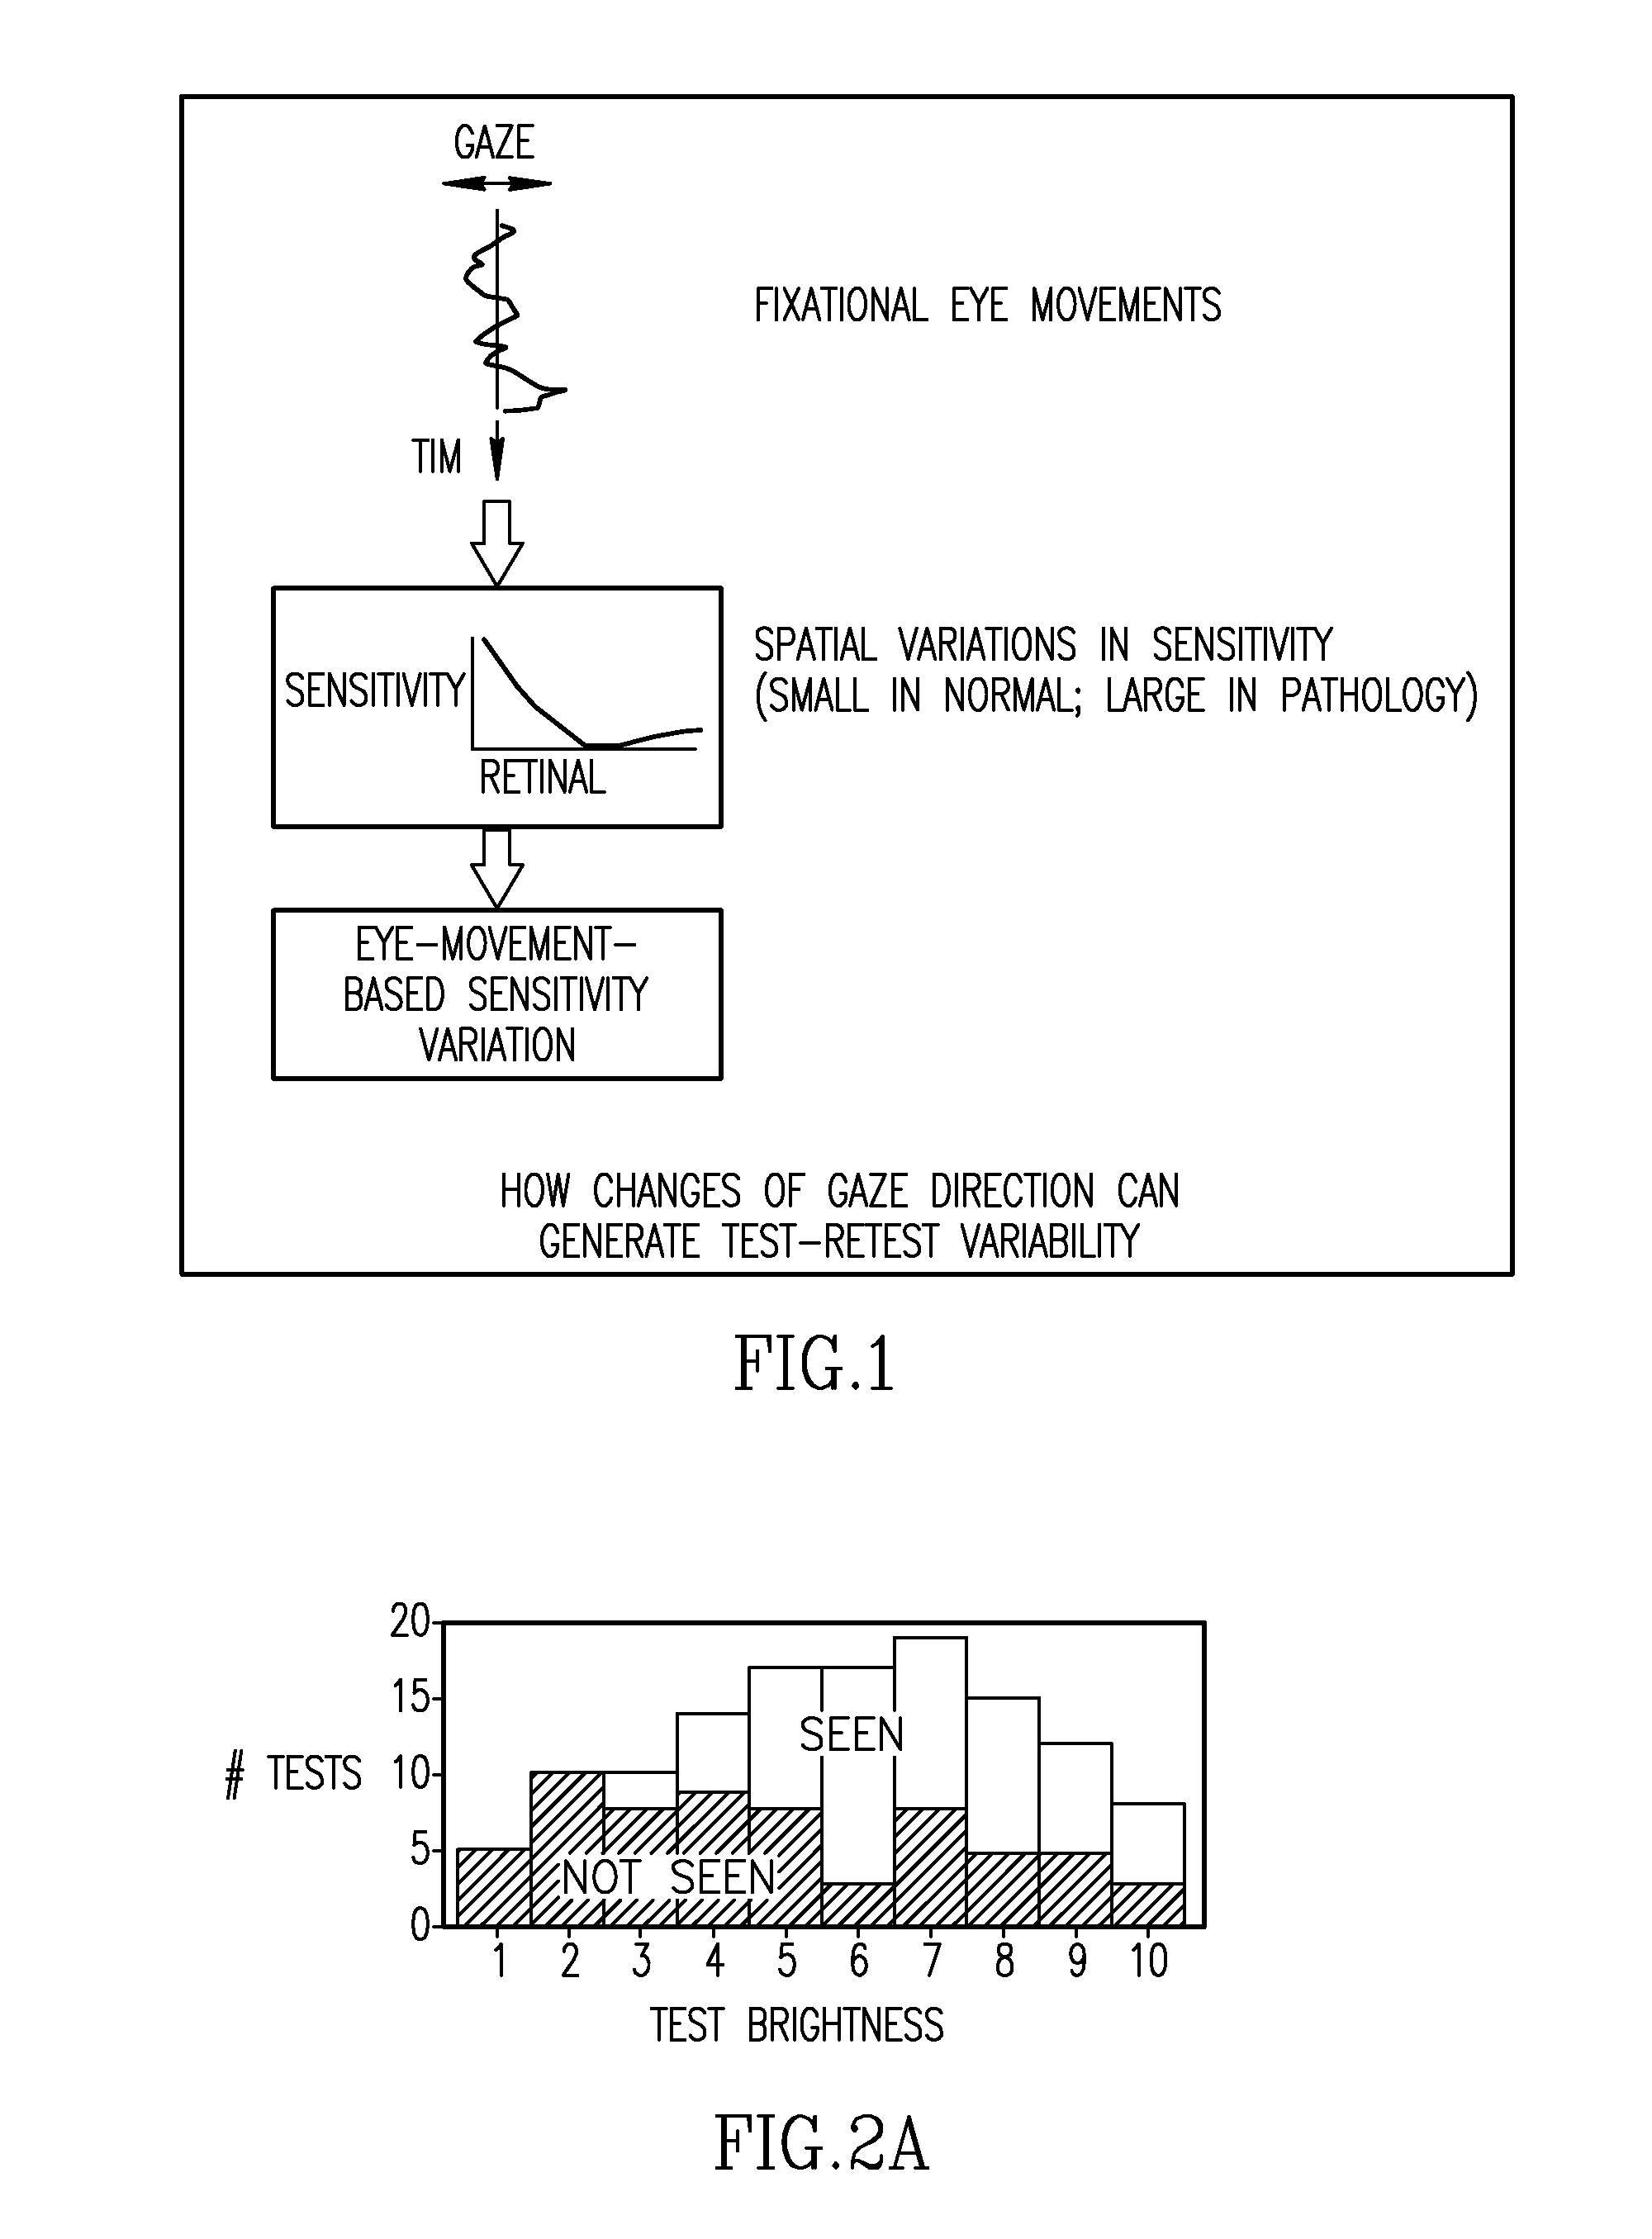
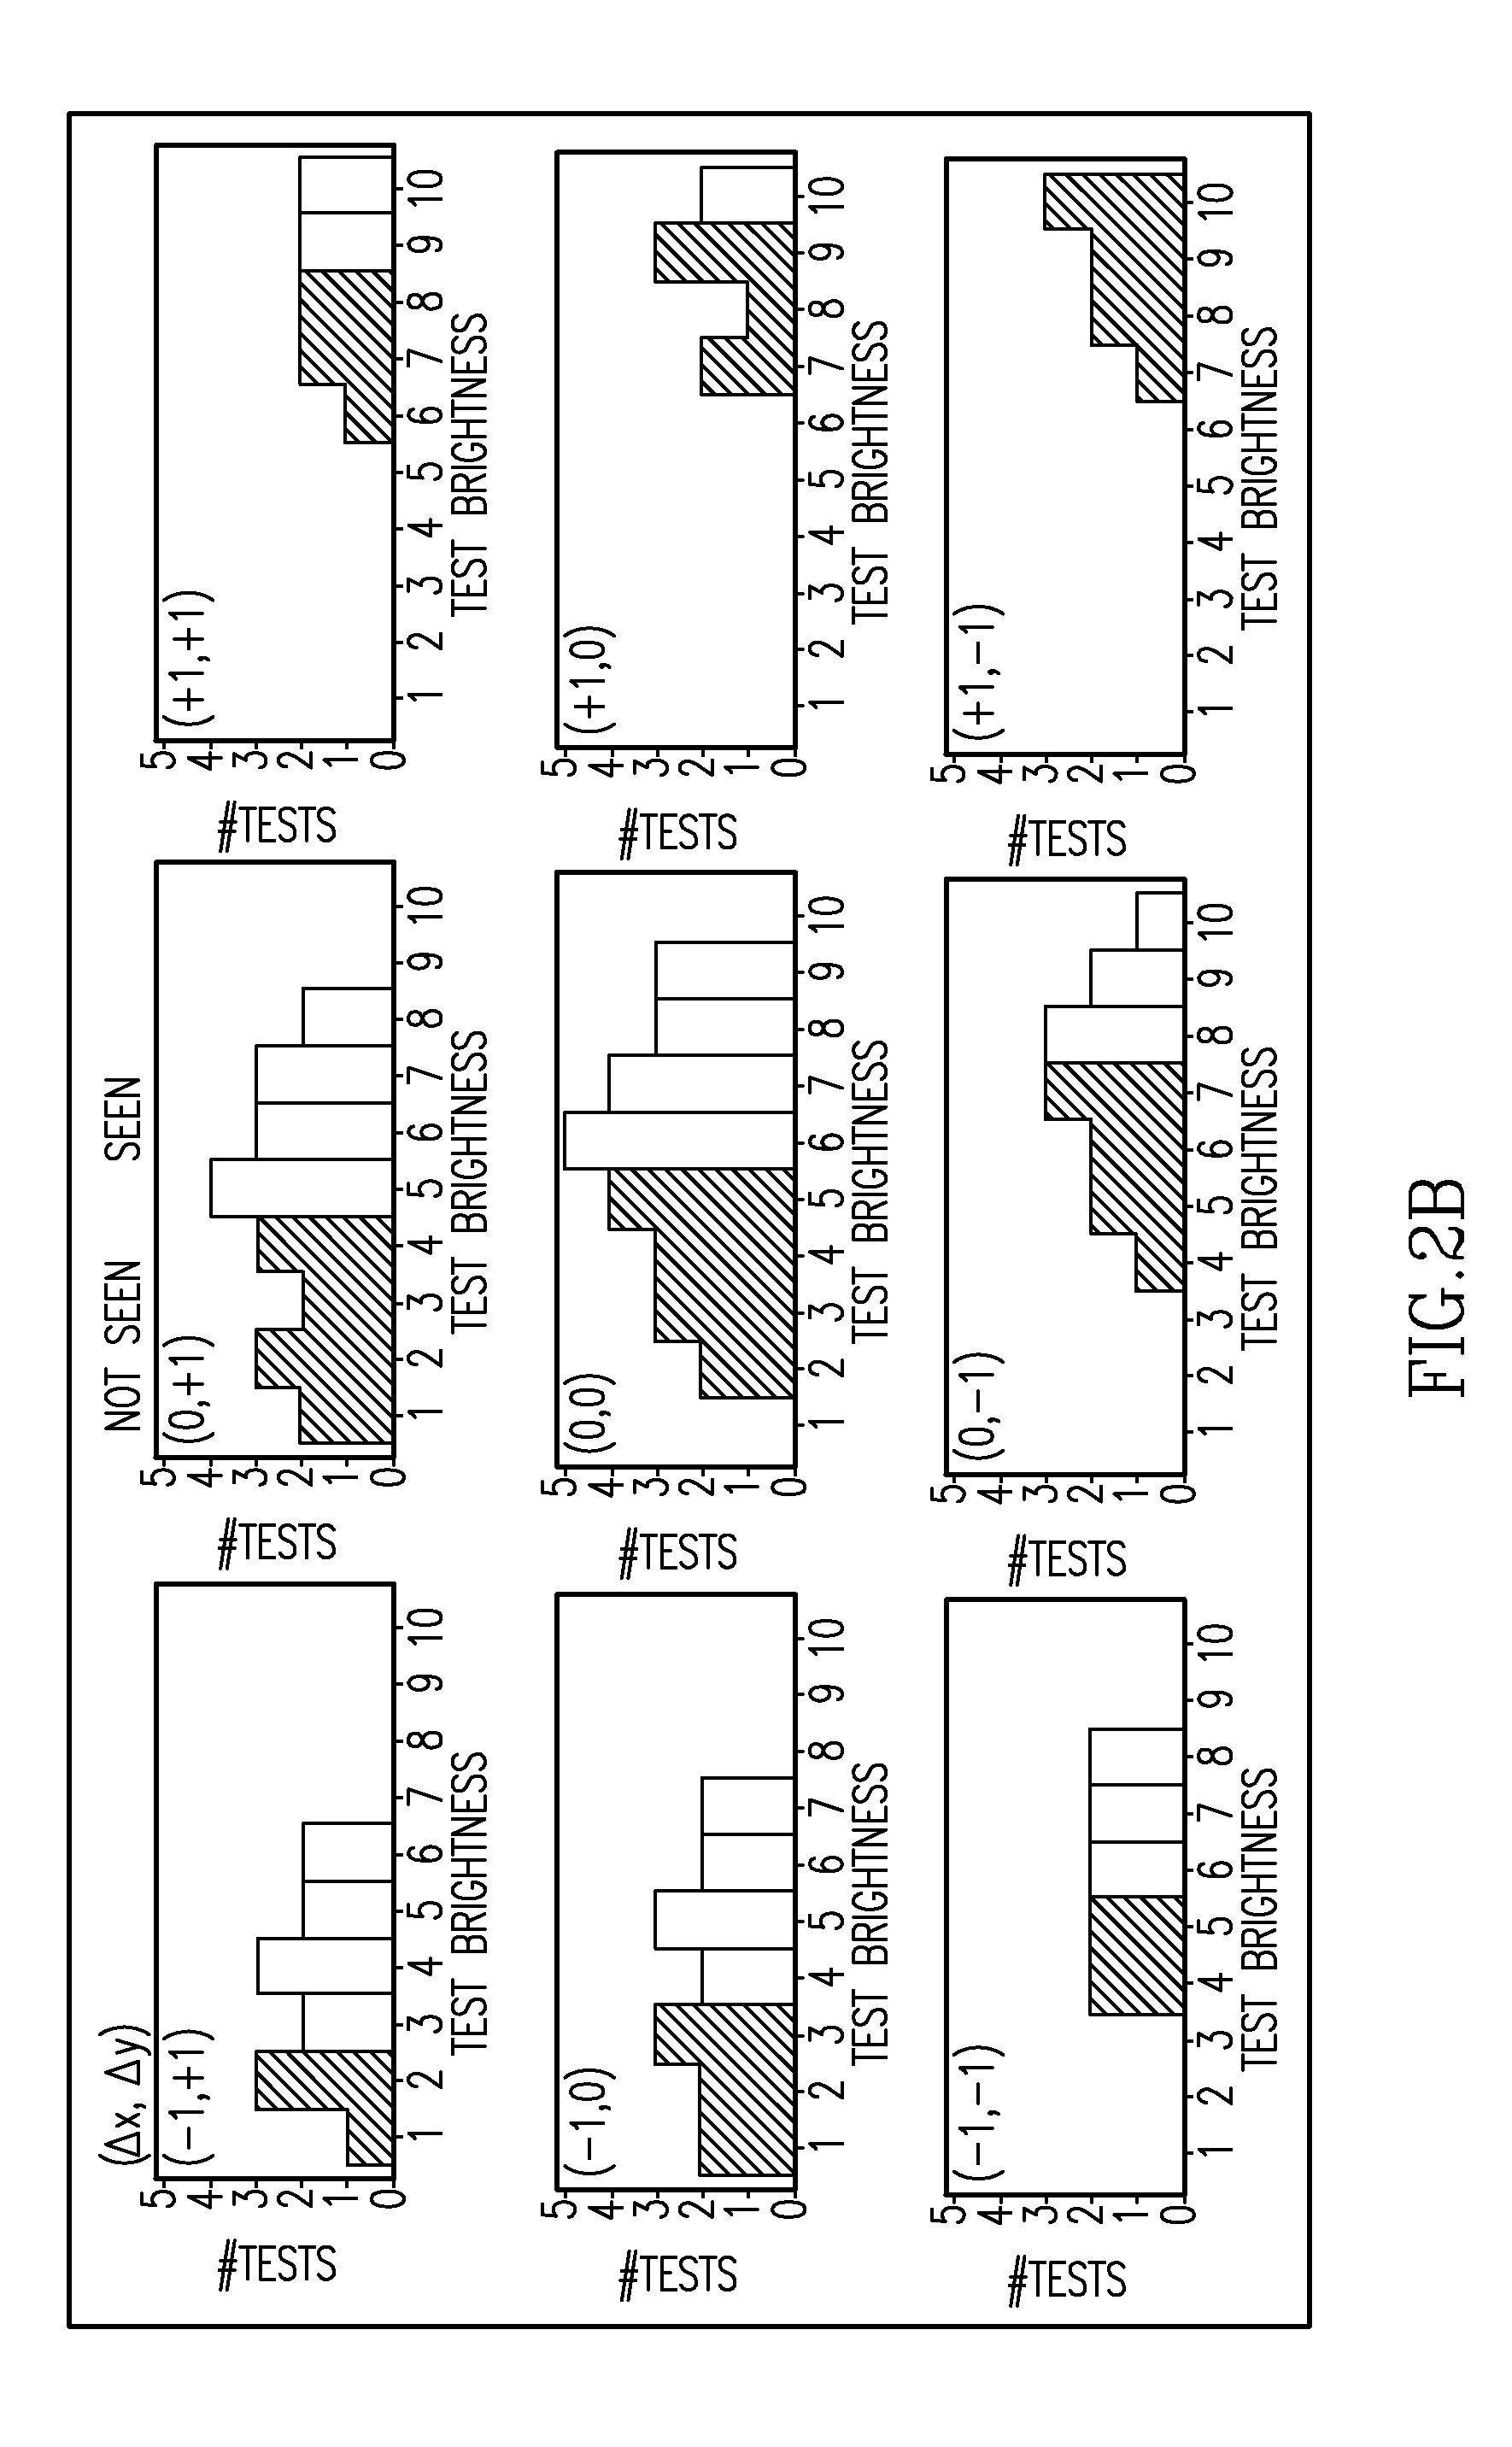
[0038]If a substantial part of test-retest variability results from fixational eye movements, this could be corrected post hoc with eye movement information. 7 normal subjects were tested with a rectangular test array (4×7; 2 deg spacing), extending from 11 deg to 17 deg in the temporal field, encroaching on the blind spot. Additional control locations were placed in nasal, superior, and inferior visual field. Visual stimuli (size III, 0.1 sec) were presented on a CRT (Radius) with a background luminance of 5 cd / m2. Testing employed a 2 dB / 1 dB two-reversal staircase. Gaze direction was recorded continuously with a video-based eyetracker (ISCAN). Subjects participated in at least two testing sessions.

[0039]Subjects showed variability of gaze-direction which could be described by a normal distribution with SD between 0.2 and 0.5 deg. For each subject, one or more test locations showing substantial test-retest variability was selected for further analysis. 15 test locations in 7 eyes ...

example 2

Using Gaze-Direction Data to Improve the Estimate of Scotoma Edges

[0041]The apparatus employed herein has been previously described in Wyatt H J, Dul M W, Swanson W H. Variability of visual field measurements is correlated with the gradient of sensitivity. Vision Res 2007; 47:925-936. Briefly, visual stimuli were presented on a display monitor (Radius PressView 21 SR, Miro Displays, Inc., Germany) driven by a Power Macintosh G3 computer. The display monitor was a 2100 CRT monitor with 38.0×27.8 cm active area, resolution 832×624 pixels, and frame rate 75 Hz. The monitor was calibrated with a luminance meter (LS-100, Minolta, Japan). The monitor was 75 cm from the recorded eye, so it 29.1 deg horizontally and 21.8 deg vertically at the eye.

[0042]Eye movements (gaze direction) and pupil diameter were measured using a PC-based infrared eyetracker (ISCAN EC-101, ISCAN, Inc., Burlington, Mass.) at a sample rate of 60 / sec. Experiments were controlled by the Macintosh computer; digital I / O...


PUM

PropertyMeasurementUnit
luminanceaaaaaaaaaa
luminanceaaaaaaaaaa
luminanceaaaaaaaaaa

Abstract

The invention relates to test-retest variability in tests of visual fields, and methods and systems useful in reducing this variability. The various methods and systems of the invention use gaze-direction data to improve the estimate of scotoma edges and to otherwise adjust for test-retest variability in perimetry. This may be useful in assessing progression of a patient's condition, such as glaucoma

Description

GOVERNMENT RIGHTS[0001]This invention was made with government support under Grant Nos. 5T35EY00707917 and 5R03EY01454903 awarded by the National Eye Institute of the National Institutes of Health. The government has certain rights in the invention.FIELD OF THE INVENTION[0002]The invention relates to test-retest variability in tests of visual fields, and methods to reduce this variability.BACKGROUND OF THE INVENTION[0003]All publications herein are incorporated by reference to the same extent as if each individual publication or patent application was specifically and individually indicated to be incorporated by reference. The following description includes information that may be useful in understanding the present invention. It is not an admission that any of the information provided herein is prior art or relevant to the presently claimed invention, or that any publication specifically or implicitly referenced is prior art.[0004]The principal clinical method for functional assess...

Claims


Application Information

Patent Timeline
Patent Type & Authority Applications(United States)
IPC IPC(8): A61B3/024
CPCA61B5/0468C12Q2600/106C12Q1/6883A61B5/364
Inventor WYATT, HARRY J.
Owner THE RES FOUND OF STATE UNIV OF NEW YORK
Why Eureka
Try Eureka