Synergistic H2S/Mercaptan Scavengers Using Glyoxal
- Summary
- Abstract
- Description
- Claims
- Application Information
AI Technical Summary
Benefits of technology
Problems solved by technology
Method used
Image
Examples
example 1
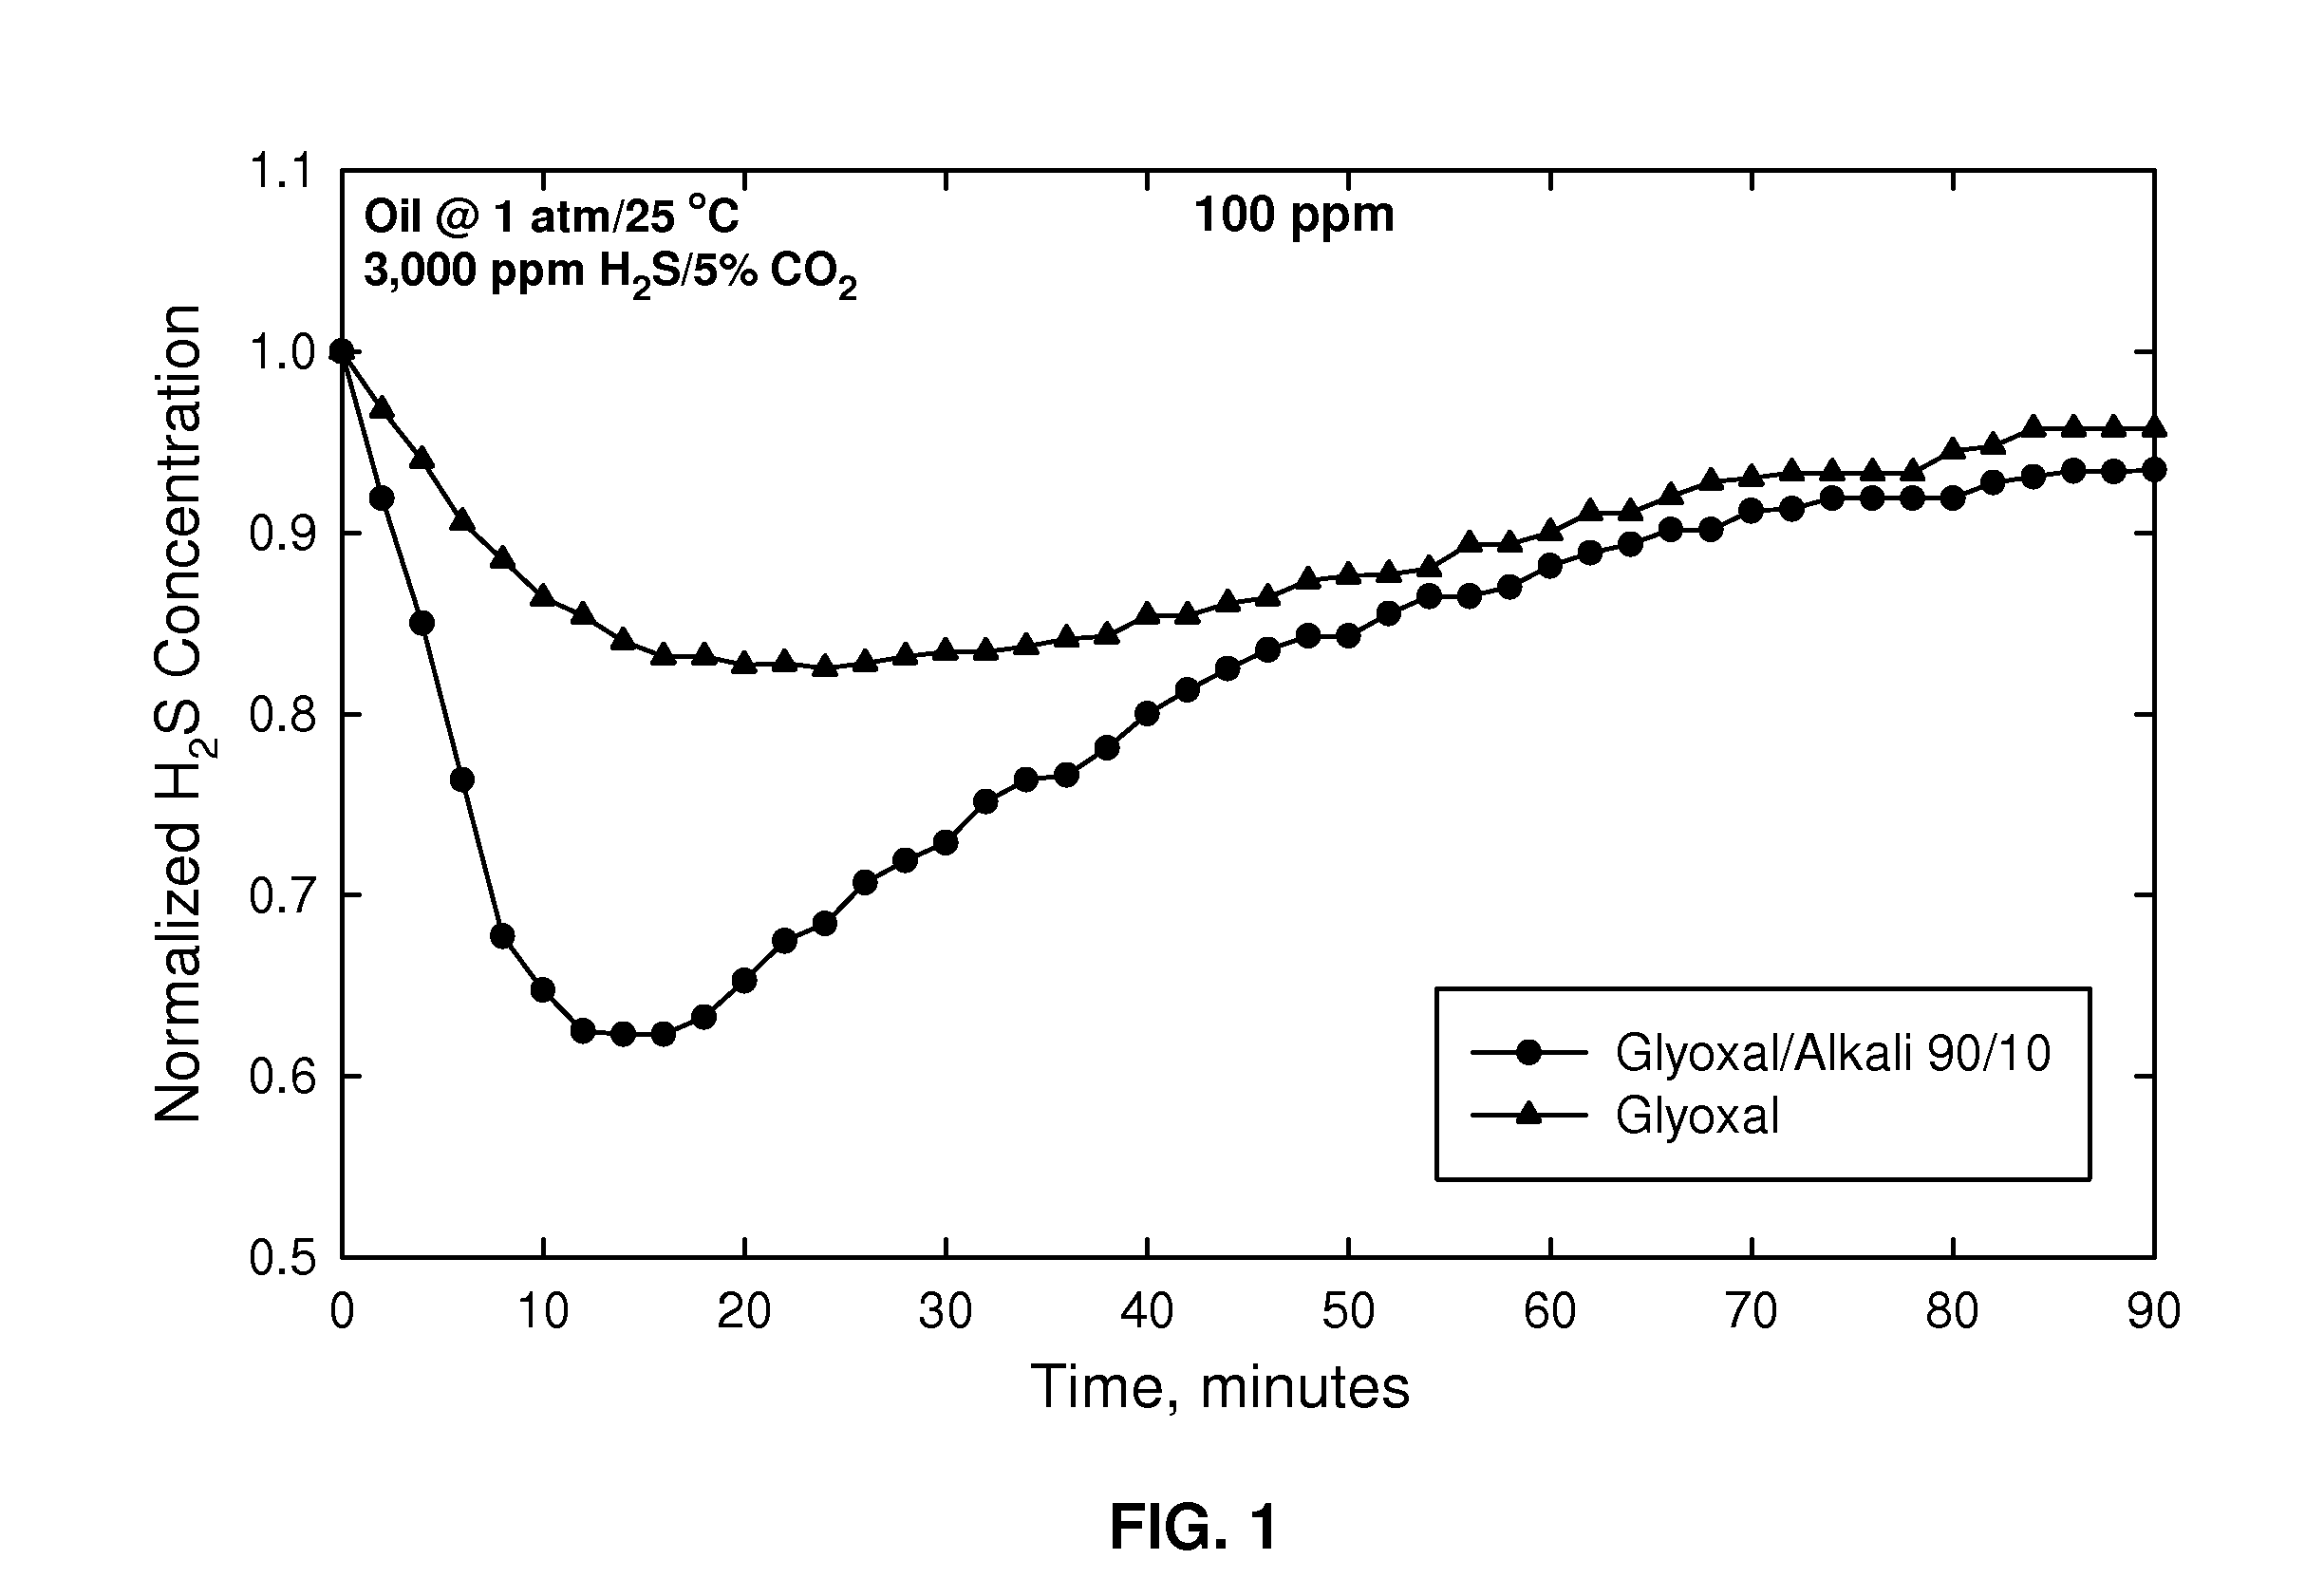
[0035]Shown in FIG. 1 is a graph of normalized H2S concentration as a function of time for H2S scavenged from oil at 1 atmosphere (0.1 MPa) and 25° C. where the oil contained 3000 ppm H2S and 5% CO2. The curve for glyoxal alone (40% in aqueous solution; triangles) indicates that the amount of H2S was reduced to its lowest level at about 18 minutes and then gradually rose as the glyoxal was spent. The curve for glyoxal together with alkali (KOH) in a 90 / 10 weight ratio (total 100 ppm) (glyoxal 36% aqueous solution) (circles) gave a much greater reduction of H2S, and more rapidly, having a minimum at slightly above 0.6 showing a much greater reduction in H2S presence as compared with using glyoxal alone. Further, even though the H2S presence gradually increases after treatment with a composition as described herein, it never approaches the amount when glyoxal is used alone over the time of 90 minutes.
example 2
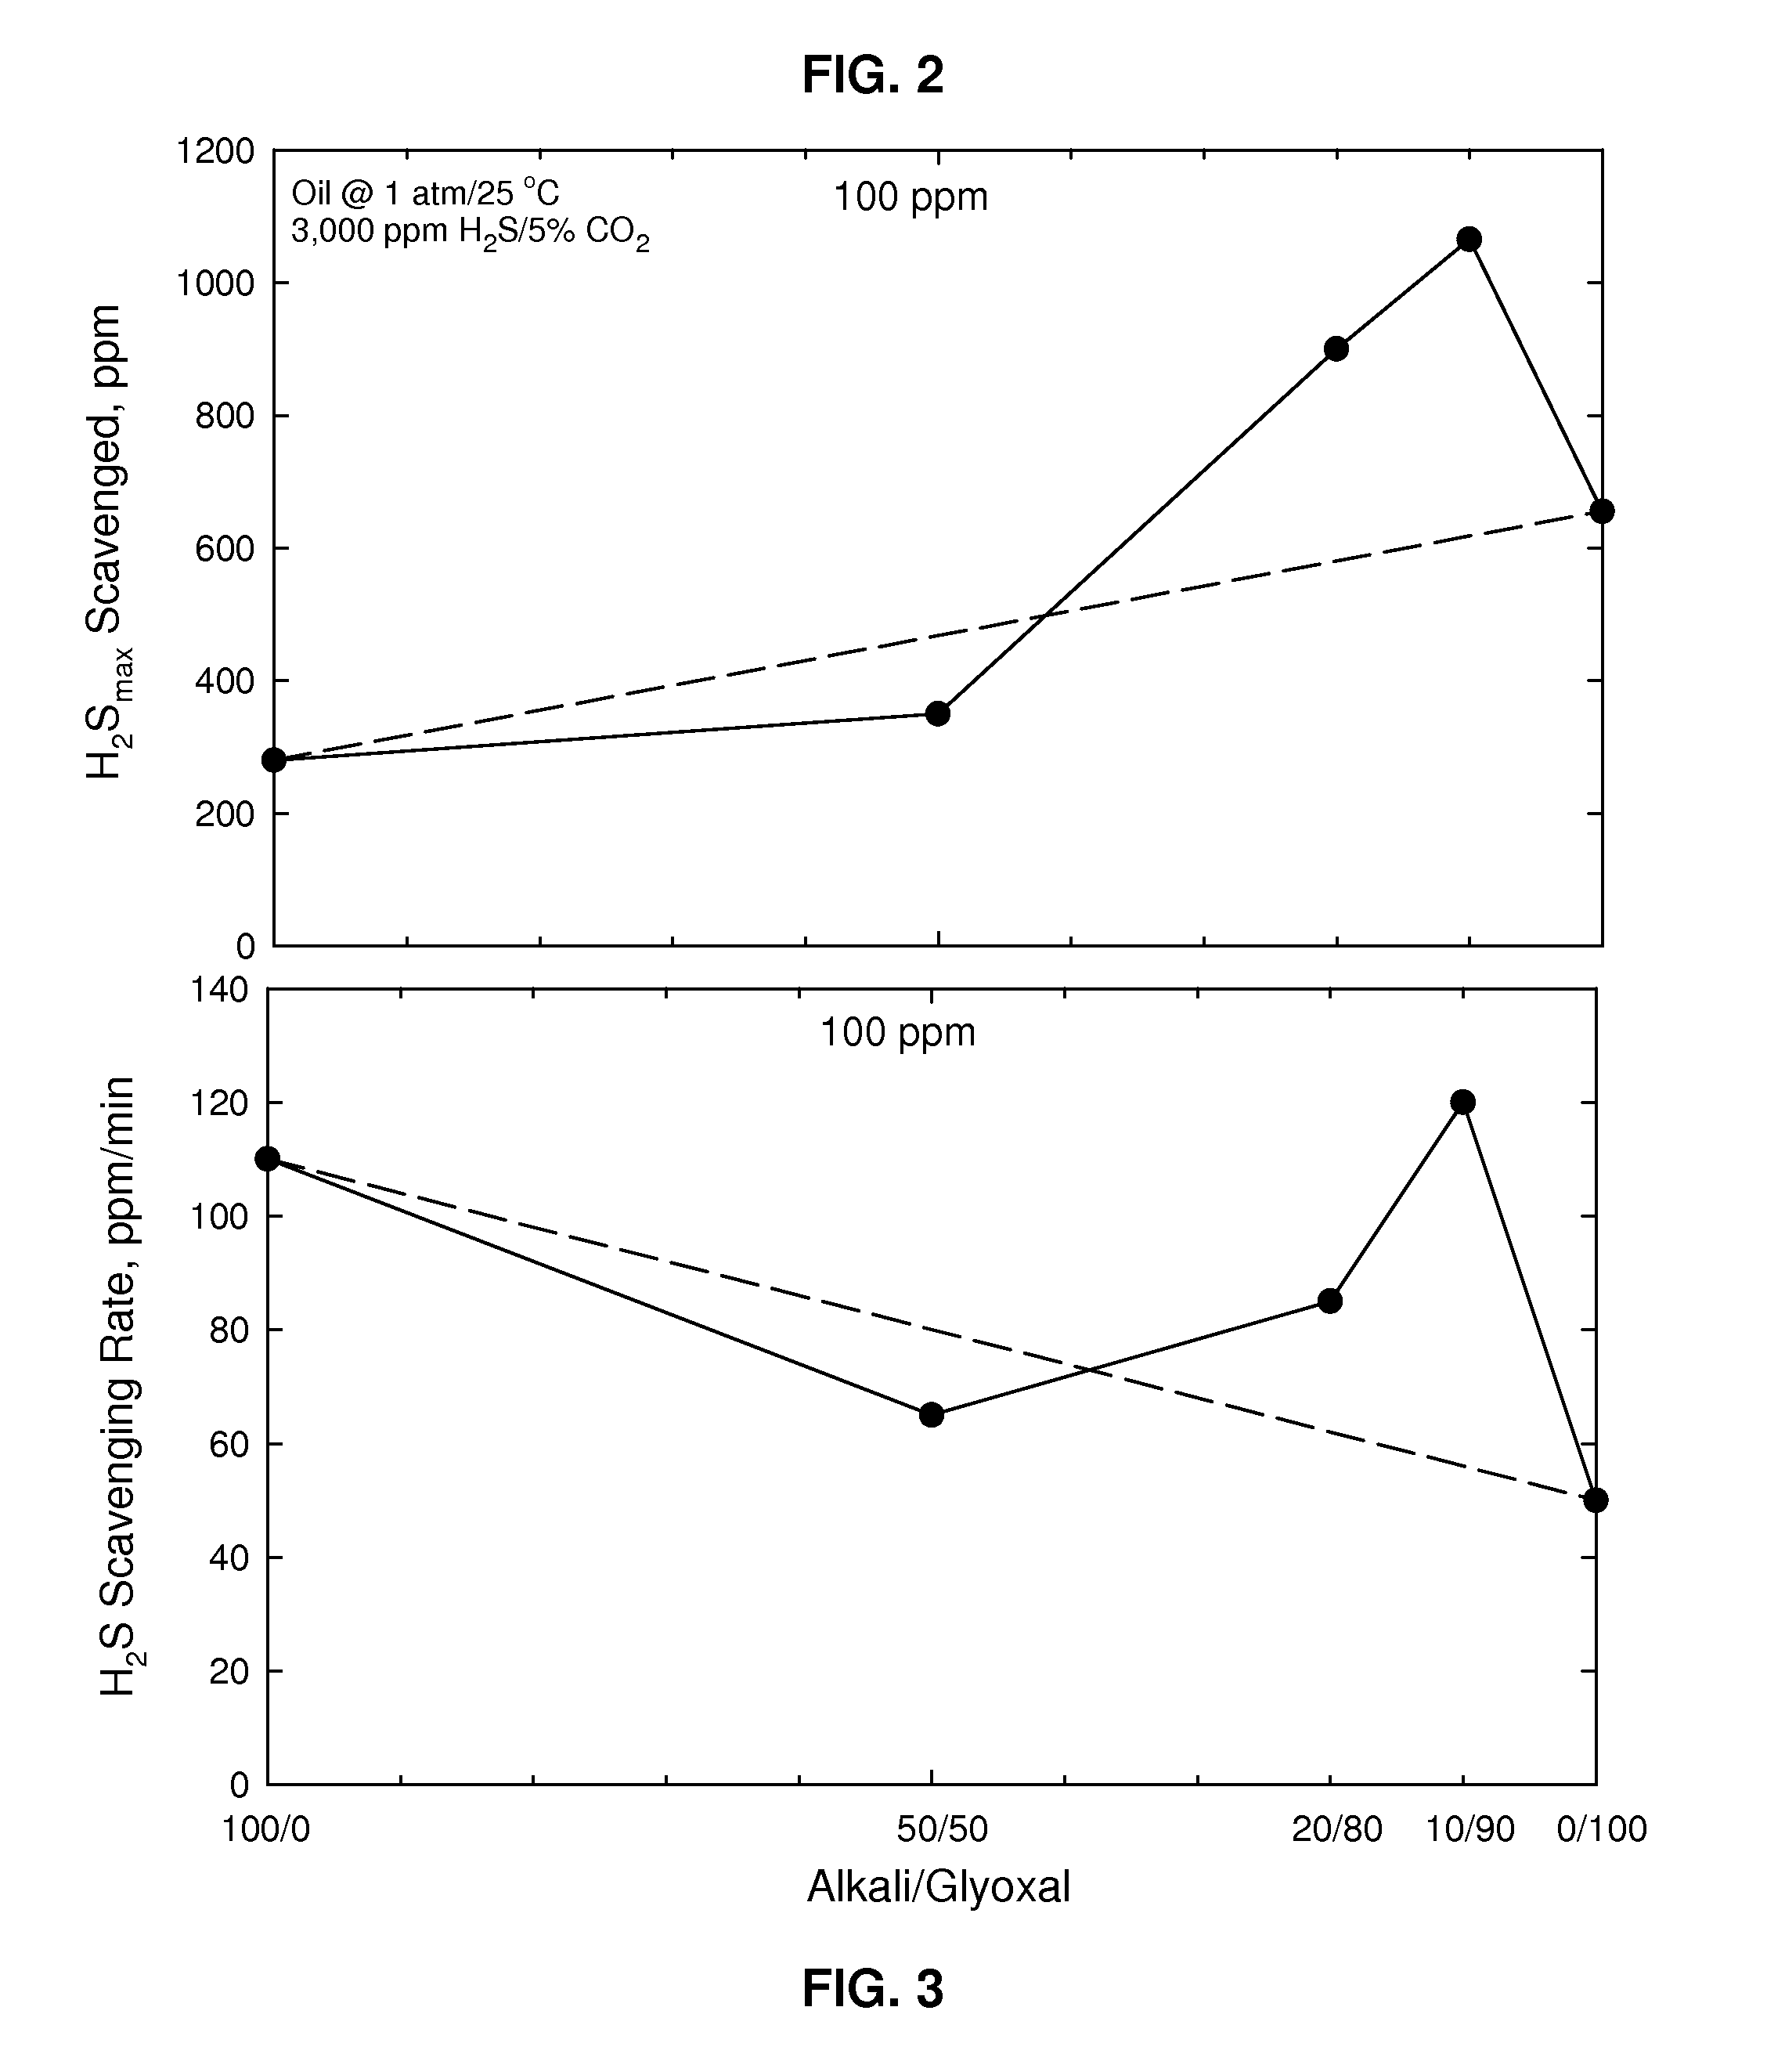
[0036]Shown in FIG. 2 is a graph showing the results of a H2S uptake test showing the maximum reduction of hydrogen sulfide as a function of various weight ratios of alkali (KOH) / glyoxal (each totaling 100 ppm, where the glyoxal was again 40 wt % in an aqueous solution) at 1 atmosphere (0.1 MPa) and 25° C. where the oil contained 3000 ppm H2S and 5% CO2 showing H2S scavenged in ppm. It can be seen here that the best performance is seen with the weight ratio of 10 / 90. FIG. 3 shows the H2S scavenging rate in ppm / minute for the same conditions. It may be clearly seen that there was an unexpected peak in H2S scavenged (FIG. 2) and scavenging rate (FIG. 3) for the weight ratio of alkali / glyoxal of 10 / 90 as compared with only alkali (left side of FIG. 2 and FIG. 3.) and only glyoxal (right side of FIG. 2 and FIG. 3). The dashed lines in both FIGS. represent what would be expected as a smooth transition from only alkali to only glyoxal (additive effect).
example 3
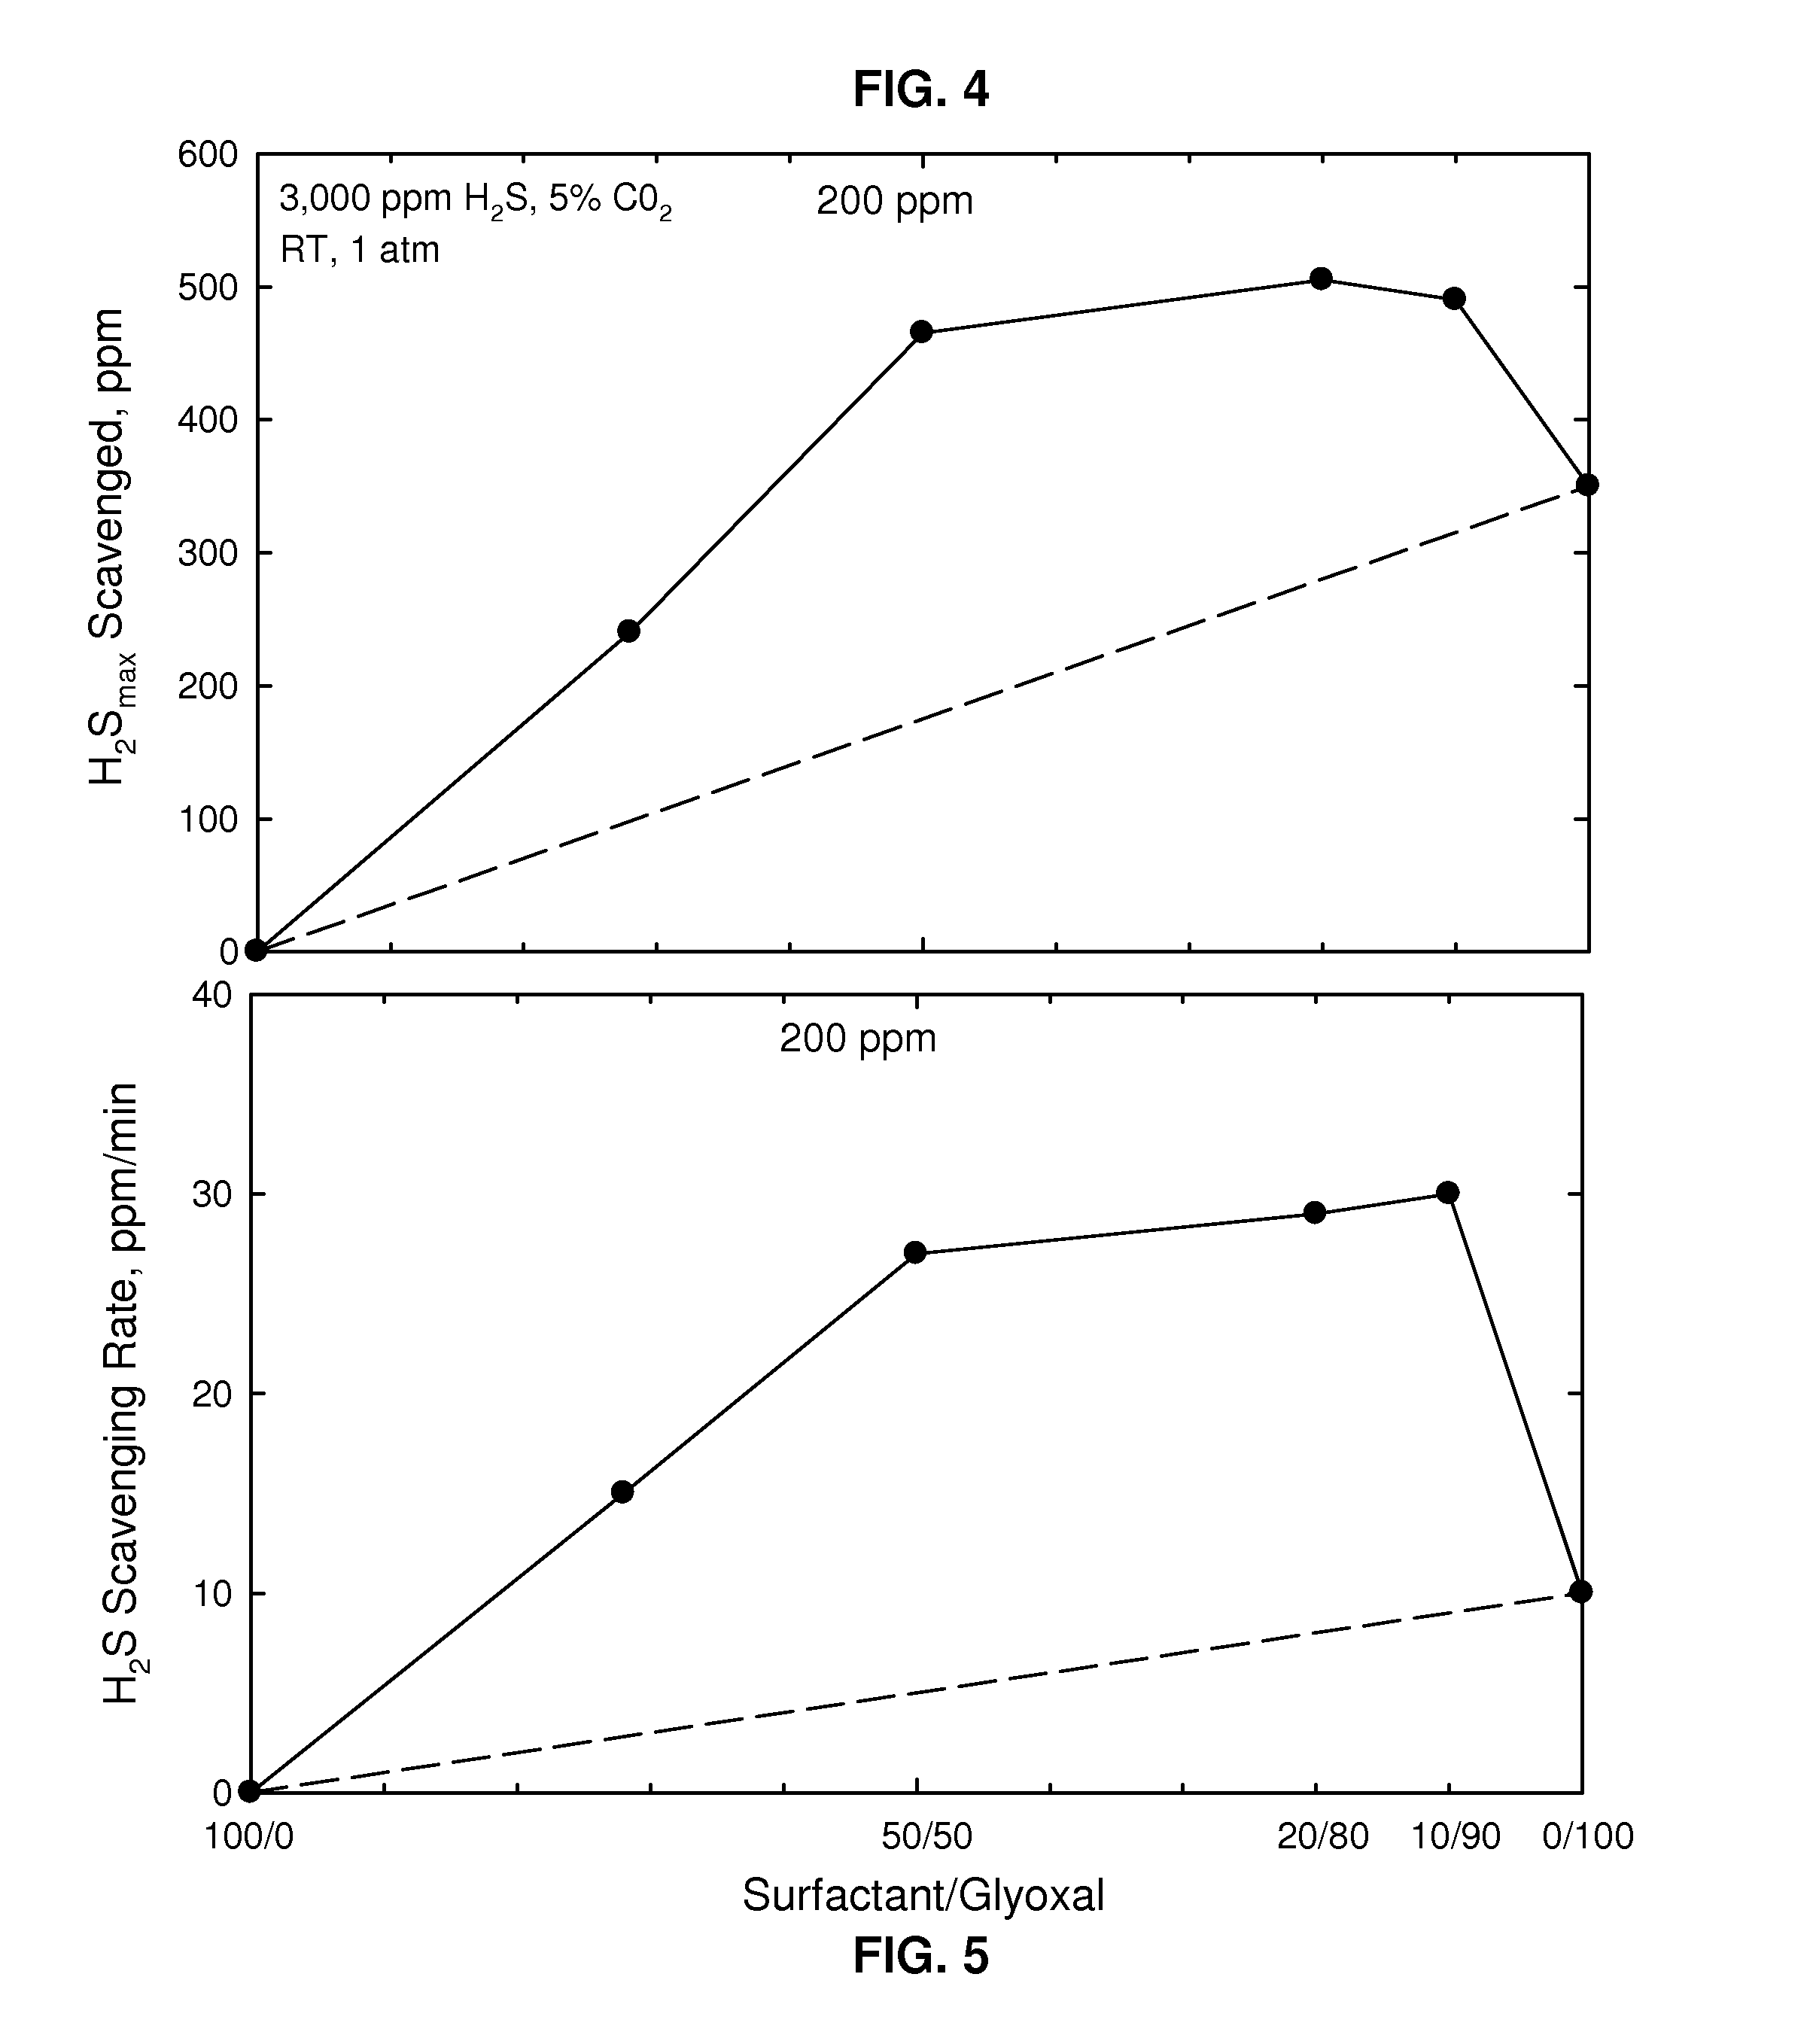
[0037]Shown in FIG. 4 is a graph showing the results of a H2S uptake test showing mass uptake as a function of various weight ratios of non-nitrogen-containing surfactant (ethoxylated C12 alcohol) / glyoxal (each totaling 100 ppm, where the glyoxal was again 40 wt % in an aqueous solution) at 1 atmosphere (0.1 MPa) and 25° C. where the oil contained 3000 ppm H2S and 5% CO2 showing H2S scavenged in ppm. In this graph synergistic performance is seen with the different weight ratios that contain non-nitrogen-containing surfactant. FIG. 5 shows the H2S scavenging rate in ppm / minute for the same conditions. It may be clearly seen that there was an unexpected peak in H2S scavenged (FIG. 4) at a ratio of surfactant / glyoxal of 20 / 80 and an unexpected peak in scavenging rate (FIG. 5) for the weight ratio of surfactant / glyoxal of 10 / 90 as compared with only surfactant (left side of FIGS.) and only glyoxal (right side of FIGS.). The dashed lines in both FIGS. represents what would be expected as...
PUM
 Abstract
Description
Claims
Application Information
 - R&D
- Intellectual Property
- Life Sciences
- Materials
- Tech Scout
- Unparalleled Data Quality
- Higher Quality Content
- 60% Fewer Hallucinations
Browse by: Latest US Patents, China's latest patents, Technical Efficacy Thesaurus, Application Domain, Technology Topic, Popular Technical Reports.
© 2025 PatSnap. All rights reserved.Legal|Privacy policy|Modern Slavery Act Transparency Statement|Sitemap|About US| Contact US: help@patsnap.com


