Advanced analyte sensor calibration and error detection

Active Publication Date: 2012-10-18
DEXCOM
View PDF11 Cites 241 Cited by
  • Summary
  • Abstract
  • Description
  • Claims
  • Application Information

AI Technical Summary

Benefits of technology

[0200]In an embodiment of the thirty-sixth aspect or any other embodiment thereof, the sensor system comprises instructions stored in computer memory, wherein the instruc

Problems solved by technology

This condition typically leads to an increased concentration of glucose in the blood (hyperglycemia), which can cause an array of physiological derangements (e.g., kidney failure, skin ulcers, or bleeding into the vitreous of the eye) associated with the deterioration of small blood vessels.
Conventionally, a diabetic person carries a self-monitoring blood glucose (SMBG) monitor, which typically involves uncomfortable finger pricking methods.
Due to a lack of comfort and convenience, a diabetic will often only measure his or her glucose levels two to four times per day.
Unfortunately, these measurements can be spread far apart, such that a diabetic may sometimes learn too late of a hypoglycemic or hyperglycemic event, thereby potentially incurring dangerous side effects.
In fact, not only is it unlikely that a diabetic will take a timely SMBG measurement, but even if

Method used


Image

  • Advanced analyte sensor calibration and error detection
  • Advanced analyte sensor calibration and error detection
  • Advanced analyte sensor calibration and error detection

Examples


example 1

Sensitivity and Impedance Relationship

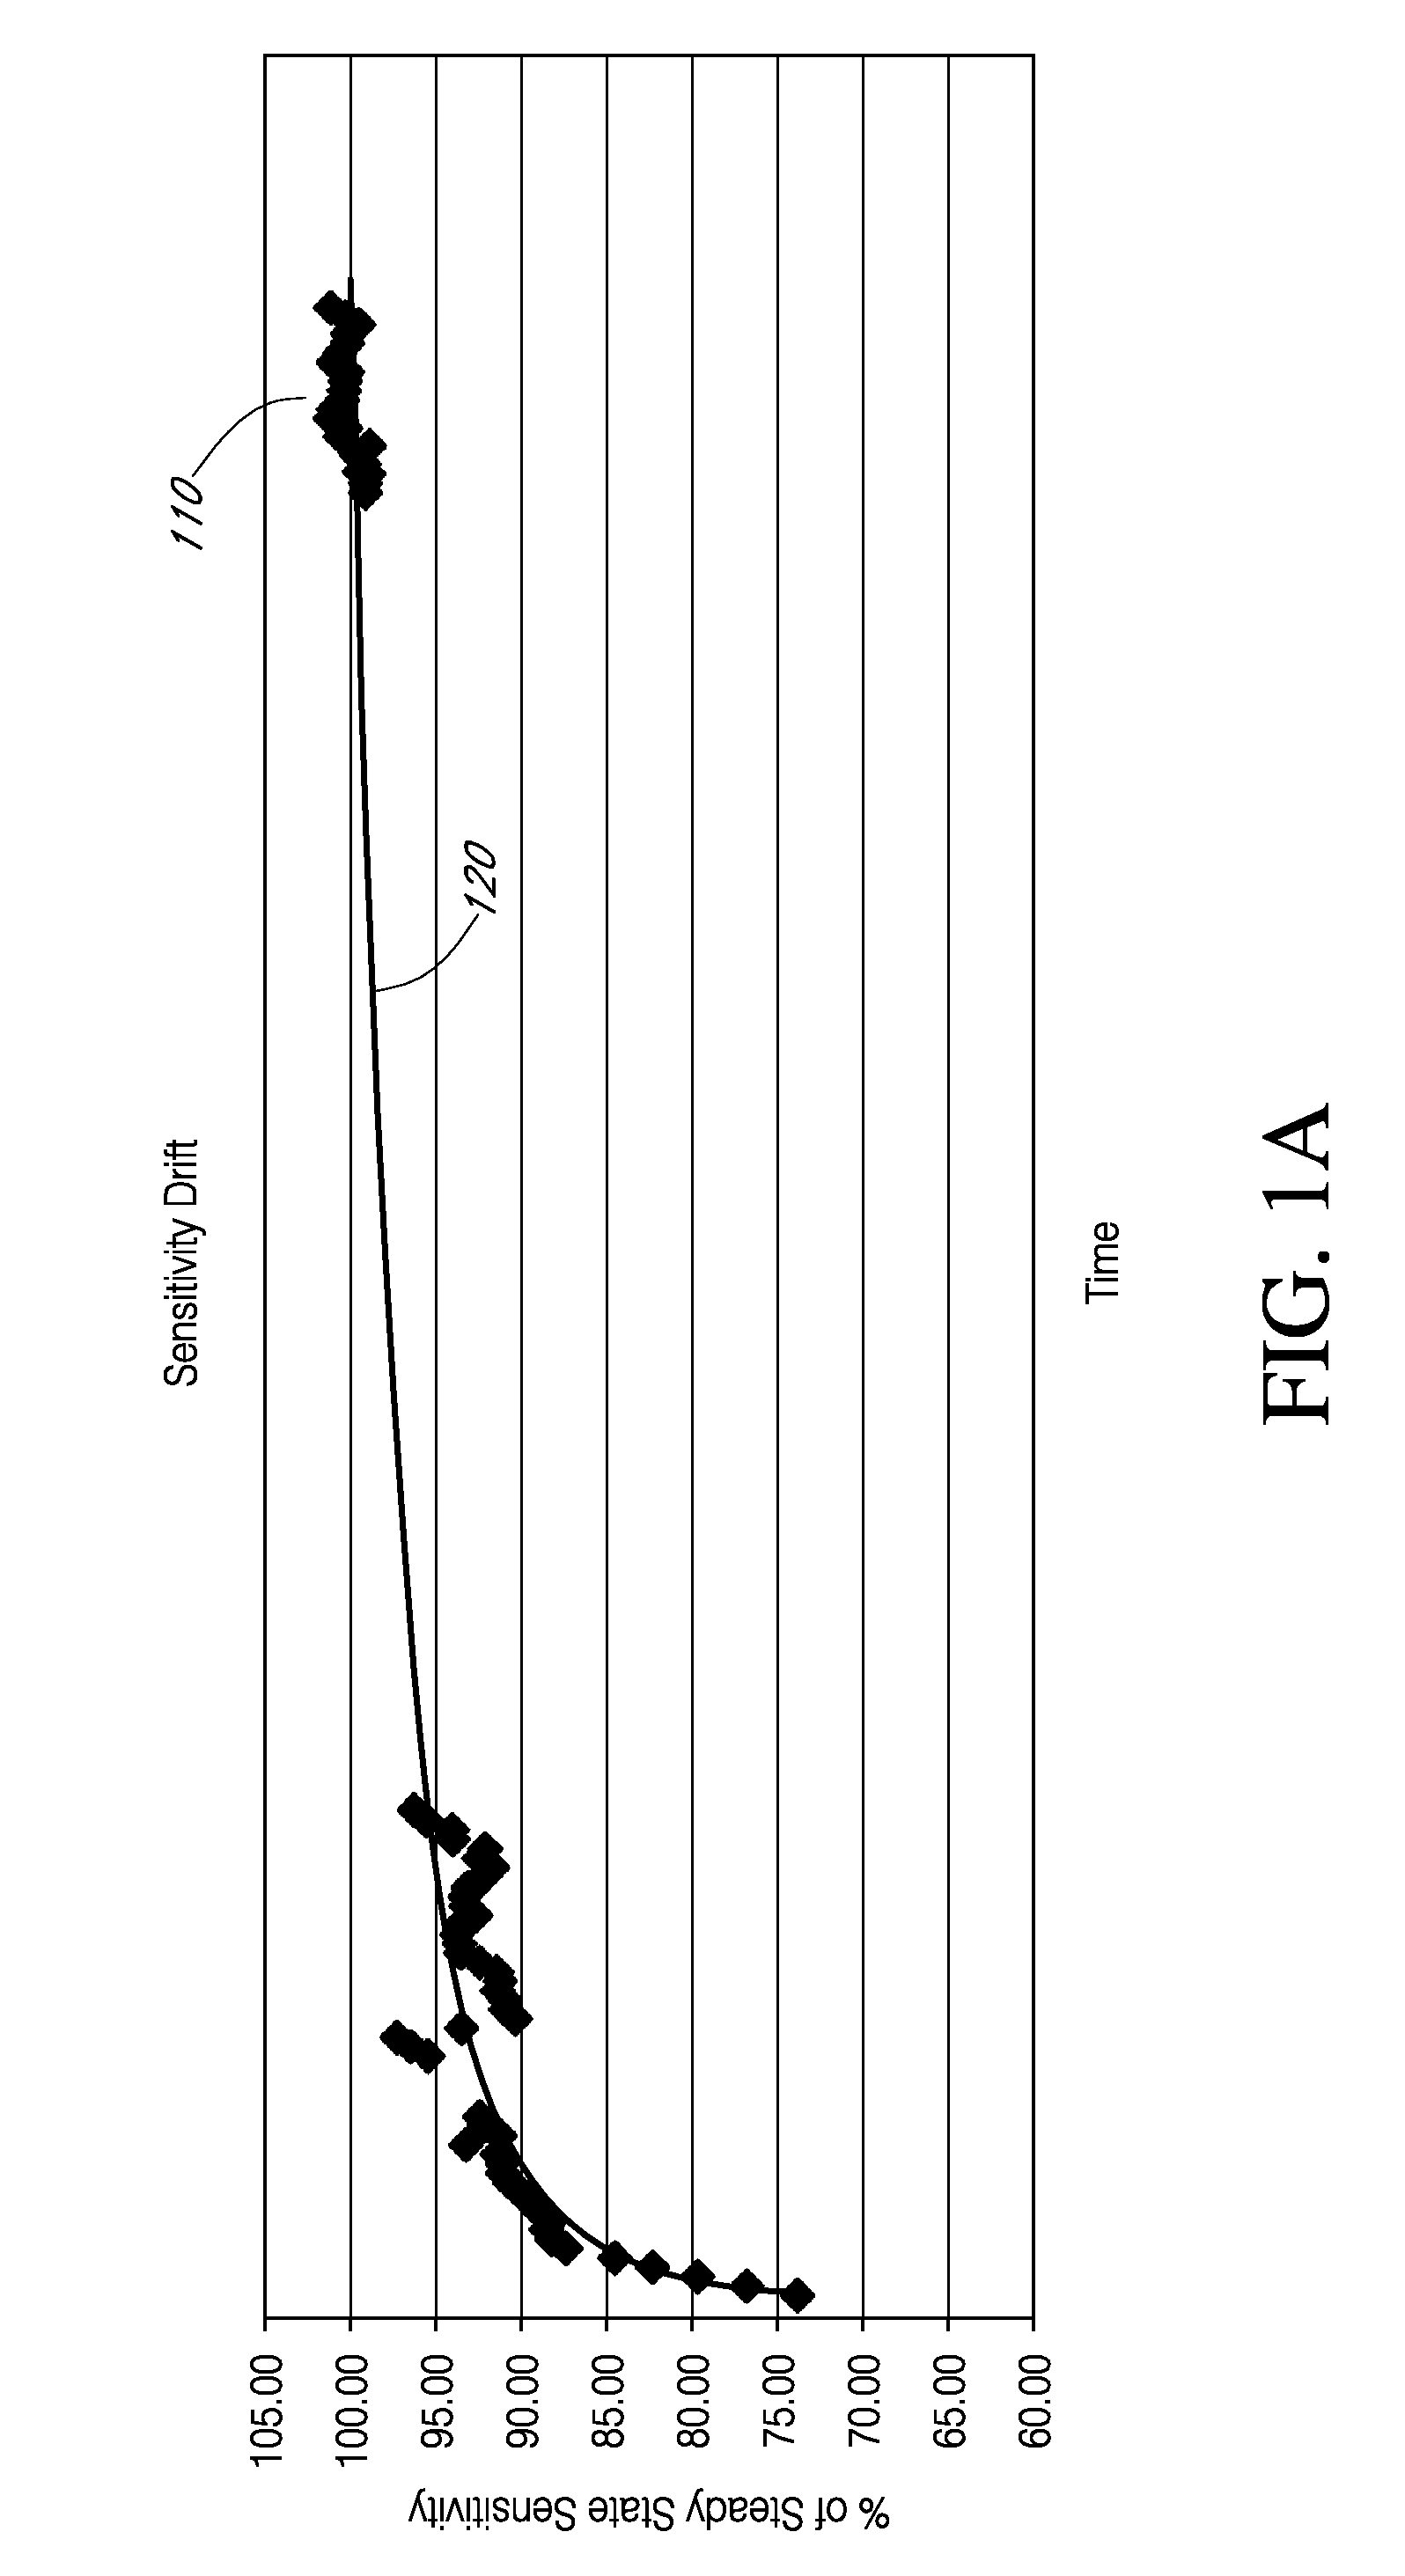
[0433]Example 1 illustrates a relationship between sensitivity of a sensor and an impedance of the sensor. In this example, an IVBG sensor was connected to a Gamry potentiostat system and placed in a in a buffer solution of a modified isolyte having a glucose concentration of 100 mg / dL. The temperature during the experiment was 37 C. An impedance spectrum was captured at fixed intervals of time. The impedance spectrum analyzed in this experiment ranged from 1 Hz to 100 kHz and measurements of the sensor impedance and sensor sensitivity were taken at 15 minute intervals over a period of about 1200 minutes.

[0434]Reference is now made to FIG. 25, which is a graph showing absolute values of sensitivity and impedance of the sensor based on an input signal having a frequency of 1 kHz. Data points 2502 represent measured values of sensor sensitivity over a time period of 1200 minutes (20 hours), where t=0 corresponds to the time when the sensor is init...

example 2

Retrospectively Compensating for Sensitivity Drift Using Impedance

[0437]FIG. 27 is a plot of sensitivity and impedance points measured at various intervals over time using seven different sensors, Sensors A-G. Sensors A-G were transcutaneous-type sensors, but selected from several different sensor lots. Thus, even though Sensors A-G were all transcutaneous sensors, sensors from different lots may have been made in a slightly different way or under slightly different conditions, which can result in sensors from different lots exhibiting different sensitivity profiles. In this Example, Sensors A and D were selected from a first lot, Sensor B was selected from a second lot, and Sensors C, E, F and G were selected from a third lot.

[0438]Further to FIG. 27, the plotted data points are sensitivity and impedance values for each Sensor A-G. Because the sensitivity of each Sensor A-G gradually increases over time, the right most points of each Sensor's plotted data points tend to correspond ...

example 3

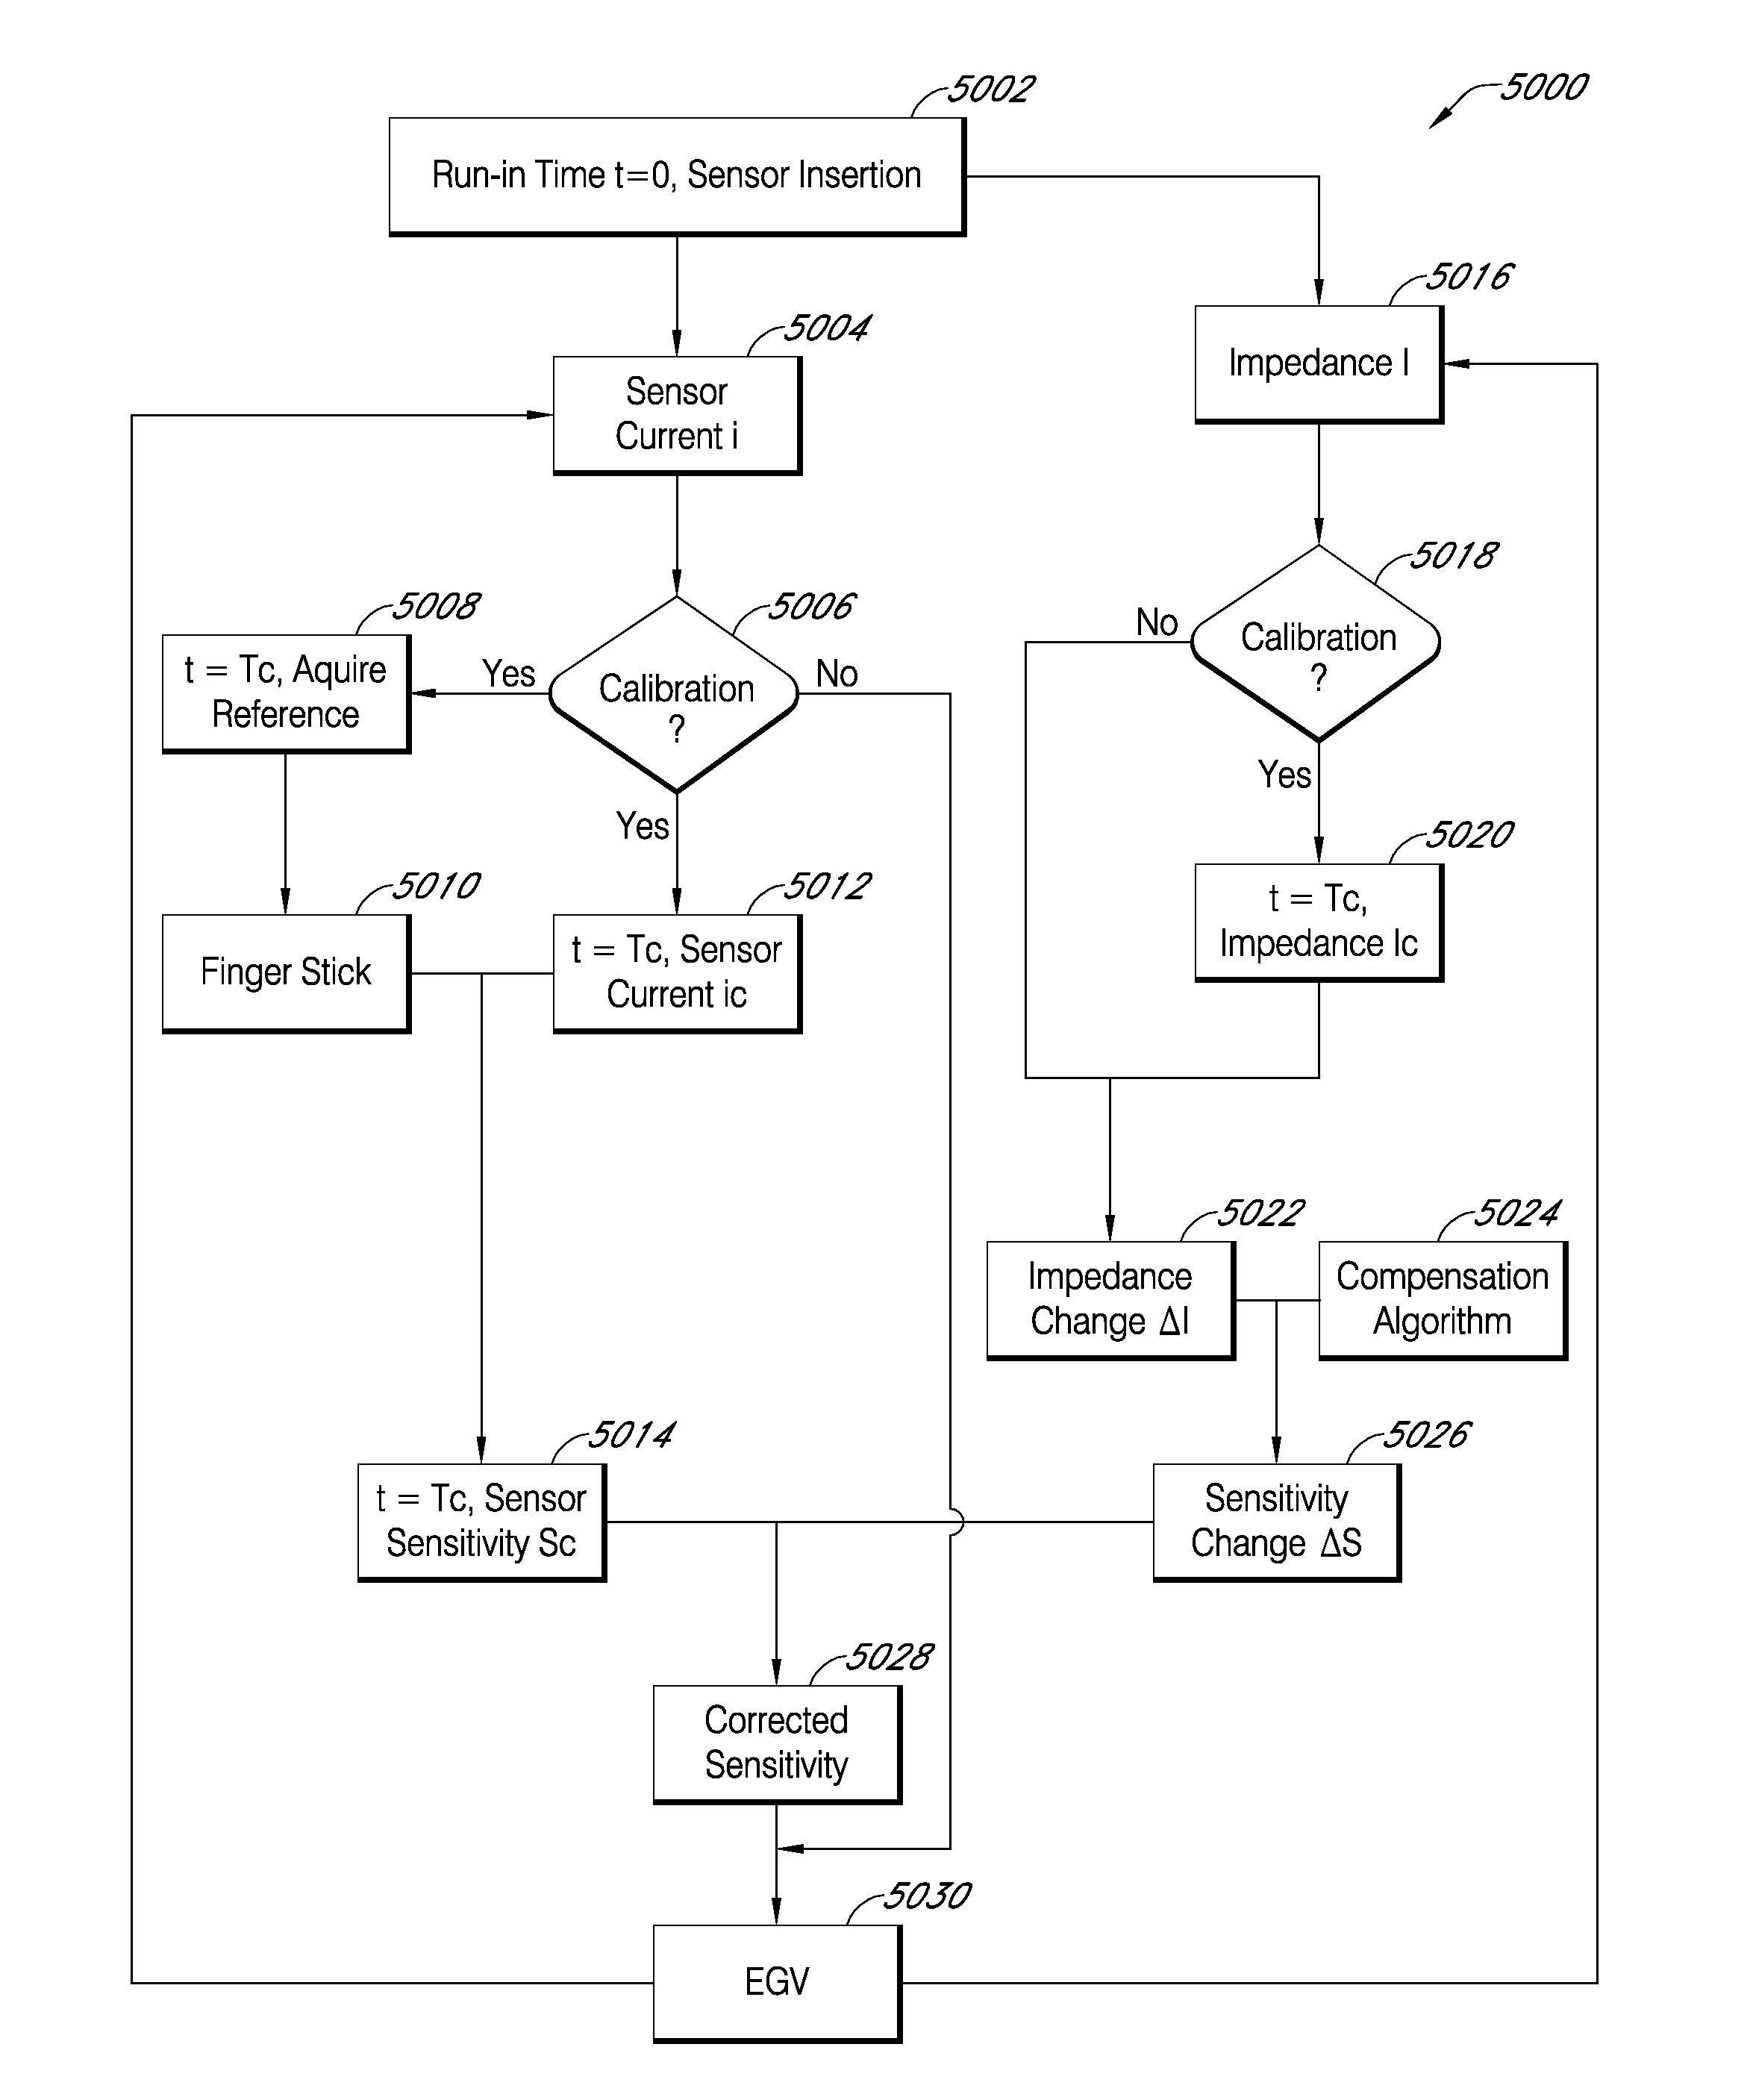
Prospective Calibration of Sensor Data Using Impedance Measurements

[0447]Example 5 pertains to prospective calibration. Further, in this experiment, calibration of sensor data is based on a change of sensitivity to change in impedance relationship previously derived from sensors from a different sensor lot. That is, in Example 3, the estimative curve 2802 is used to compensate data obtained using Sensors R-U, each of which was selected from a fourth sensor lot, the fourth sensor lot was not included in the group of sensors used to derive the estimative curve 2802. Example 5 shows that data can be calibrated using a change in sensitivity to change in impedance relationship derived from different sensor types than the type of sensor being calibrated. This can indicate that a sensor factory calibration code need not be used to compensate for sensitivity drift.

[0448]FIGS. 35 and 36 illustrate prospectively calibrating sensor data obtained from Sensors R-U. FIG. 35 is a plot of the perce...


PUM


Abstract

Systems and methods for processing sensor data and self-calibration are provided. In some embodiments, systems and methods are provided which are capable of calibrating a continuous analyte sensor based on an initial sensitivity, and then continuously performing self-calibration without using, or with reduced use of, reference measurements. In certain embodiments, a sensitivity of the analyte sensor is determined by applying an estimative algorithm that is a function of certain parameters. Also described herein are systems and methods for determining a property of an analyte sensor using a stimulus signal. The sensor property can be used to compensate sensor data for sensitivity drift, or determine another property associated with the sensor, such as temperature, sensor membrane damage, moisture ingress in sensor electronics, and scaling factors.

Description

CROSS-REFERENCE TO RELATED APPLICATIONS[0001]This application is a continuation of U.S. application Ser. No. 13 / 446,848, filed Apr. 13, 2012, which claims the benefit of U.S. Provisional Application No. 61 / 476,145, filed Apr. 15, 2011. The aforementioned applications are incorporated by reference herein in their entirety, and are hereby expressly made a part of this specification.TECHNICAL FIELD[0002]The embodiments described herein relate generally to systems and methods for processing sensor data from continuous analyte sensors and for self-calibration.BACKGROUND[0003]Diabetes mellitus is a chronic disease, which occurs when the pancreas does not produce enough insulin (Type I), or when the body cannot effectively use the insulin it produces (Type II). This condition typically leads to an increased concentration of glucose in the blood (hyperglycemia), which can cause an array of physiological derangements (e.g., kidney failure, skin ulcers, or bleeding into the vitreous of the ey...

Claims


Application Information

Patent Timeline
IPC IPC(8): G01R27/02G08B21/18G01N25/00G08B21/20G01R31/00G06F19/00
CPCG01N27/3274A61B5/1451A61B5/14517A61B5/7267A61B5/14546A61B5/1486A61B5/1495A61B5/14532A61B2560/0276G01N33/49A61B5/14503Y02A90/10H05K999/99G16H20/17G16H10/40G16H40/40G16H40/63A61B5/0031A61B5/14535A61B5/14539A61B5/14542A61B5/14735A61B5/14865A61B5/15003A61B5/150992A61B5/155A61B5/157A61B5/412A61B5/4839A61B5/6848A61B5/6849A61B5/6866A61B5/7275A61B5/743A61B2560/0223A61B2560/04A61B2562/085A61M5/14A61M5/16804A61M5/1723A61M2005/14296A61M2230/201C12Q1/001C12Q1/006G01D18/00G01N27/026A61B5/1473A61B5/7257H05K999/00
Inventor BOHM, SEBASTIANRONG, DAITINGSIMPSON, PETER C.
Owner DEXCOM
Why Eureka
Try Eureka