
New classification method for spectral data

a spectral data and classification method technology, applied in the field of spectrographic methods, can solve the problems of not adequately compensating for variability, giving more weight to the presence of peaks in the spectrum, and not giving, not giving or adequately compensating for the effect of variability

Inactive Publication Date: 2013-12-05
NEDERLANDSE ORG VOOR TOEGEPAST-NATUURWETENSCHAPPELIJK ONDERZOEK (TNO)
View PDF2 Cites 10 Cited by
  • Summary
  • Abstract
  • Description
  • Claims
  • Application Information

AI Technical Summary

Benefits of technology

The present invention provides a method for classification of spectral data, especially biological samples such as micro-organisms, by analyzing at least two samples belonging to at least one cluster through recording of a spectrum. This method involves determining peaks and their spectral value in the spectrum, calculating the probability of occurrence for each peak, preparing a spectrum from a sample, identifying peaks in the prepared spectrum, and assigning the sample to the cluster that provides the highest likelihood of identity. The invention also includes a system for carrying out the calculations and a use of the invention for the classification of biological material. Overall, the invention improves the accuracy and efficiency of spectroscopic analysis and provides a reliable tool for the classification of micro-organisms.

Problems solved by technology

The problem that remains in these classification methods is that more weight is given to the presence of peaks in the spectrum and not to the absence of peaks in the spectrum, and further these systems do not or not adequately compensate for the variability that can be seen in biological samples from individual members of the same class.

Method used


Image

  • New classification method for spectral data
  • New classification method for spectral data
  • New classification method for spectral data

Examples


example 1

[0065]The genus Brucella contains highly infectious species, able to cause infections in a wide variety of mammals. Until recently, six species where assigned to the Brucella genus, where some species contain different biovars: Brucella abortus (7 biovars), Brucella melitensis (3 biovars), Brucella suis (5 biovars), Brucella ovis, Brucella canis, and Brucella neotomae. Four new species have been described recently. Three of these species were isolated from ‘wild’ mammals and sea mammals: Brucella ceti, Brucella pinnipedialis, and Brucella microti. Finally, a new species was cultured from a breast implant infection and named Brucella inopinata (Scholtz, H. C. et al., 2010, Int J Syst Evol Microbiol. 60:801-808).

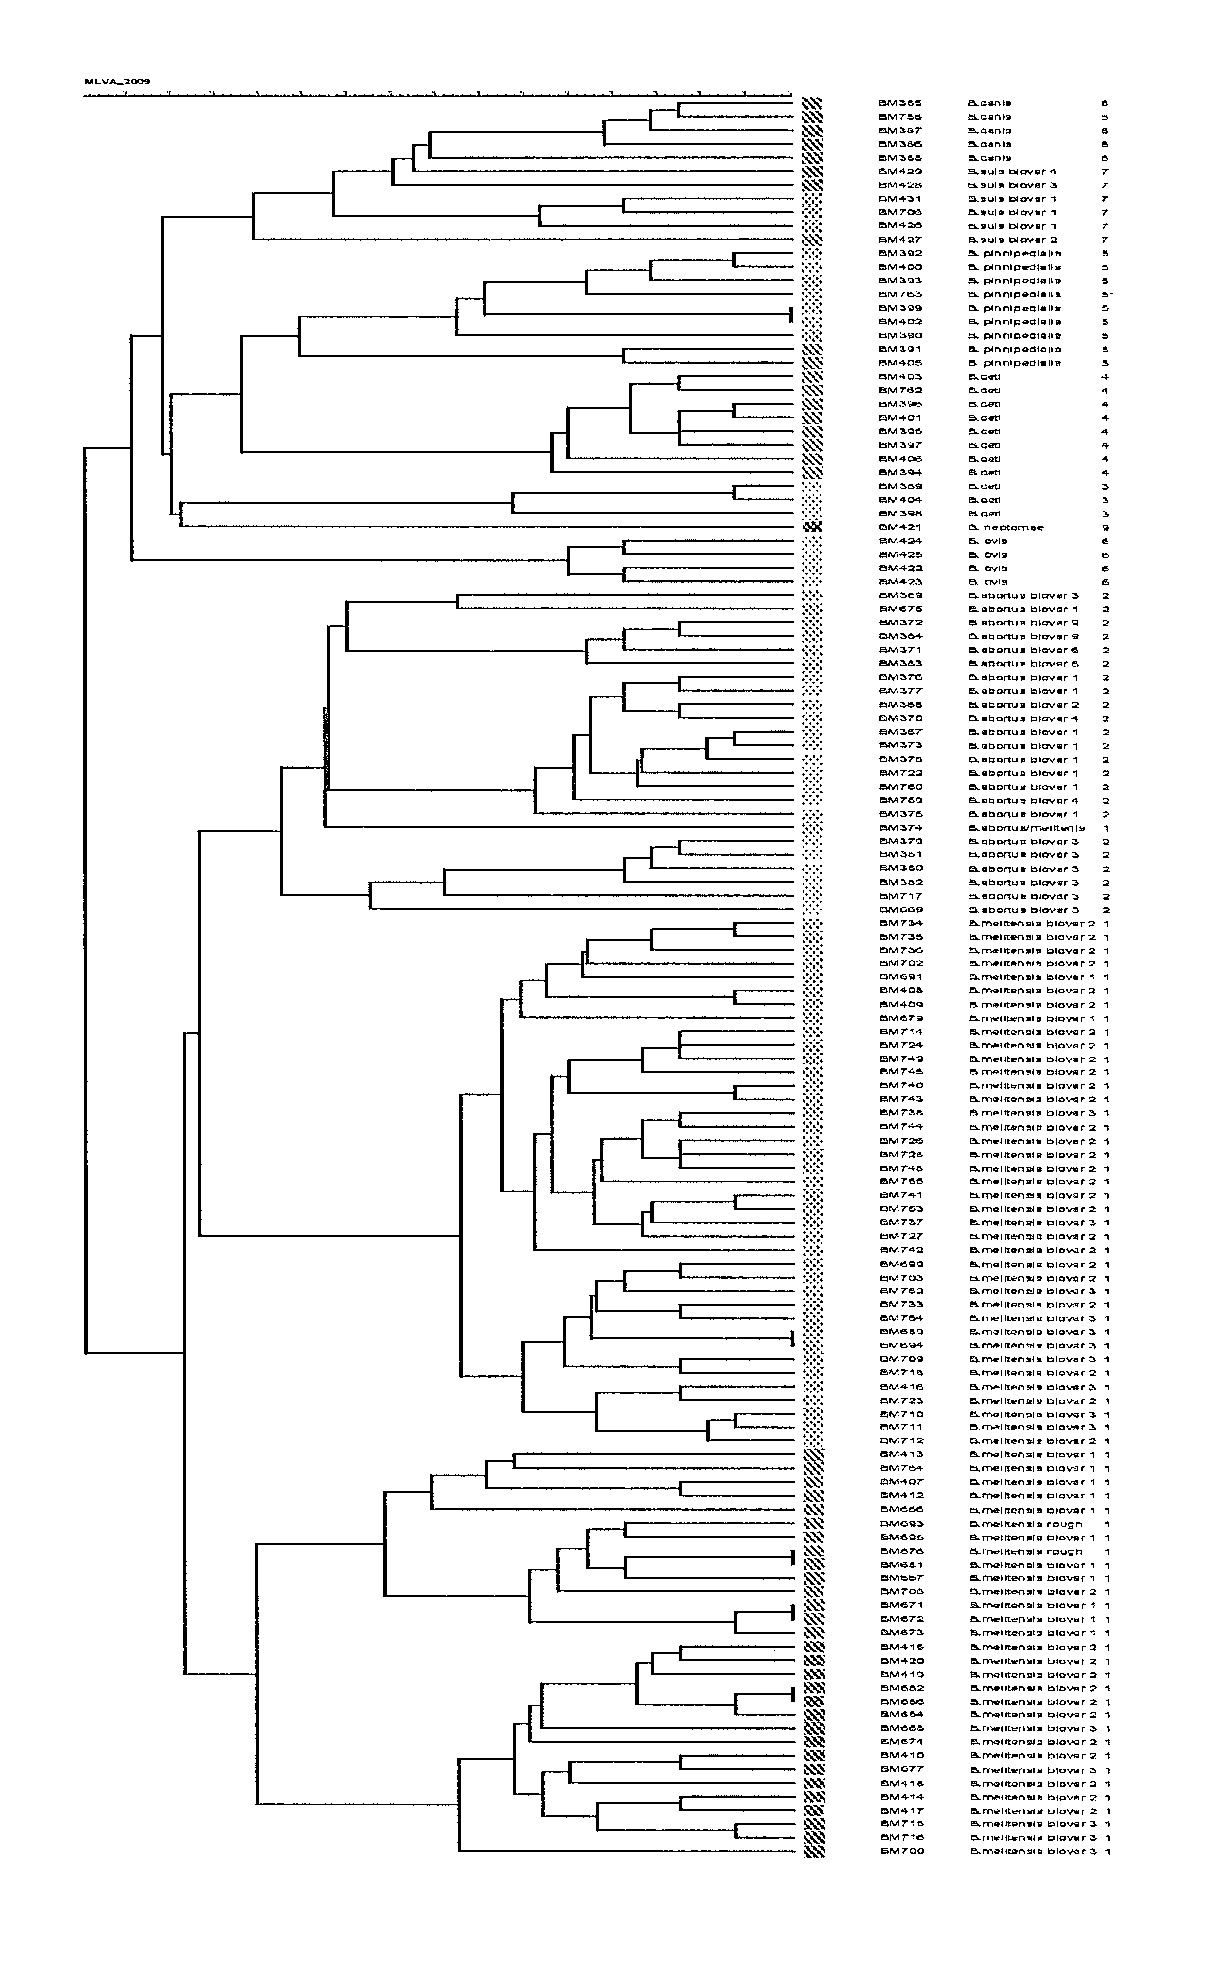
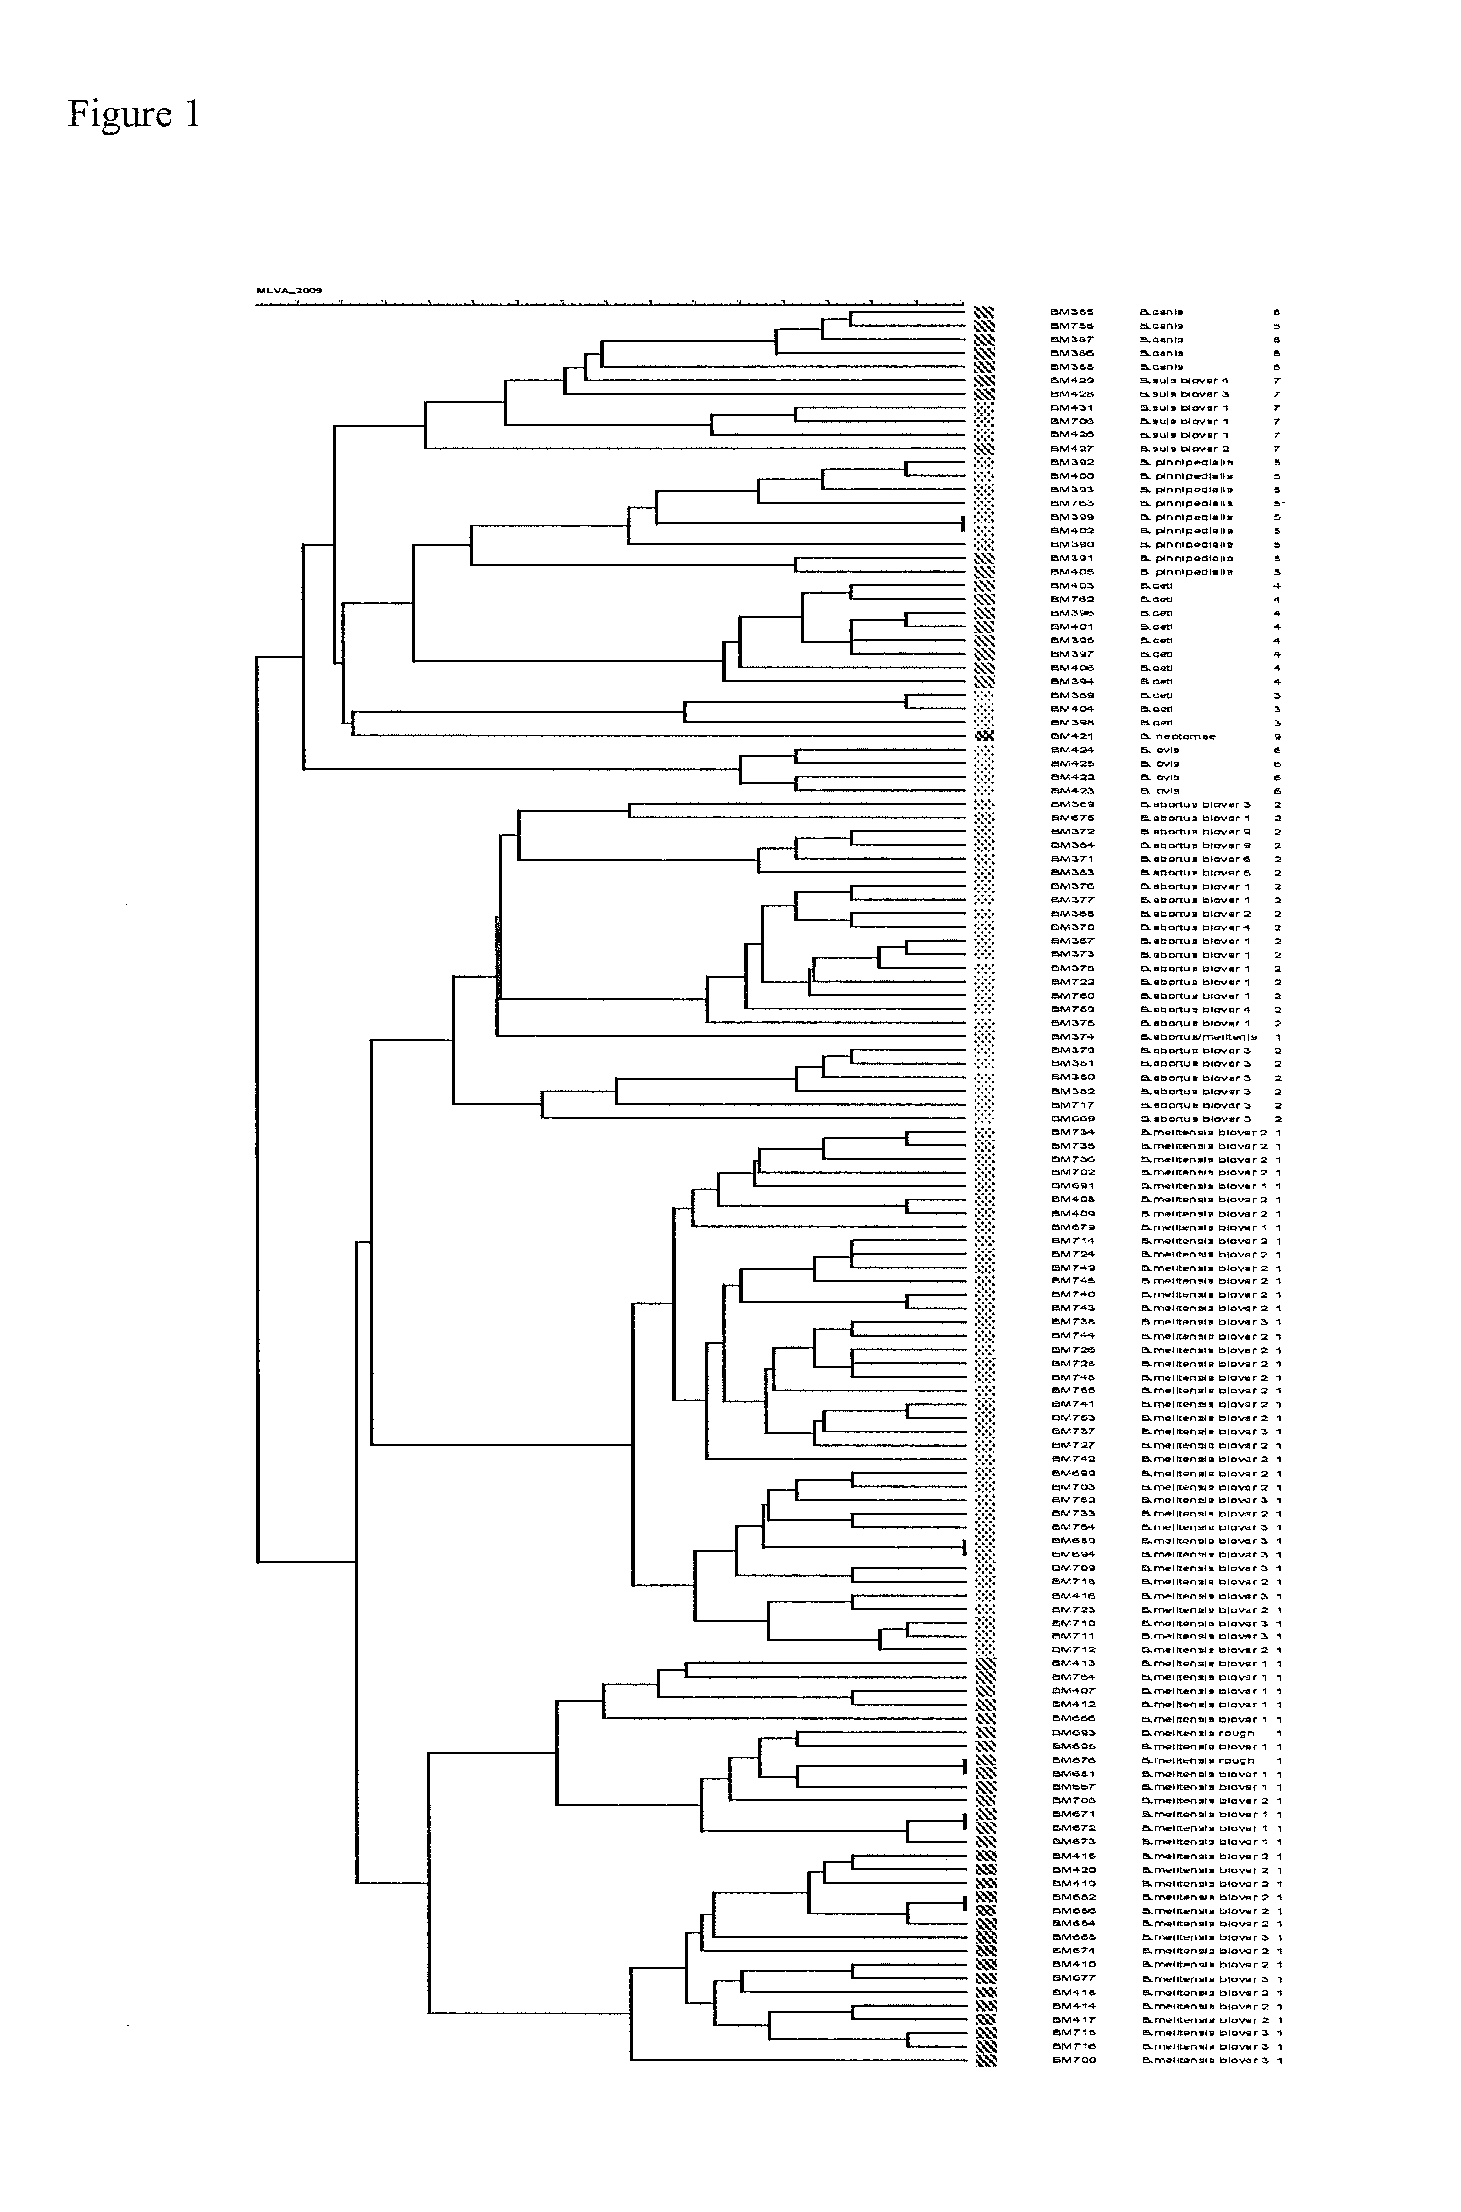
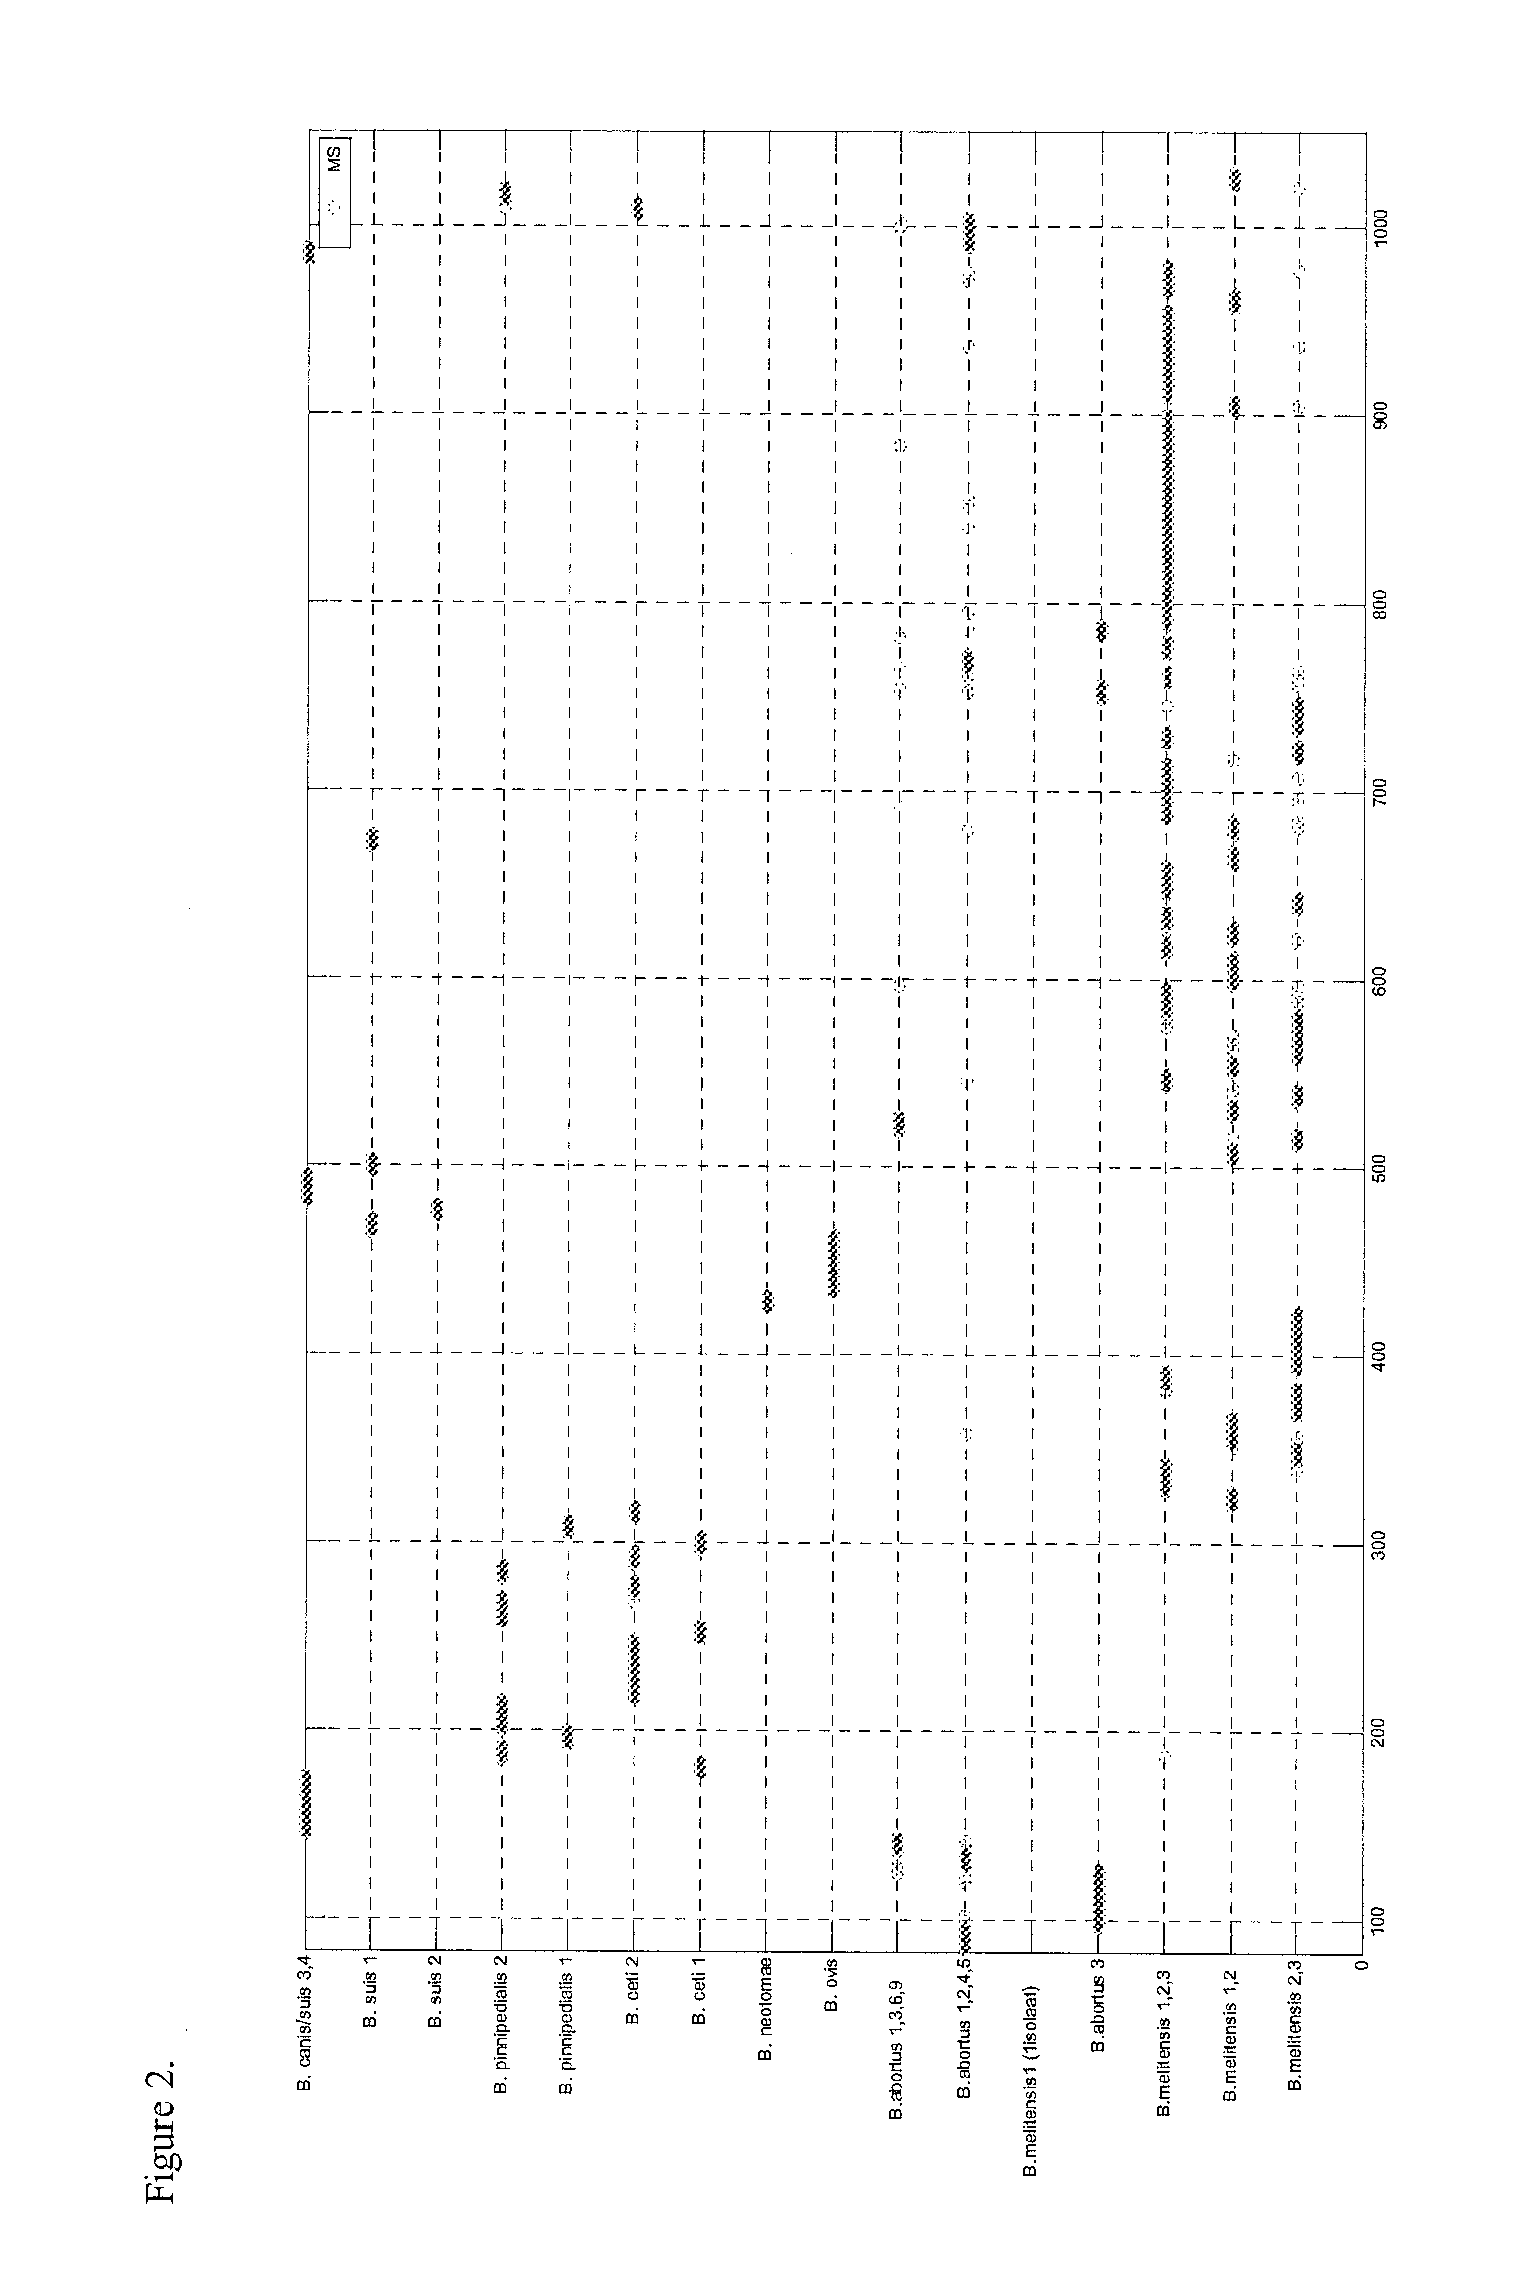
[0066]To improve the discriminatory power of MALDI-TOF MS based identification of Brucella isolates, a new approach was developed. First, Multi Locus Variable number tandem repeat Analysis (MLVA) was performed on 129 samples. MLVA clustering divided the isolates into 16 cluste...

example 2

[0073]Samples were constructed using spores, wheat and coffee creamer that were also used to generate MS-spectra for in the reference library. Each sample was measured four times. MS-spectra were measured as follows:[0074]Spin 300 μl Bacillus spores suspension 2 min. with 10,000 g.[0075]Remove solution and mix pellet with 10 μl 70% formic acid and 10 μl acetonitrile (absolute).[0076]Transfer the mixture directly on a luer-lock filter unit (Millex-GV4). Put the filter on to 1 ml syringe and press the mixture in a tube.[0077]Spot 1 μl on a plate. Air dry the spot.[0078]Spot 0.5 μl HCCA matrix. Air dry the spot again.[0079]Generate MS-spectra as descript in first step.

Data Analysis

[0080]The generated MS-data were normalized. Subsequently, a peak list was generated of each sample. Because samples could contain a mixture or a low amount of a particular agent the selection criteria were lowered compared to peak selection for constructing the library. Peaks selection was based on reproduci...


PUM


Abstract

The present invention relates to a new method for classification of spectral data comprising:a. analyzing at least two samples belonging to at least one cluster through recording of a spectrum;b. for each spectrum determining the peaks and the spectral value at which they occur;c. calculating the probability (p) of occurrence for each peak for every cluster and from this the odds ratio p / (1−p) for each peak;d. preparing a spectrum from a sample to be classified with the same technique as in step a);e. determine the peaks in the spectrum obtained in step d);f. calculate the likelihood of identity for each cluster by multiplying per cluster the odds ratio in said cluster for each peak found in the spectrum of step d); andg. assign the sample tested in step d) to the cluster that provides the largest number as a result of step f).The invention also comprises a system for performing such a method and the use of such a system for classification of spectral data.

Description

[0001]The present invention relates to methods for data processing, more specifically for data processing of data derived from spectrographic analyses, such as mass spectrometry, MALDI, Raman spectrometry, and the like, in order to classify an unknown sample as belonging to a cluster of already identified samples.BACKGROUND[0002]Nowadays, spectrographic methods are frequently used to analyse biomaterials. Whereas initially spectrometry was most heavily used in the fields of chemistry, and for the detection of (single) reaction compounds, it has increasingly become used in the biosciences for the analysis of biological samples.[0003]In these analyses it can be the goal to analyse whether or not a known substance is present in the sample—as is the case in the detection of biomolecules such as proteins or polysaccharides in a sample—, but it can also be used to monitor biological processes. In biological samples in most cases many components, each giving their own spectral peaks, are c...

Claims


Application Information

Patent Timeline
Patent Type & Authority Applications(United States)
IPC IPC(8): G06N3/00
CPCG06N3/002G16C20/20G16C20/70
Inventor PAAUW, ARMANDPARCHEN, RENE
Owner NEDERLANDSE ORG VOOR TOEGEPAST-NATUURWETENSCHAPPELIJK ONDERZOEK (TNO)
Learn More