Material identification using multiple images

a material identification and image technology, applied in the field of multiple image identification methods, can solve the problems of not being able to combine all images, not being able to provide a visual connection between the resultant image and the distribution of individual chemical elements, and being unable to direct the construction of x-rays, so as to reduce the measure of collinearity and improve the use of processing resources.

Active Publication Date: 2014-02-06
OXFORD INSTR NANOTECH TOOLS
View PDF12 Cites 16 Cited by
  • Summary
  • Abstract
  • Description
  • Claims
  • Application Information

AI Technical Summary

Benefits of technology

[0017]While an expert may be able to achieve a similar aim with manual selection of colours and mixture, the aim of the invention is to achieve this on any assemblage of images by an automatic algorithm that requires no user intervention. The great advantage of this is that users no longer need to be experts in image processing in order to ensure they gain the full benefit of an output colour image with a beneficial colour scheme.
[0024]As mentioned above, in some implementations not all of the datasets are assigned different colours. For example, if a plurality of image datasets are evaluated as having sufficiently similar spatial intensity information, then either one of such datasets may be selected or a combined image dataset may be formed from the said plurality of image datasets for further processing. Such datasets may be removed as part of a collinearity calculation. The image datasets may also be processed in other ways, for example by evaluating the effect of noise within each image dataset. If this is performed at an early stage in the method then this allows for more efficient use of processing resources by removing from the method any image datasets in which the variation in intensity is not above a noise threshold.
[0026]Having assigned the appropriate colours to the selected datasets, these preferably having appropriate Red, Green and Blue values, the method typically includes summing such values in the contributing datasets in order to form the output colour image dataset having corresponding Red, Green and Blue values. Whilst this approach uses the additive nature of primary colours, it may be preferred to use pixel intensity values of the output colour image dataset according to a subtractive colour model. Such a subtractive model has greater parallels with the mixing of paints and this may provide more intuitive mixtures of colours.

Problems solved by technology

If N>3, it is not possible to combine all the images in this fundamental way because there are only 3 independent channels for a typical RGB colour display.
However, when multivariate statistical approaches are used to extract components, each derived component image is a mathematical abstraction that does not necessarily bear any direct relationship to any of the original N images.
However, there is no attempt to provide a visual connection between the resultant image and the distribution of individual chemical elements that would normally be shown as a series of x-ray elemental maps. FIG. 1 summarises this prior art and shows that there is no direct connection between the construction of x-ray elemental maps and the visualisation of components derived by MSA.
However, if several of the original images are similar in appearance, in pixels where these images dominate over the others, the resultant pixel colour will not correspond to any one of the original images so the correspondence between original image and resultant image will be lost.

Method used


Image

  • Material identification using multiple images
  • Material identification using multiple images
  • Material identification using multiple images

Examples


Embodiment Construction

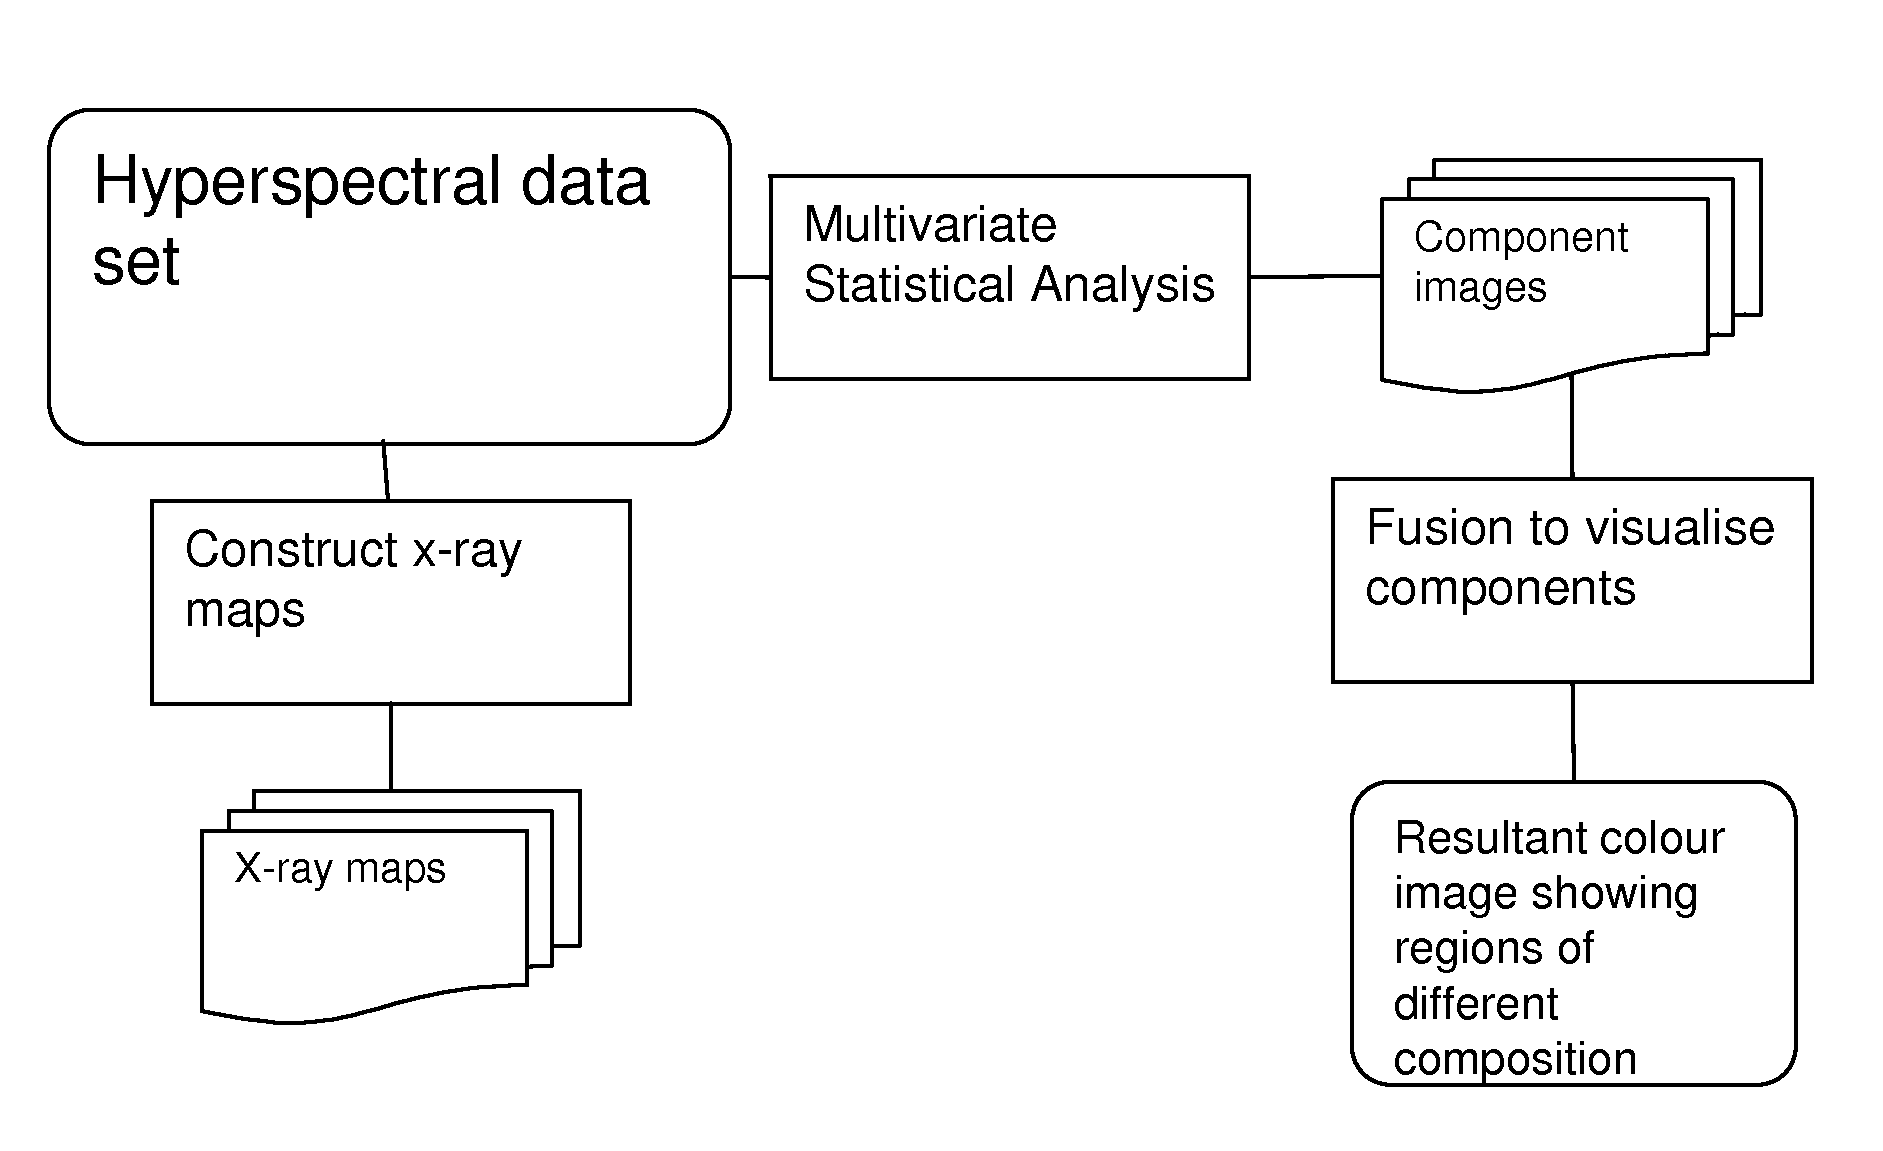
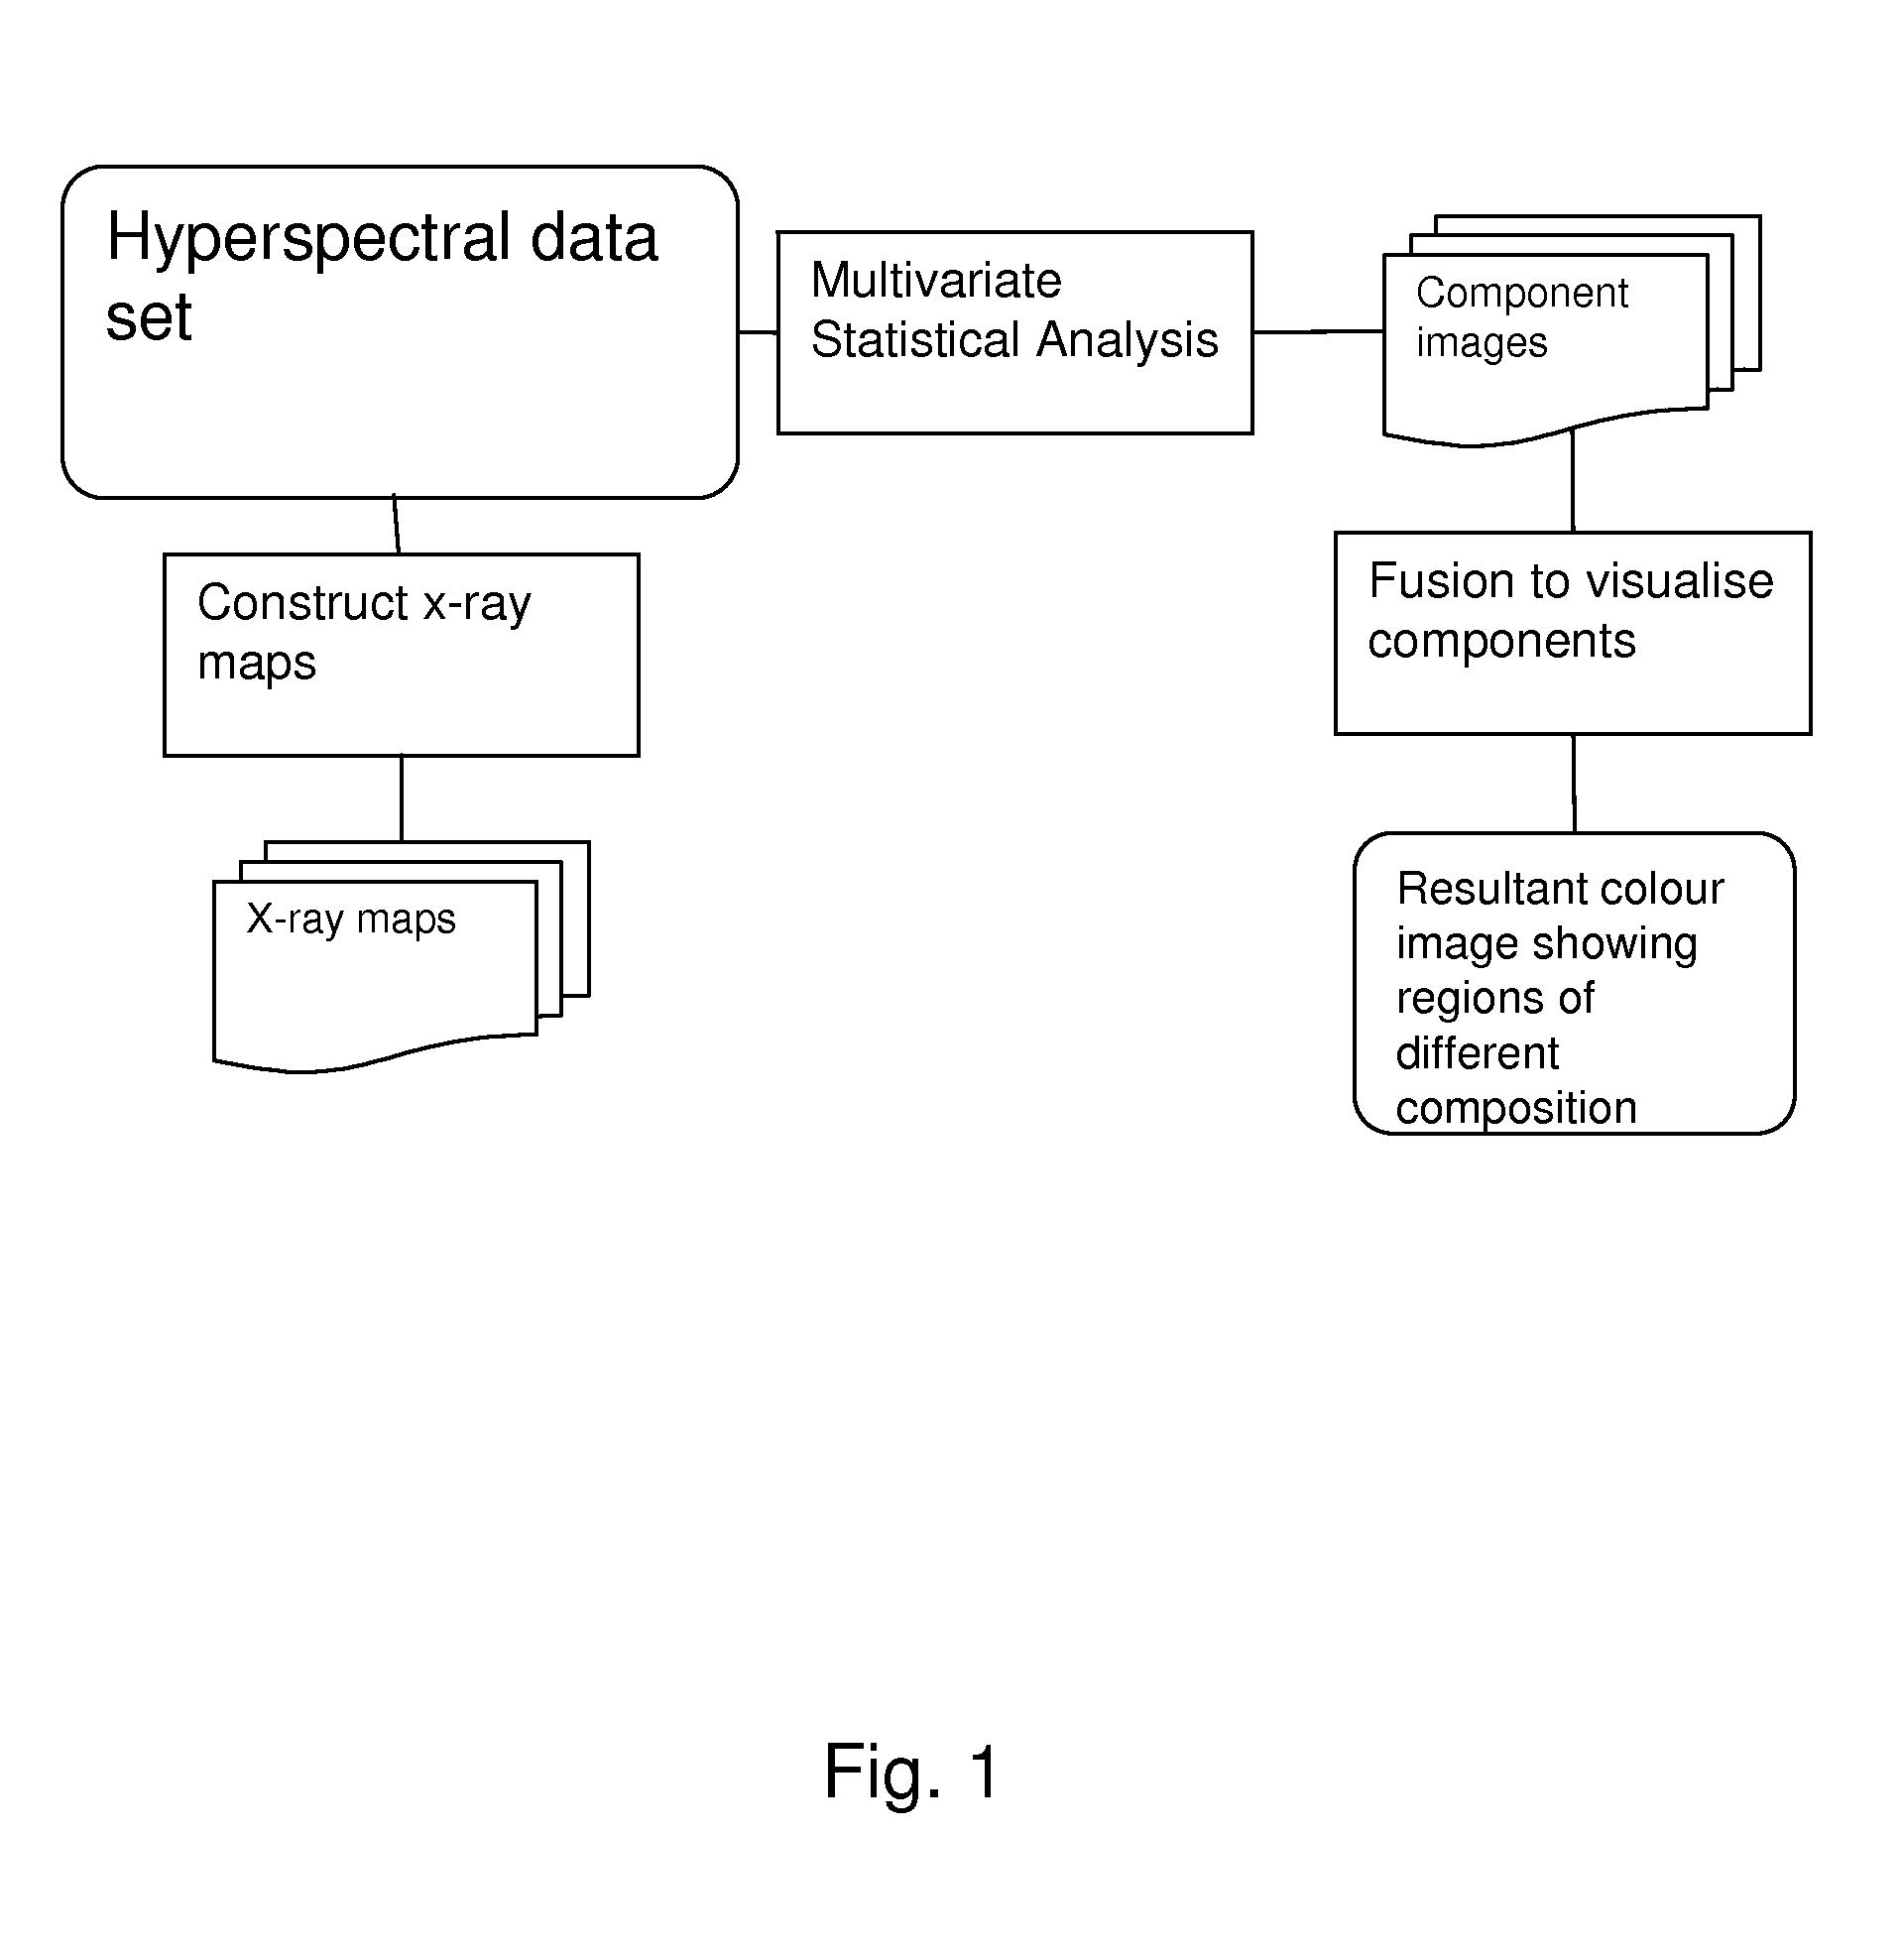
[0038]We now describe some examples of the invention. For illustration purposes we refer mainly to the case where each original image represents the concentration of a particular chemical element at all pixel positions and is referred to as an “element map”. However, the approach can also be applied to any collection of images that are in perfect registration so that the signals for the same pixel location in every image are associated with the same position in the real object field of view (i.e. a “multi-spectral” set of images as described above).

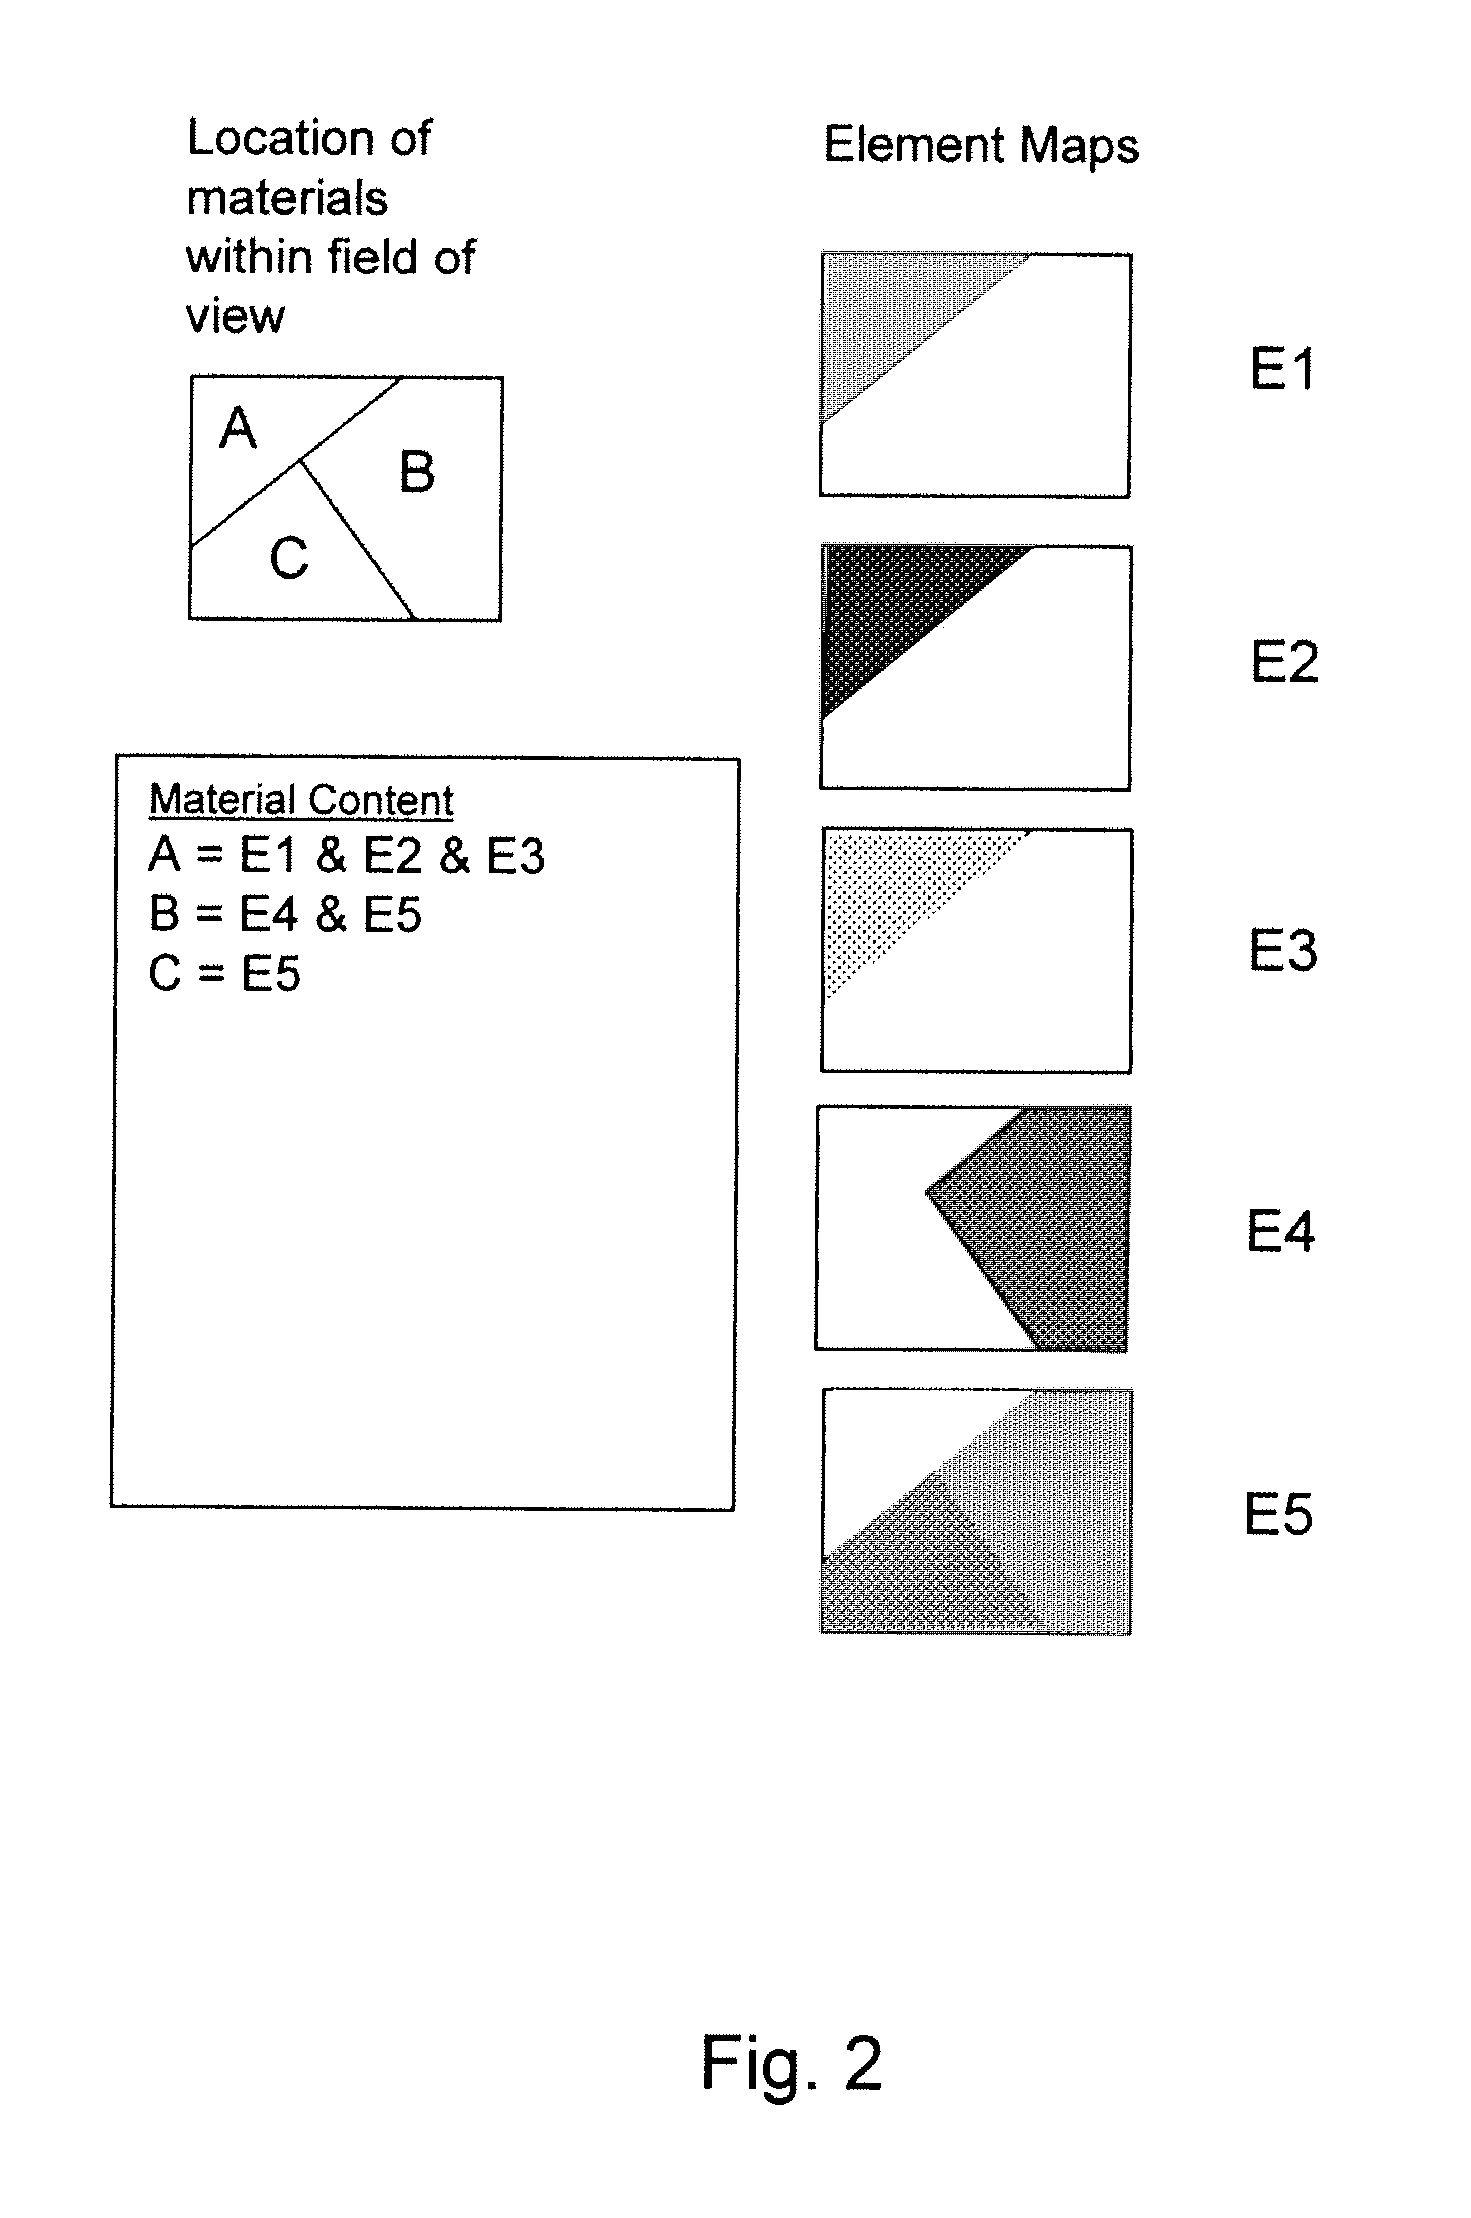
[0039]When a region for a particular material is in the “field of view” of an analysis system, it will contain certain elements in a fixed proportion. FIG. 2 shows an example field of view where three different materials, A, B and C are visible. Element maps are acquired for the elements E1, E2, E3, E4 and E5. These are also illustrated in FIG. 2. Since E1, E2 and E3 only occur within material A, the maps for E1, E2 and E3 are very simila...


PUM


Abstract

A computer-implemented method of image processing for materials analysis is provided. At least three image datasets are obtained, these representing intensity values of image pixels and being in common spatial registration. The image datasets are processed so as to assign a comparison measure to each pair of image datasets, the comparison measure for a given pair of image datasets being representative of the difference between the spatial intensity information within the pair. A number of image datasets are then selected using the comparison measures. A colour difference measure is defined which represents the difference between pairs of colours of a colour set. Colours are assigned to the selected image datasets such that pairs of the selected image datasets which have substantially different spatial intensity information are assigned respective colours which have a substantially different colour difference measure. A number of the selected image datasets are then combined together to form an output colour image dataset for the formation of a colour image. The combination is such that each pixel of the colour image takes on a colour according to the relative intensities and colours of the selected image datasets so that if the pixel intensity of one dataset is substantially greater than the sum of the pixel intensities for all the other selected datasets, then the output colour in the respective part of the image will substantially match the colour assigned to that image dataset.

Description

FIELD OF THE INVENTION[0001]The present invention relates to methods for material identification using multiple images, for example in the generation of multiple colour images in order to assist a user in understanding image data. The invention includes unsupervised methods for taking data from multiple signal sources and displaying a single visual image that reveals regions with different material composition.BACKGROUND TO THE INVENTION[0002]There exists a well-established technique for acquiring digital X-ray images using a scanning electron microscope (SEM) and one or more X-ray detectors. This technique involves directing an electron beam sequentially over a grid of points on a specimen surface. At each grid point, measurements are made at a specific X-ray energy with a so-called “wavelength dispersive spectrometer” (WDS), or an X-ray energy spectrum is acquired and data are extracted from this spectrum for selected chemical elements of interest using an energy dispersive spectr...

Claims


Application Information

Patent Timeline
Patent Type & Authority Applications(United States)
IPC IPC(8): G06T11/00
CPCG06T11/001
Inventor STATHAM, PETER J.
Owner OXFORD INSTR NANOTECH TOOLS
Why Eureka
Try Eureka