Prediction of future energy and demand usage using historical energy and demand usage

a technology of energy demand and energy consumption, applied in the direction of material dimension control, process and machine control, instruments, etc., can solve the problems of energy consumption, information is not typically readily available or presented in a manner, and none, perhaps, is more difficult to decipher than the electric bill, so as to improve the management of energy consumption and the associated energy cos

Inactive Publication Date: 2014-08-14
CABRINI AL
View PDF7 Cites 20 Cited by
  • Summary
  • Abstract
  • Description
  • Claims
  • Application Information

AI Technical Summary

Benefits of technology

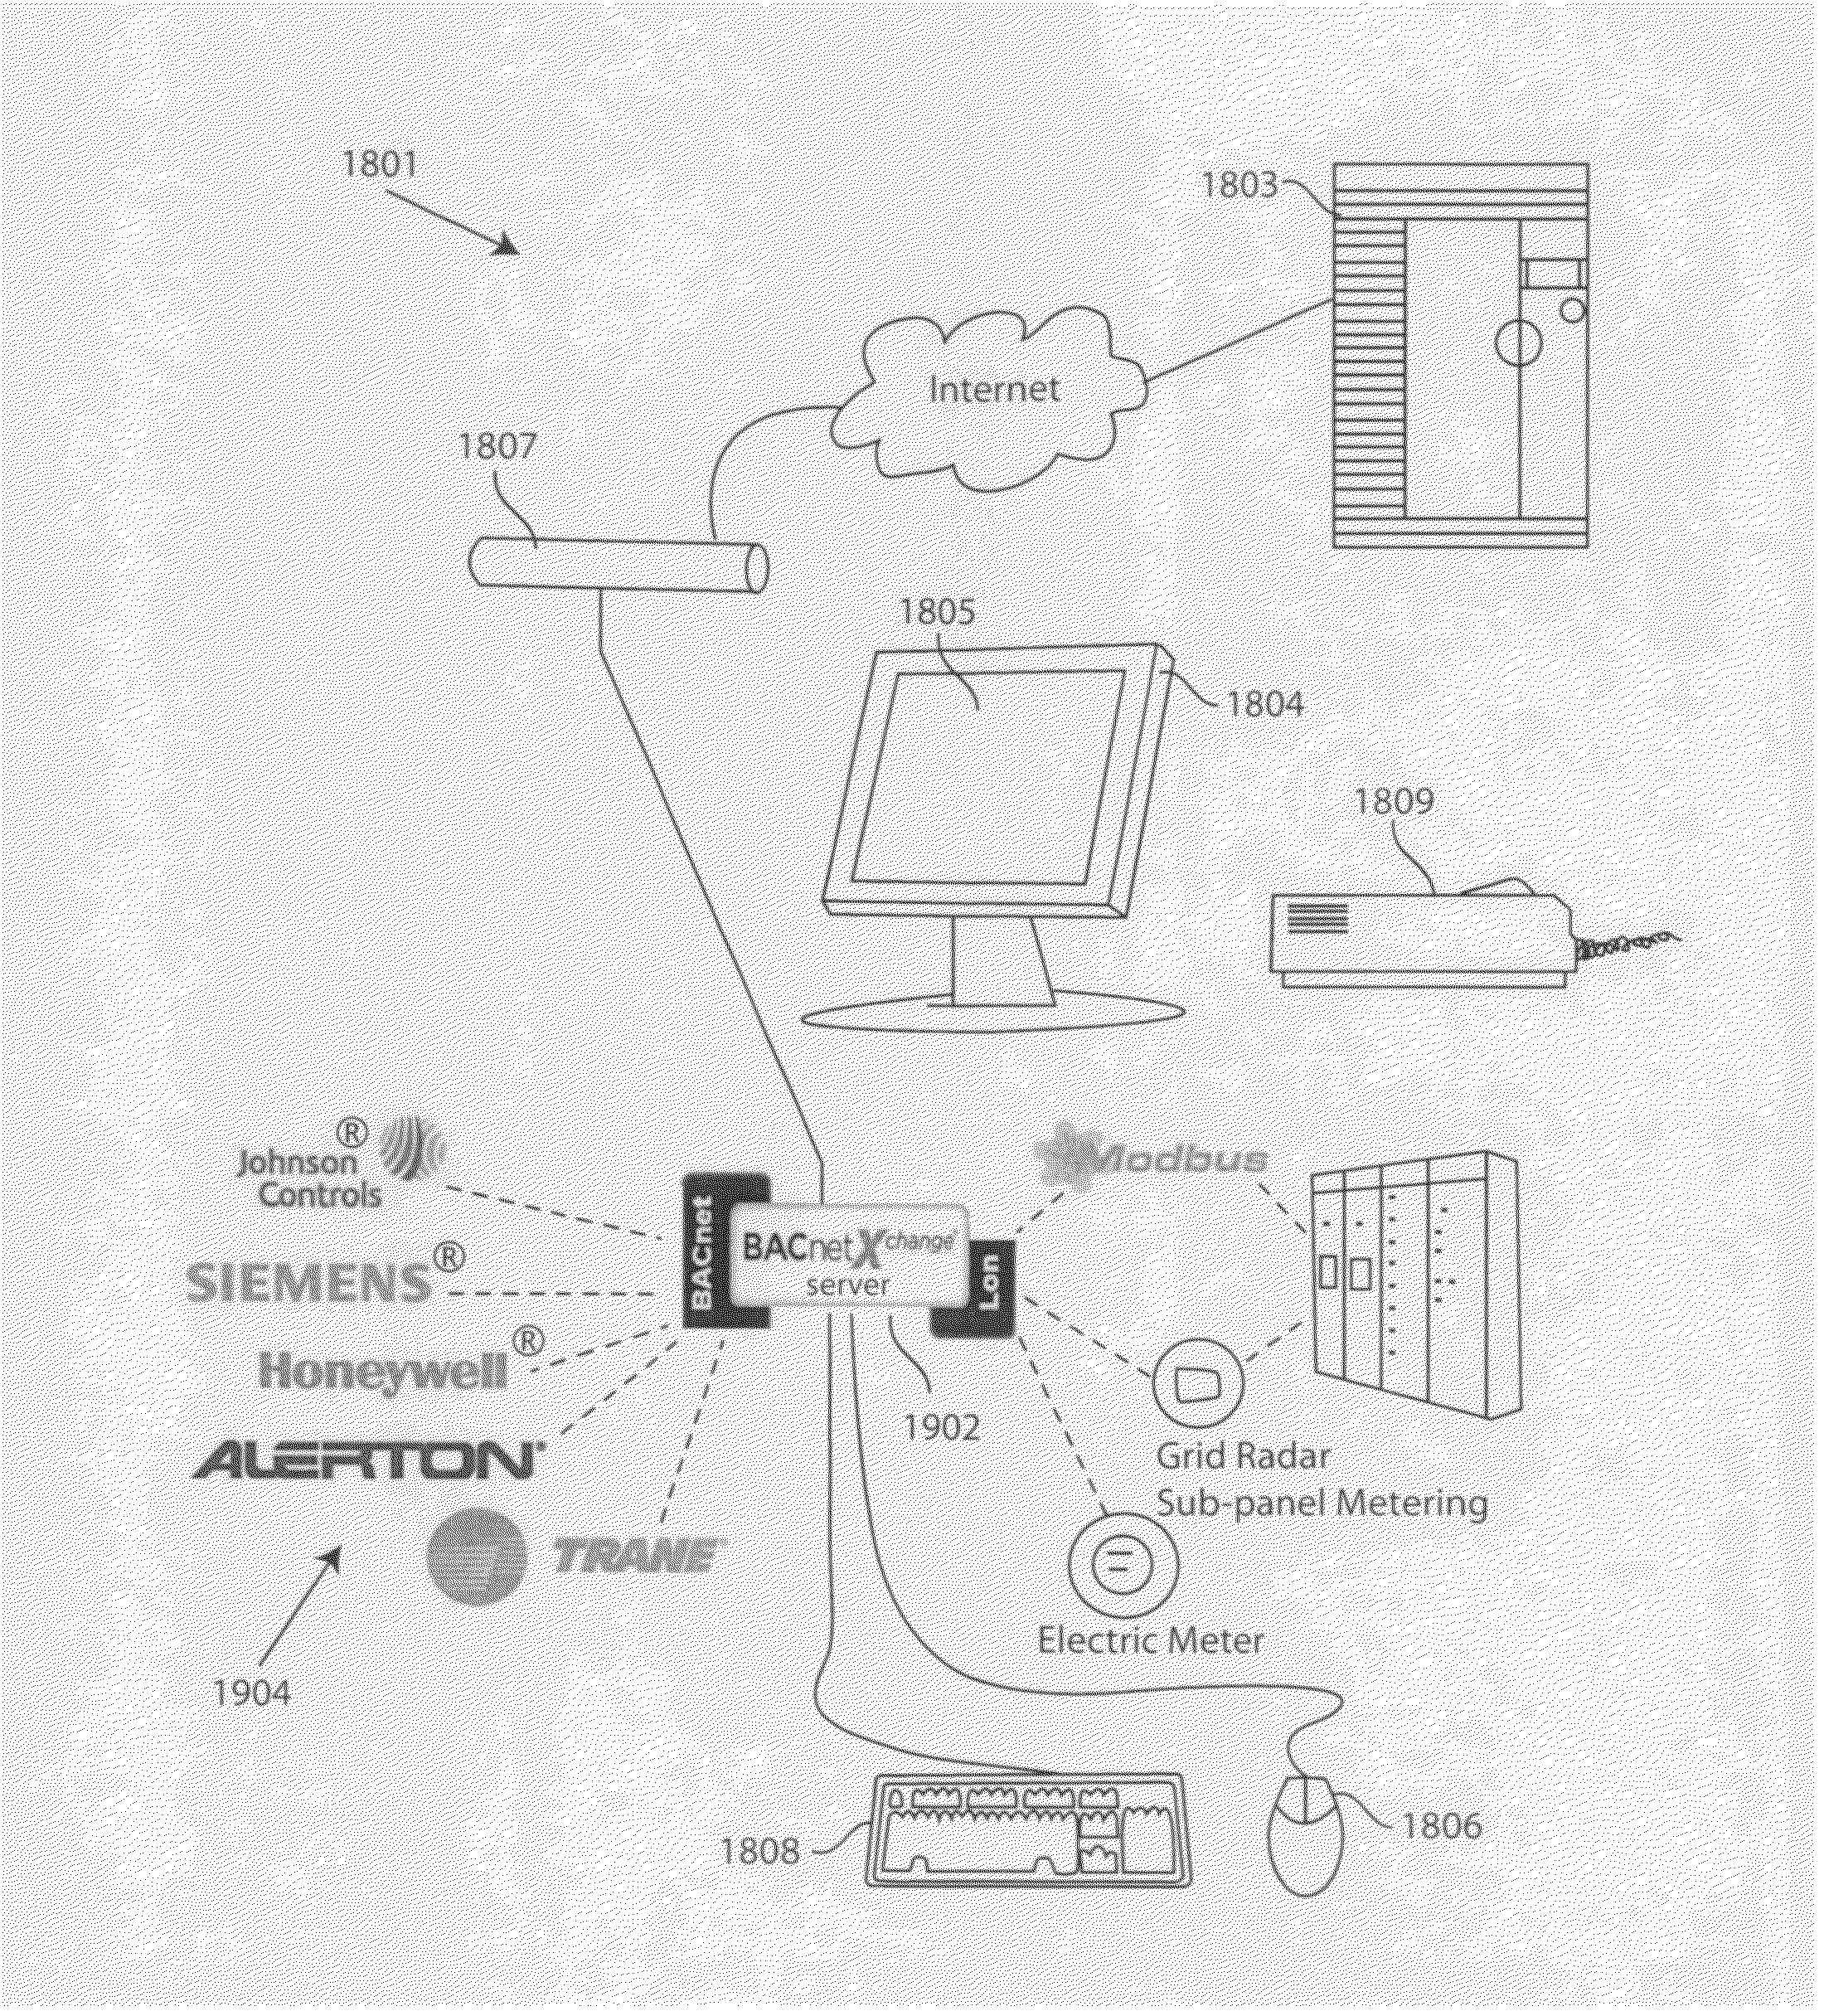
[0012]The various examples of the present invention address the above-described challenges, with important improvements over the prior art to predict energy and demand usage, thereby enabling improved management of energy consumption and attendant energy costs resulting from predictive optimization using intraday energy and demand usage forecasting. Intraday forecasting allows prediction of energy and demand spikes and enables automated demand reduction strategies to be launched before predicted demand events occur. Additional examples of the present invention comprise interfacing with building management systems and energy cost control applications that control the operation of facilities, including manufacturing equipment, lighting, heat, air conditioning, and ventilation (HVAC) equipment, etc. In accordance with further examples of the present invention, reporting is made accessible for visualization by management, for example, managers in a variety of commercial businesses monitoring predicted energy and demand usage on a substantially current basis and to provide a view of projected energy and demand usage, as well as the capability to present associated energy consumption costs for visualization.

Problems solved by technology

Energy consumption is one of the key costs for various industries, for example, in the cost of operation of a manufacturing or other commercial facility.
Detailed energy consumption data with time stamps may be collected by information systems, but the information is not typically readily available or presented in a manner to be quickly assimilated by management of the facility for managing energy consumption or the related costs.
Of all the utility bills that a consumer receives each month, none, perhaps, is more difficult to decipher than the electric bill.
Instead, however, the known at for producing electric utility bills is so convoluted that it often requires a separate ledger to understand what a consumer is being, asked to pay for.
The conventional approach regarding electric energy consumption, compiled on a monthly basis, does not provide daily or hourly or more granular detail, and the reasons for incurring the associated costs can no longer be readily identified.
The prior art does not provide a comprehensive and user-friendly view of electric energy consumption to enable control of energy consumption or estimation of energy costs.
However, the recorded measurements used to create the histogram could not be used in a meaningful manner by consumers in their automated building management systems or energy cost control applications or to predict future demand usage, because the historical data may not correlate with the current values of parameters which determine the cost of energy consumption based on demand usage since demand usage is not readily predictable based on historical data alone.
To avoid exceeding, demand, there may often be drastic compromises implemented on short notice.

Method used


Image

  • Prediction of future energy and demand usage using historical energy and demand usage
  • Prediction of future energy and demand usage using historical energy and demand usage
  • Prediction of future energy and demand usage using historical energy and demand usage

Examples


Embodiment Construction

[0023]Various example embodiments of the present invention provide a system and method for generating predicted energy and demand usage data and periodic graphs and / or reports for visualization of the predicted energy and demand usage data and distribution of the predicted data. For example, these are valuable in helping managers of consumers to identify the predicted energy and demand usage and associated cost of energy consumption.

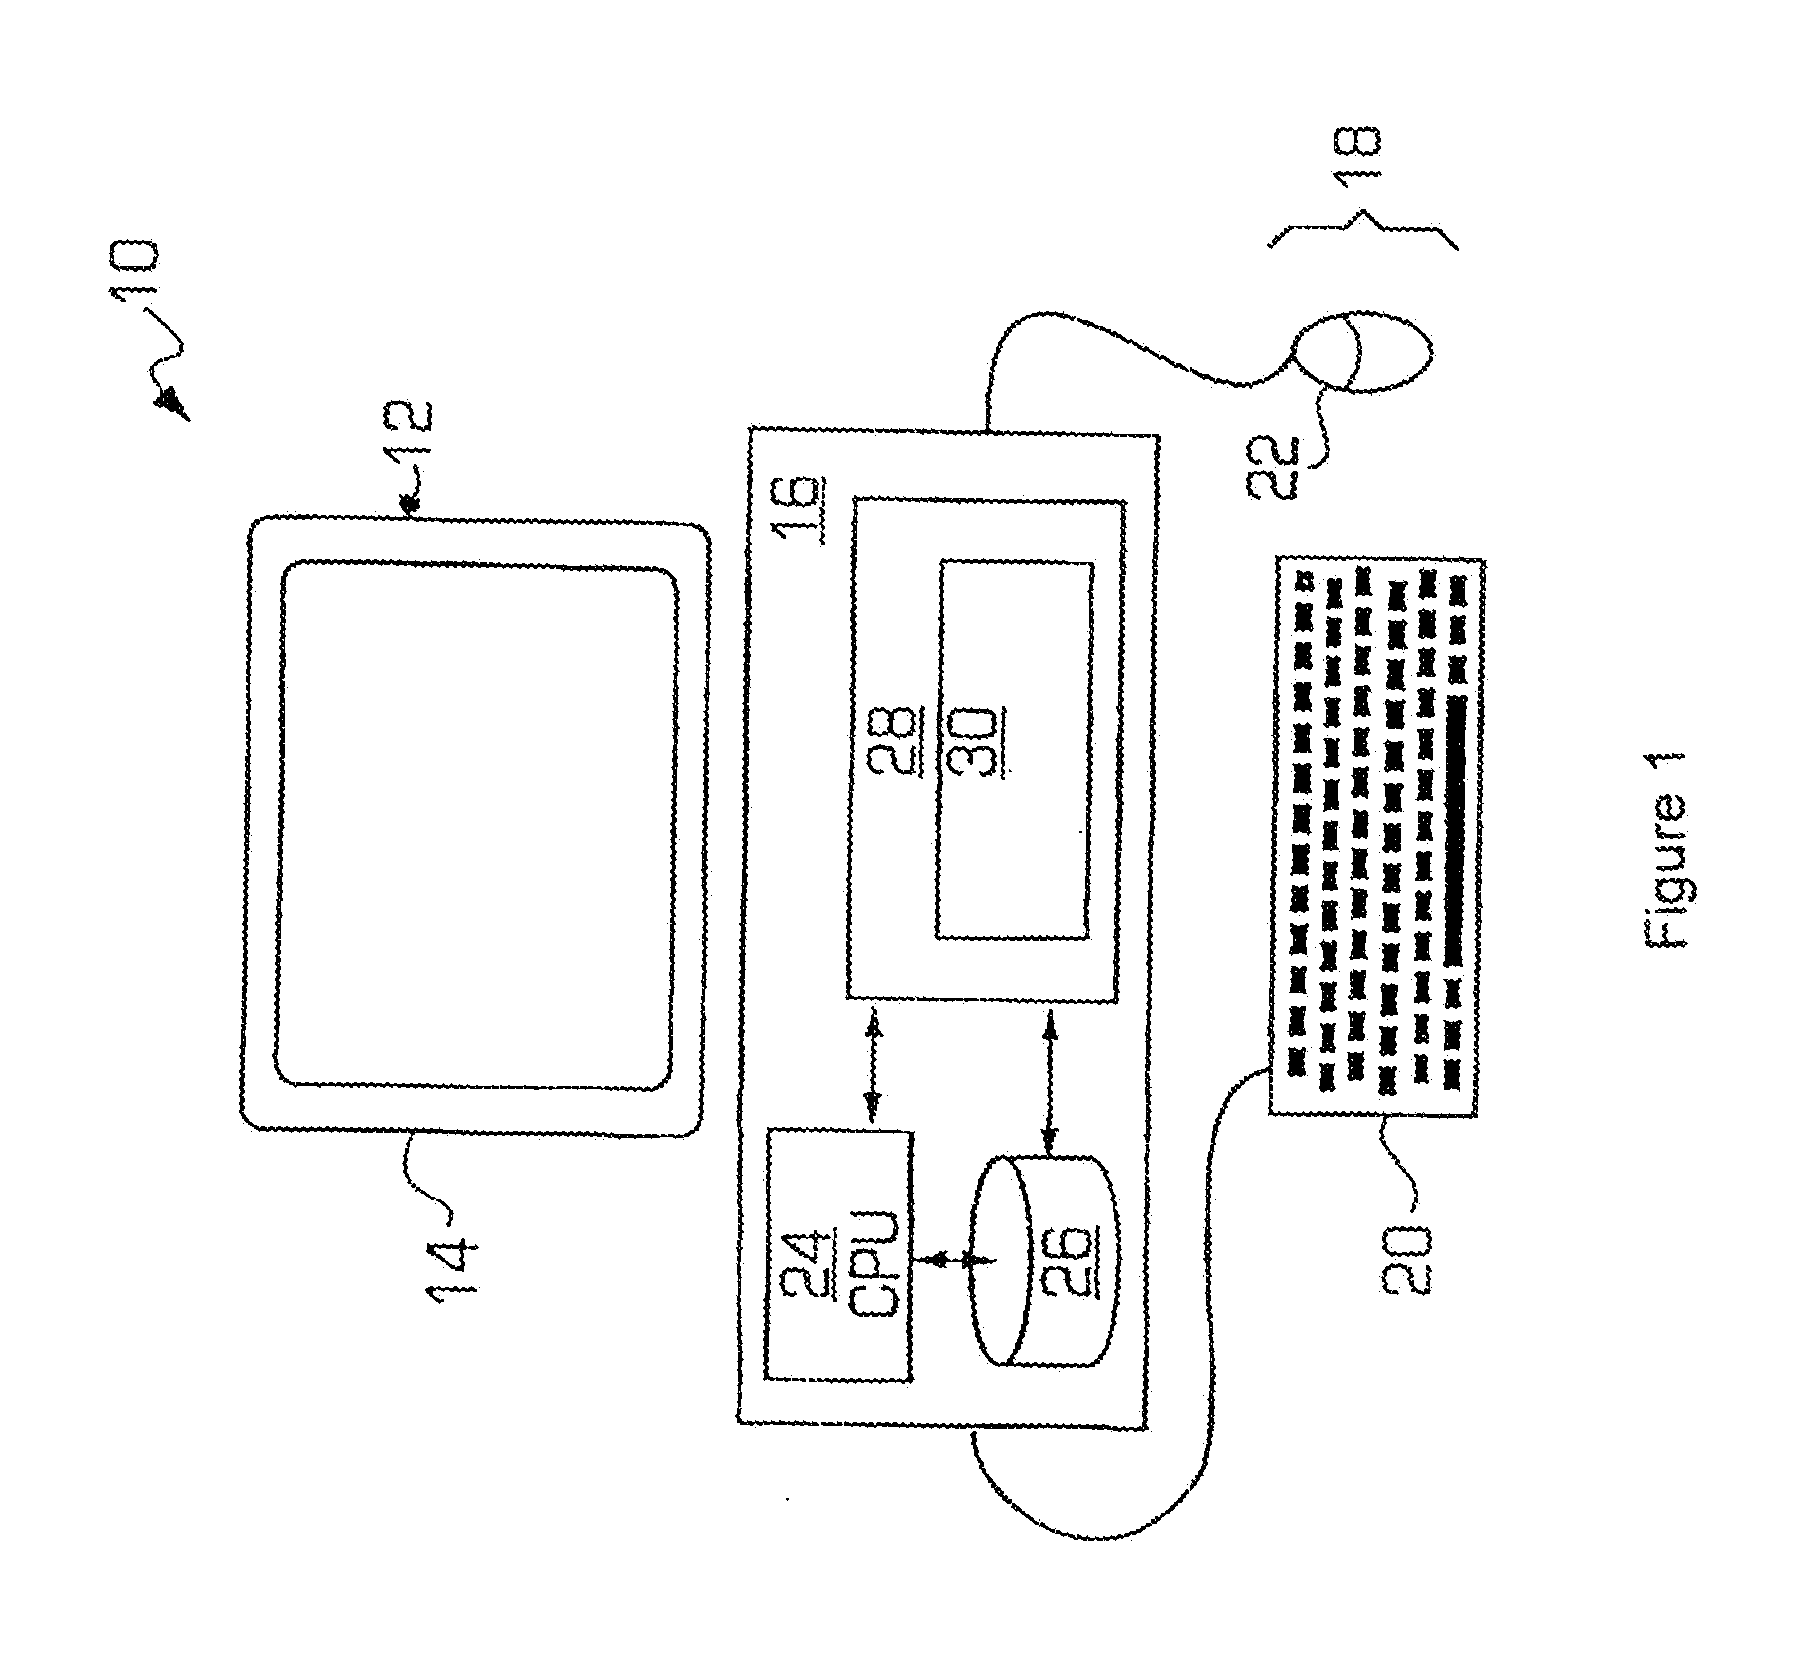
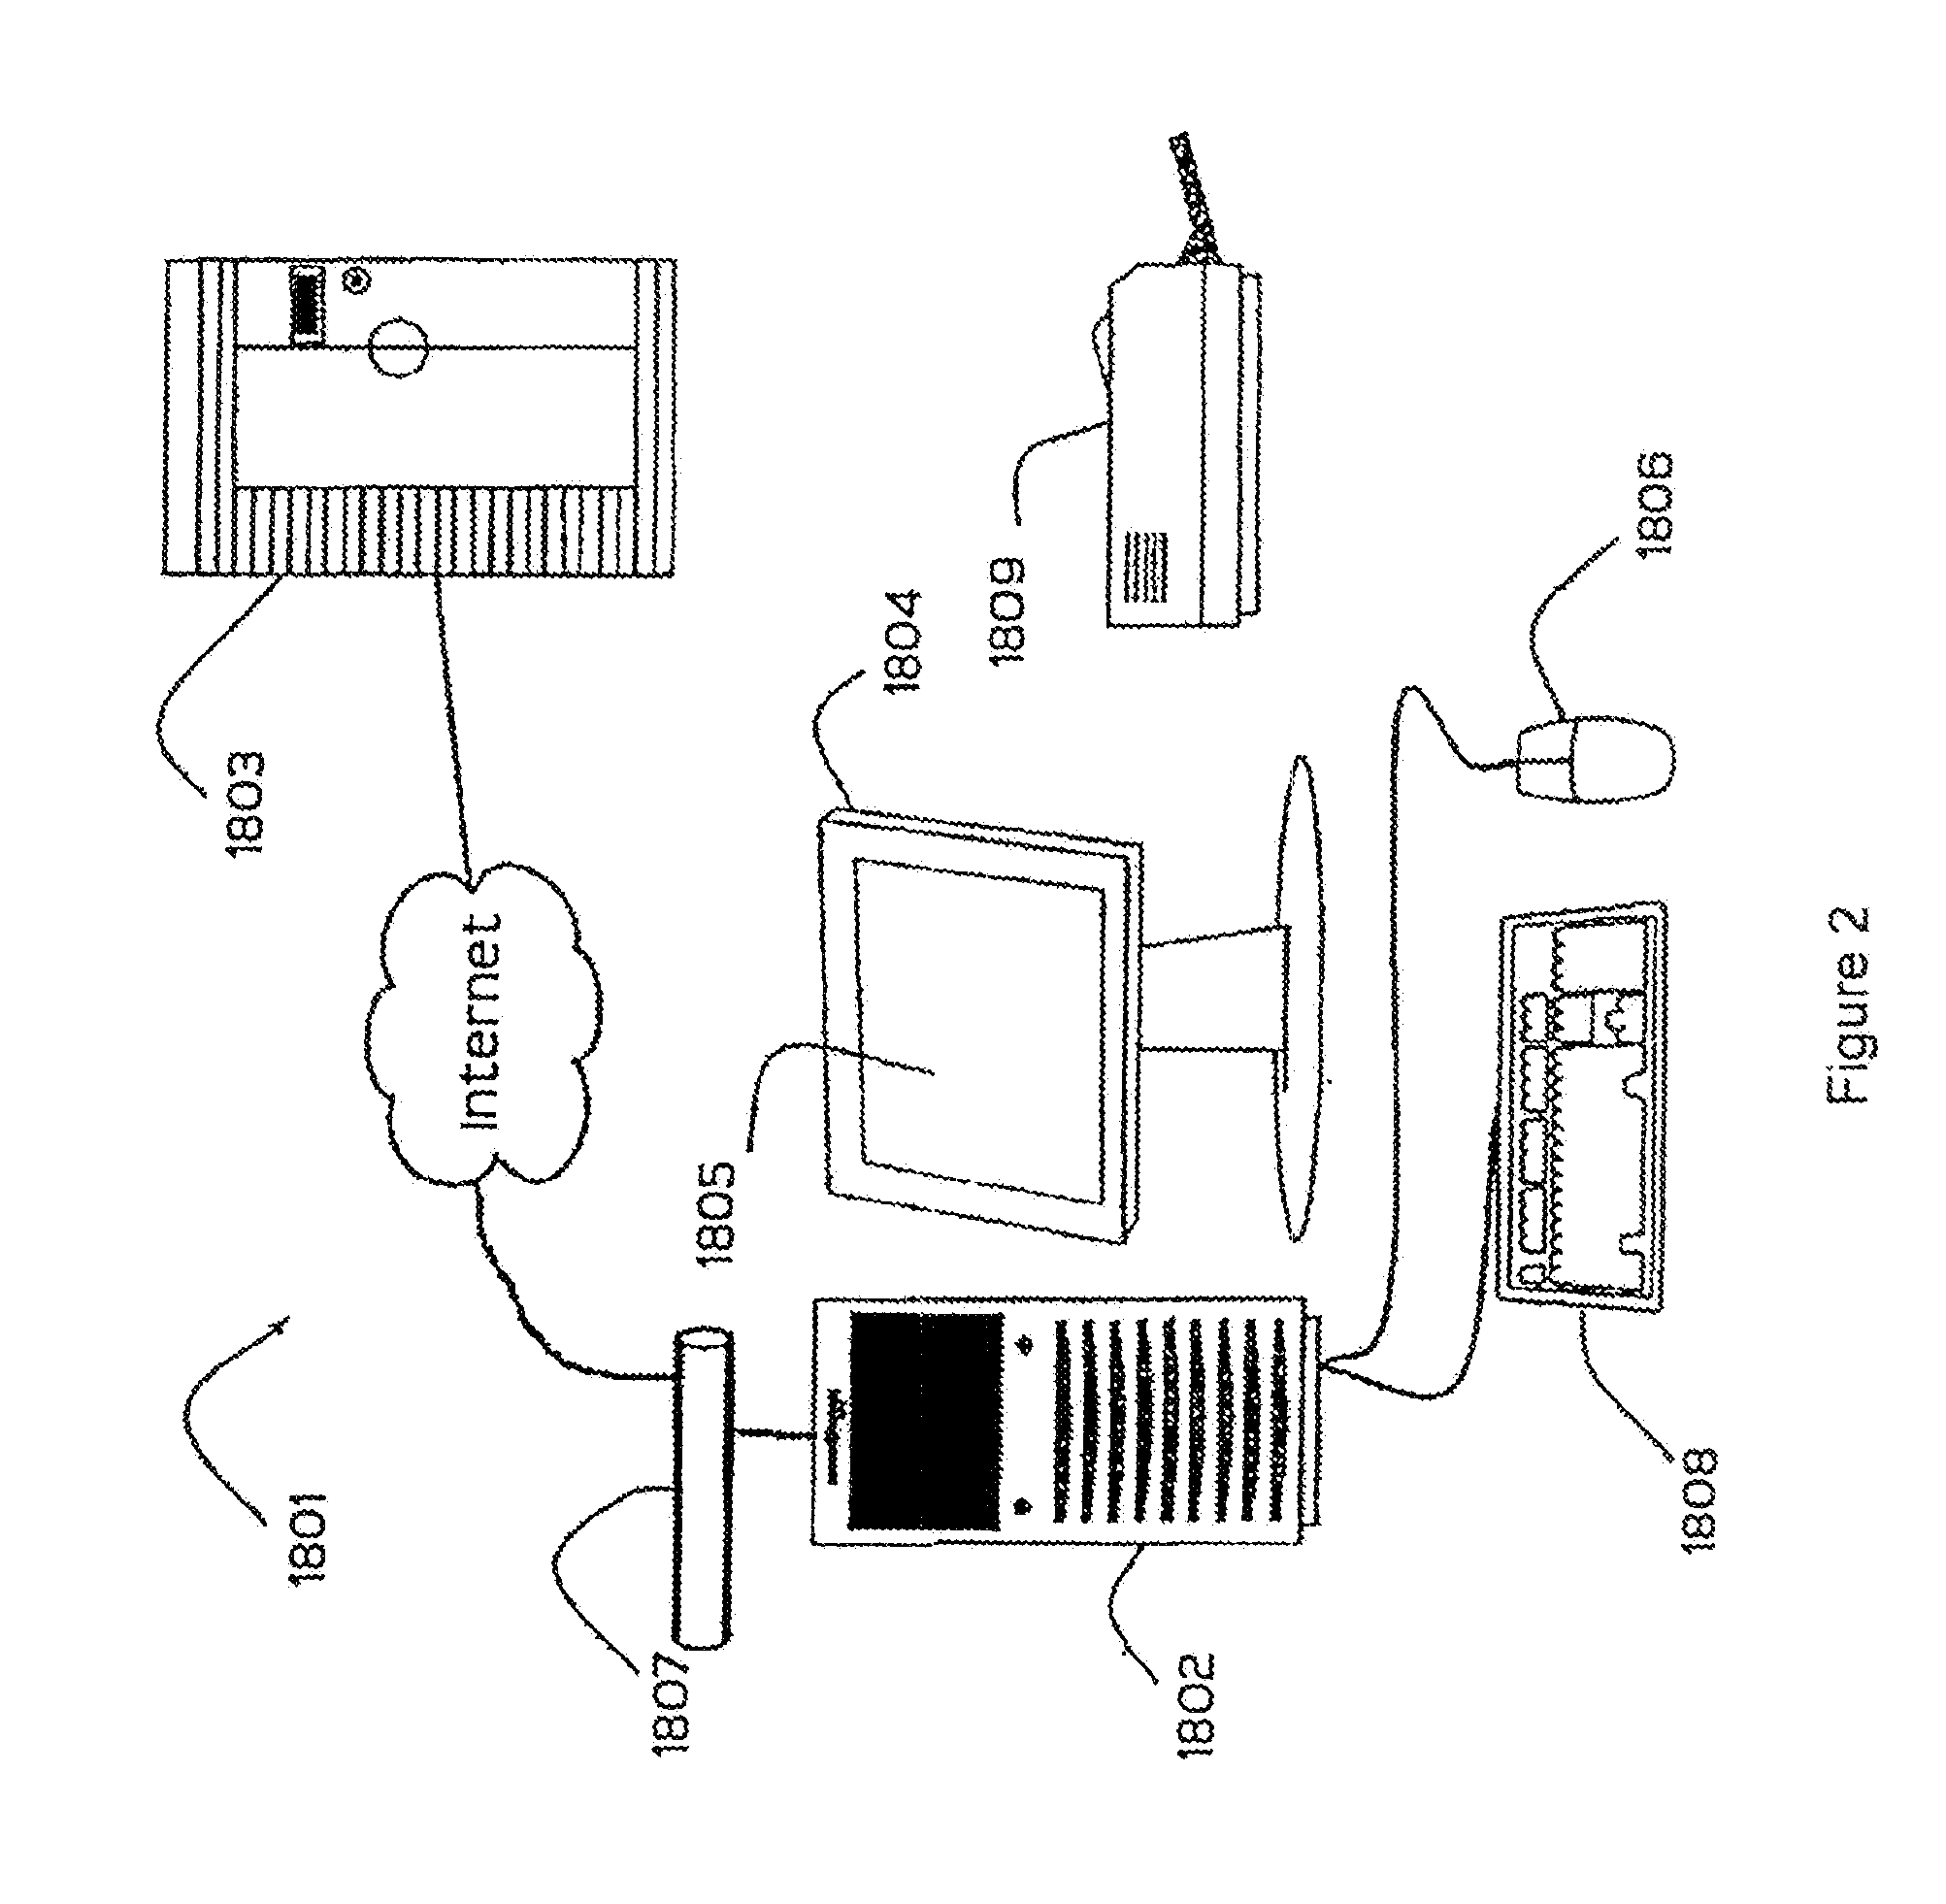
[0024]One aspect of the present invention provides periodic computation of energy and demand usage. Another aspect provides a graphical presentation of energy and demand usage and as plurality of reporting options. Another aspect of the present invention provides computer instructions stored on or in a computer-readable medium and capable of being executed by a processor to implement the desired periodic energy and demand usage computations and automate the creation of graphs and optional reports and distribution to recipients, for example, via email.

[00...


PUM


Abstract

A system, method, and computer program provide predicted energy and demand usage information. The information may be communicated to management in both graphical and report form. The information provides management with an immediate understanding of projected energy and demand usage in a time frame where the energy and demand usage can be associated with underlying causes. The result is that the need to devote considerable time and expertise to obtain and understand important energy consumption data are eliminated.

Description

CROSS-REFERENCE TO RELATED PATENT APPLICATION[0001]This application relates to U.S. Provisional Patent Application No. 61 / 598,897 filed on Feb. 14, 2012, entitled PREDICTION OF FUTURE DEMAND USING HISTORICAL DEMAND USAGE, which is hereby incorporated herein in its entirety by this reference.FIELD OF THE INVENTION [0002]This invention relates to the field of predicting anticipated energy consumption, for example, projected energy usage by consumers of energy such as electrical energy. By way of example, but not by way of limitation, one example of the present invention provides computer assisted prediction of energy and demand usage by energy consuming facilities based in part on historical energy and demand usage, and, more particularly, provides a prediction of energy and demand usage for a given consumer facility for a future time interval based on previous energy and demand usage by that facility and associated parameters, which may be employed in automated building management sy...

Claims


Application Information

Patent Timeline
Patent Type & Authority Applications(United States)
IPC IPC(8): G06Q50/06
CPCG06Q50/06
Inventor CABRINI, AL
Owner CABRINI AL
Why Eureka
Try Eureka