

Urine Biomarkers
- Summary
- Abstract
- Description
- Claims
- Application Information
AI Technical Summary
Benefits of technology
Problems solved by technology
Method used
Image

Examples
example 1
Materials and Methods
[0125]A biomarker analysis for prostate cancer in urine-derived microvesicles was performed by obtaining urine samples, isolating microvesicles from the samples, extracting nucleic acids from the microvesicles, and detecting the expression levels of ERG, TMPRSS2:ERG, PSA, and GAPDH genes.
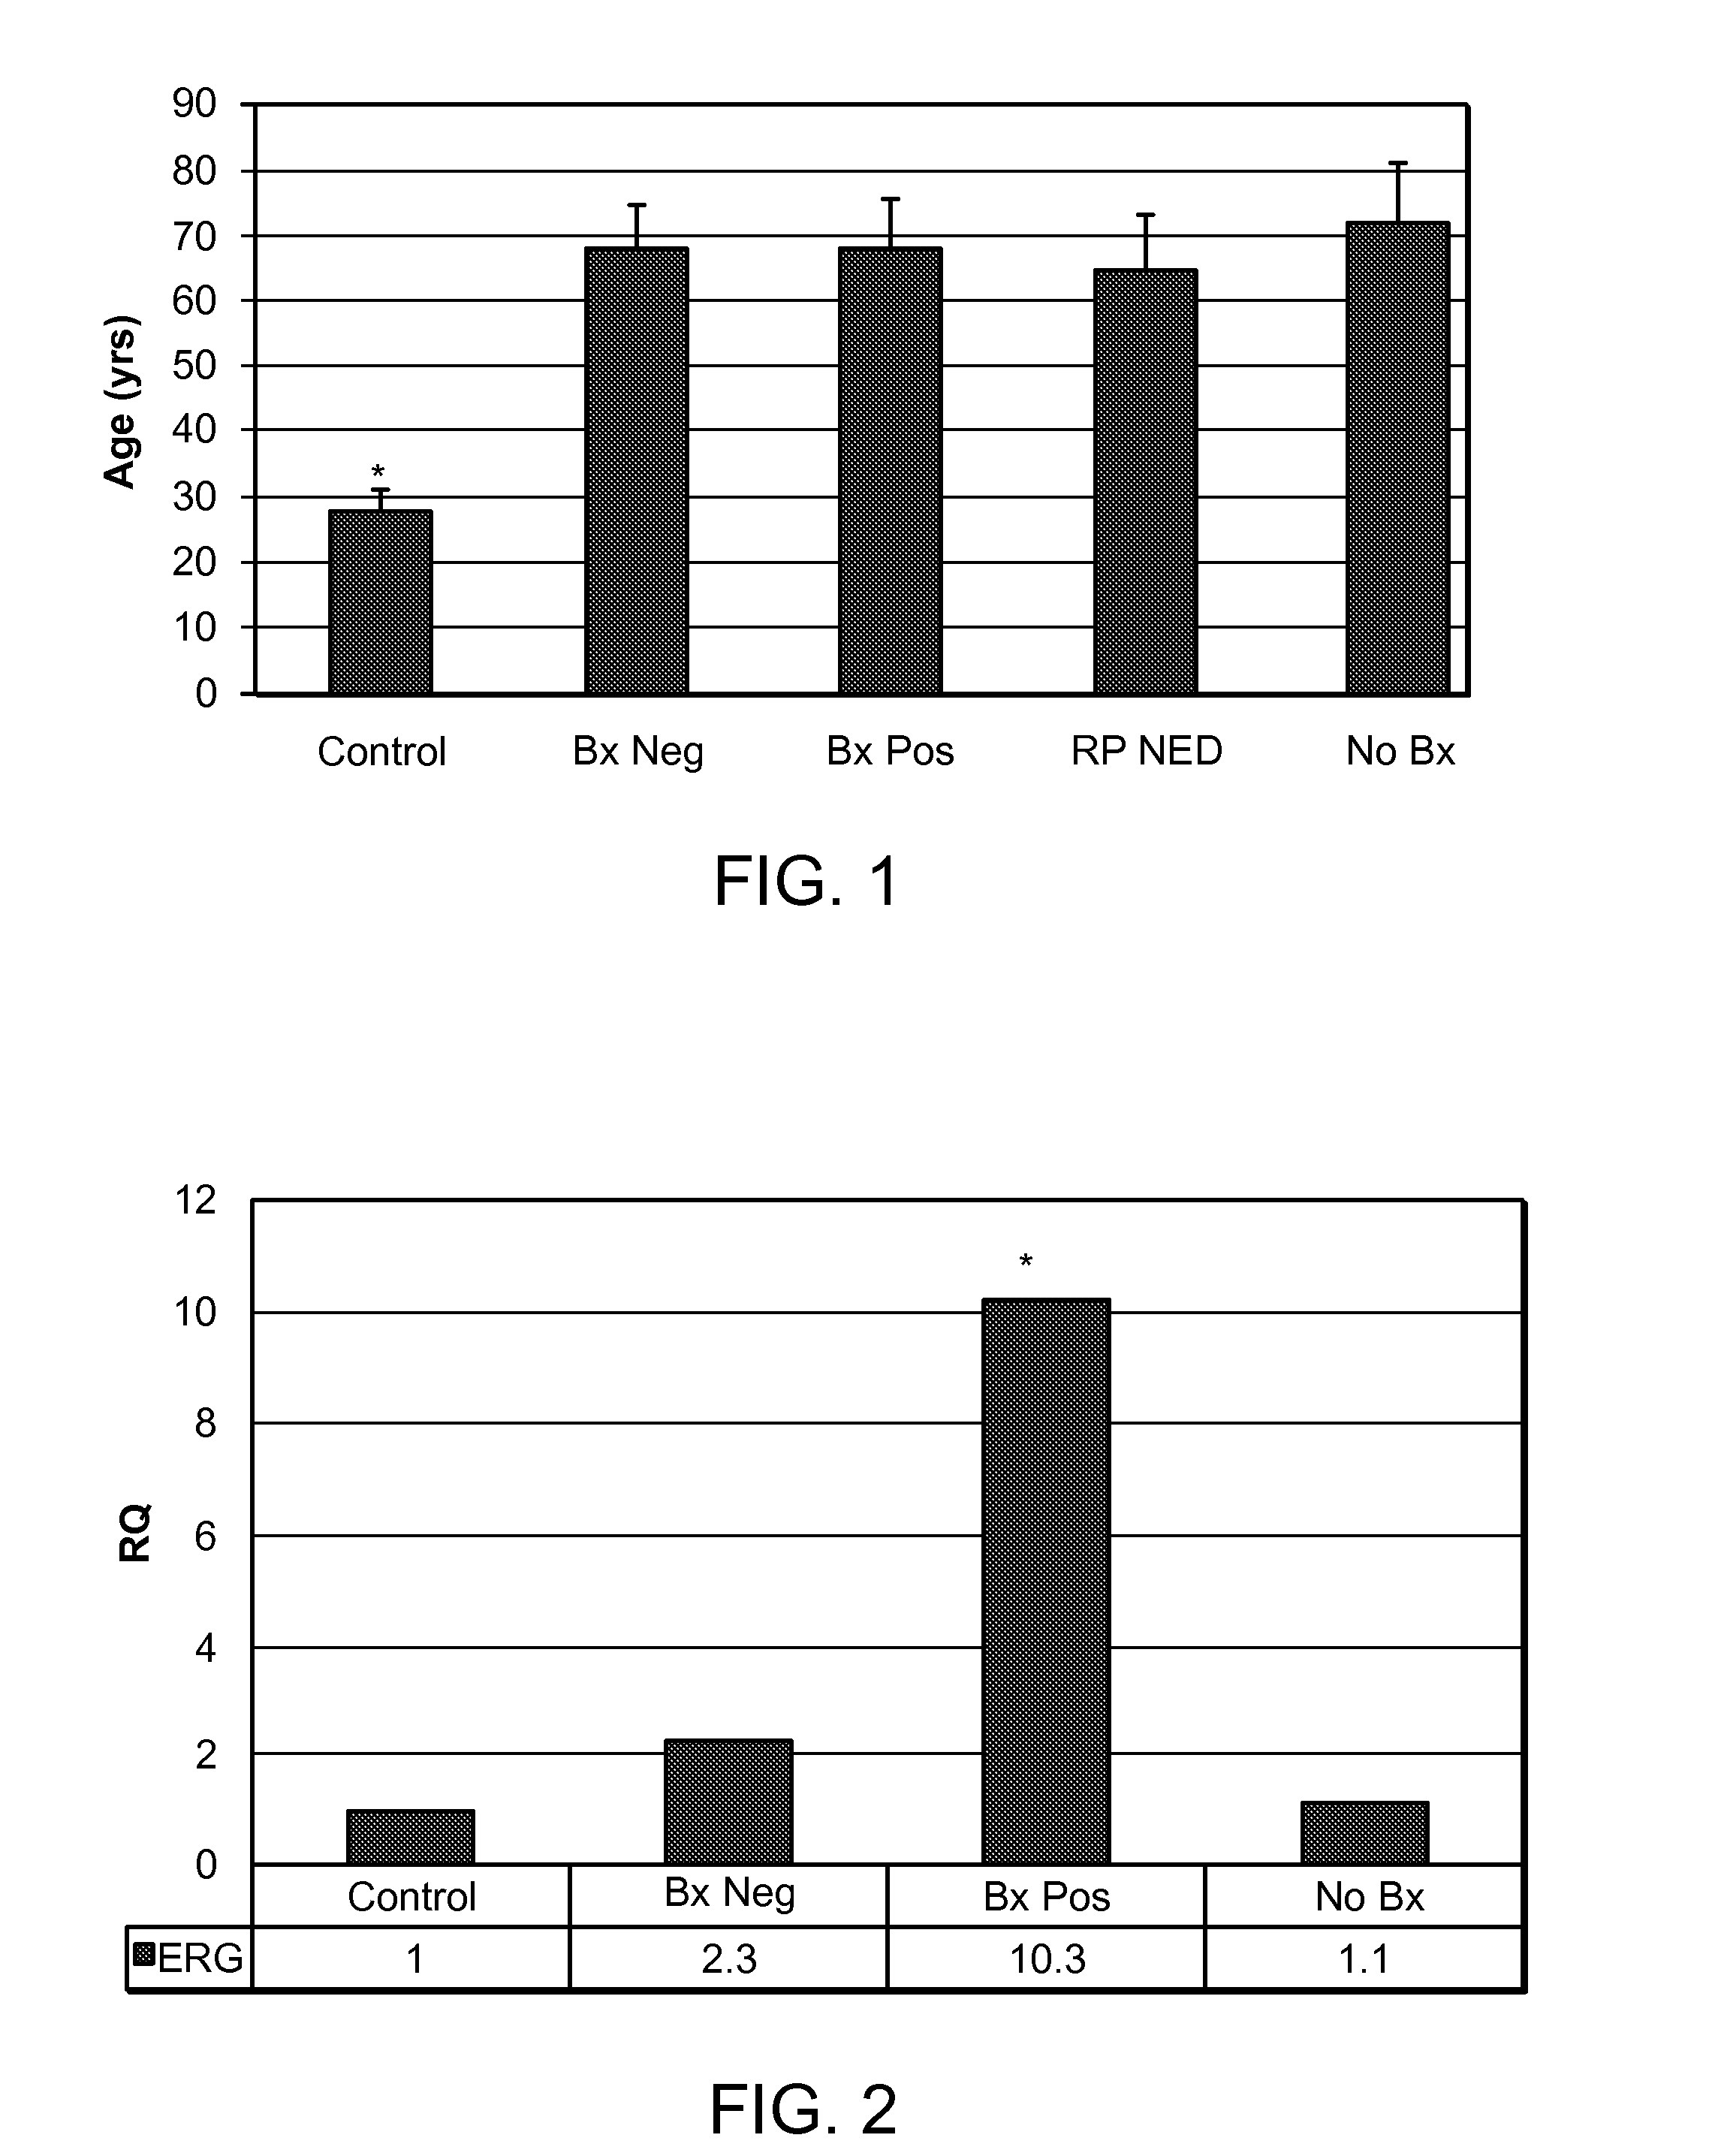
[0126]20 ml spot urine samples were obtained from five groups of individuals. These urine samples were voided urine samples that were obtained without a digital rectal exam (DRE) or a prostatic massage prior to urine collection. The five groups and the number of individuals in each group are: the control group (Control, males under 35 years old) with 40 individuals; the group characterized by a biopsy positive for prostate cancer (Bx Pos) with 38 individuals, the group characterized by a biopsy negative group (Bx Neg) with 39 individuals, the group characterized by radical prostatectomy no evidence of disease group (RP NED) with 35 individuals, and the group characterized by pat...
example 2
Comparison of the Relative Expression Level of ERG and Various Reference Nucleic Acids
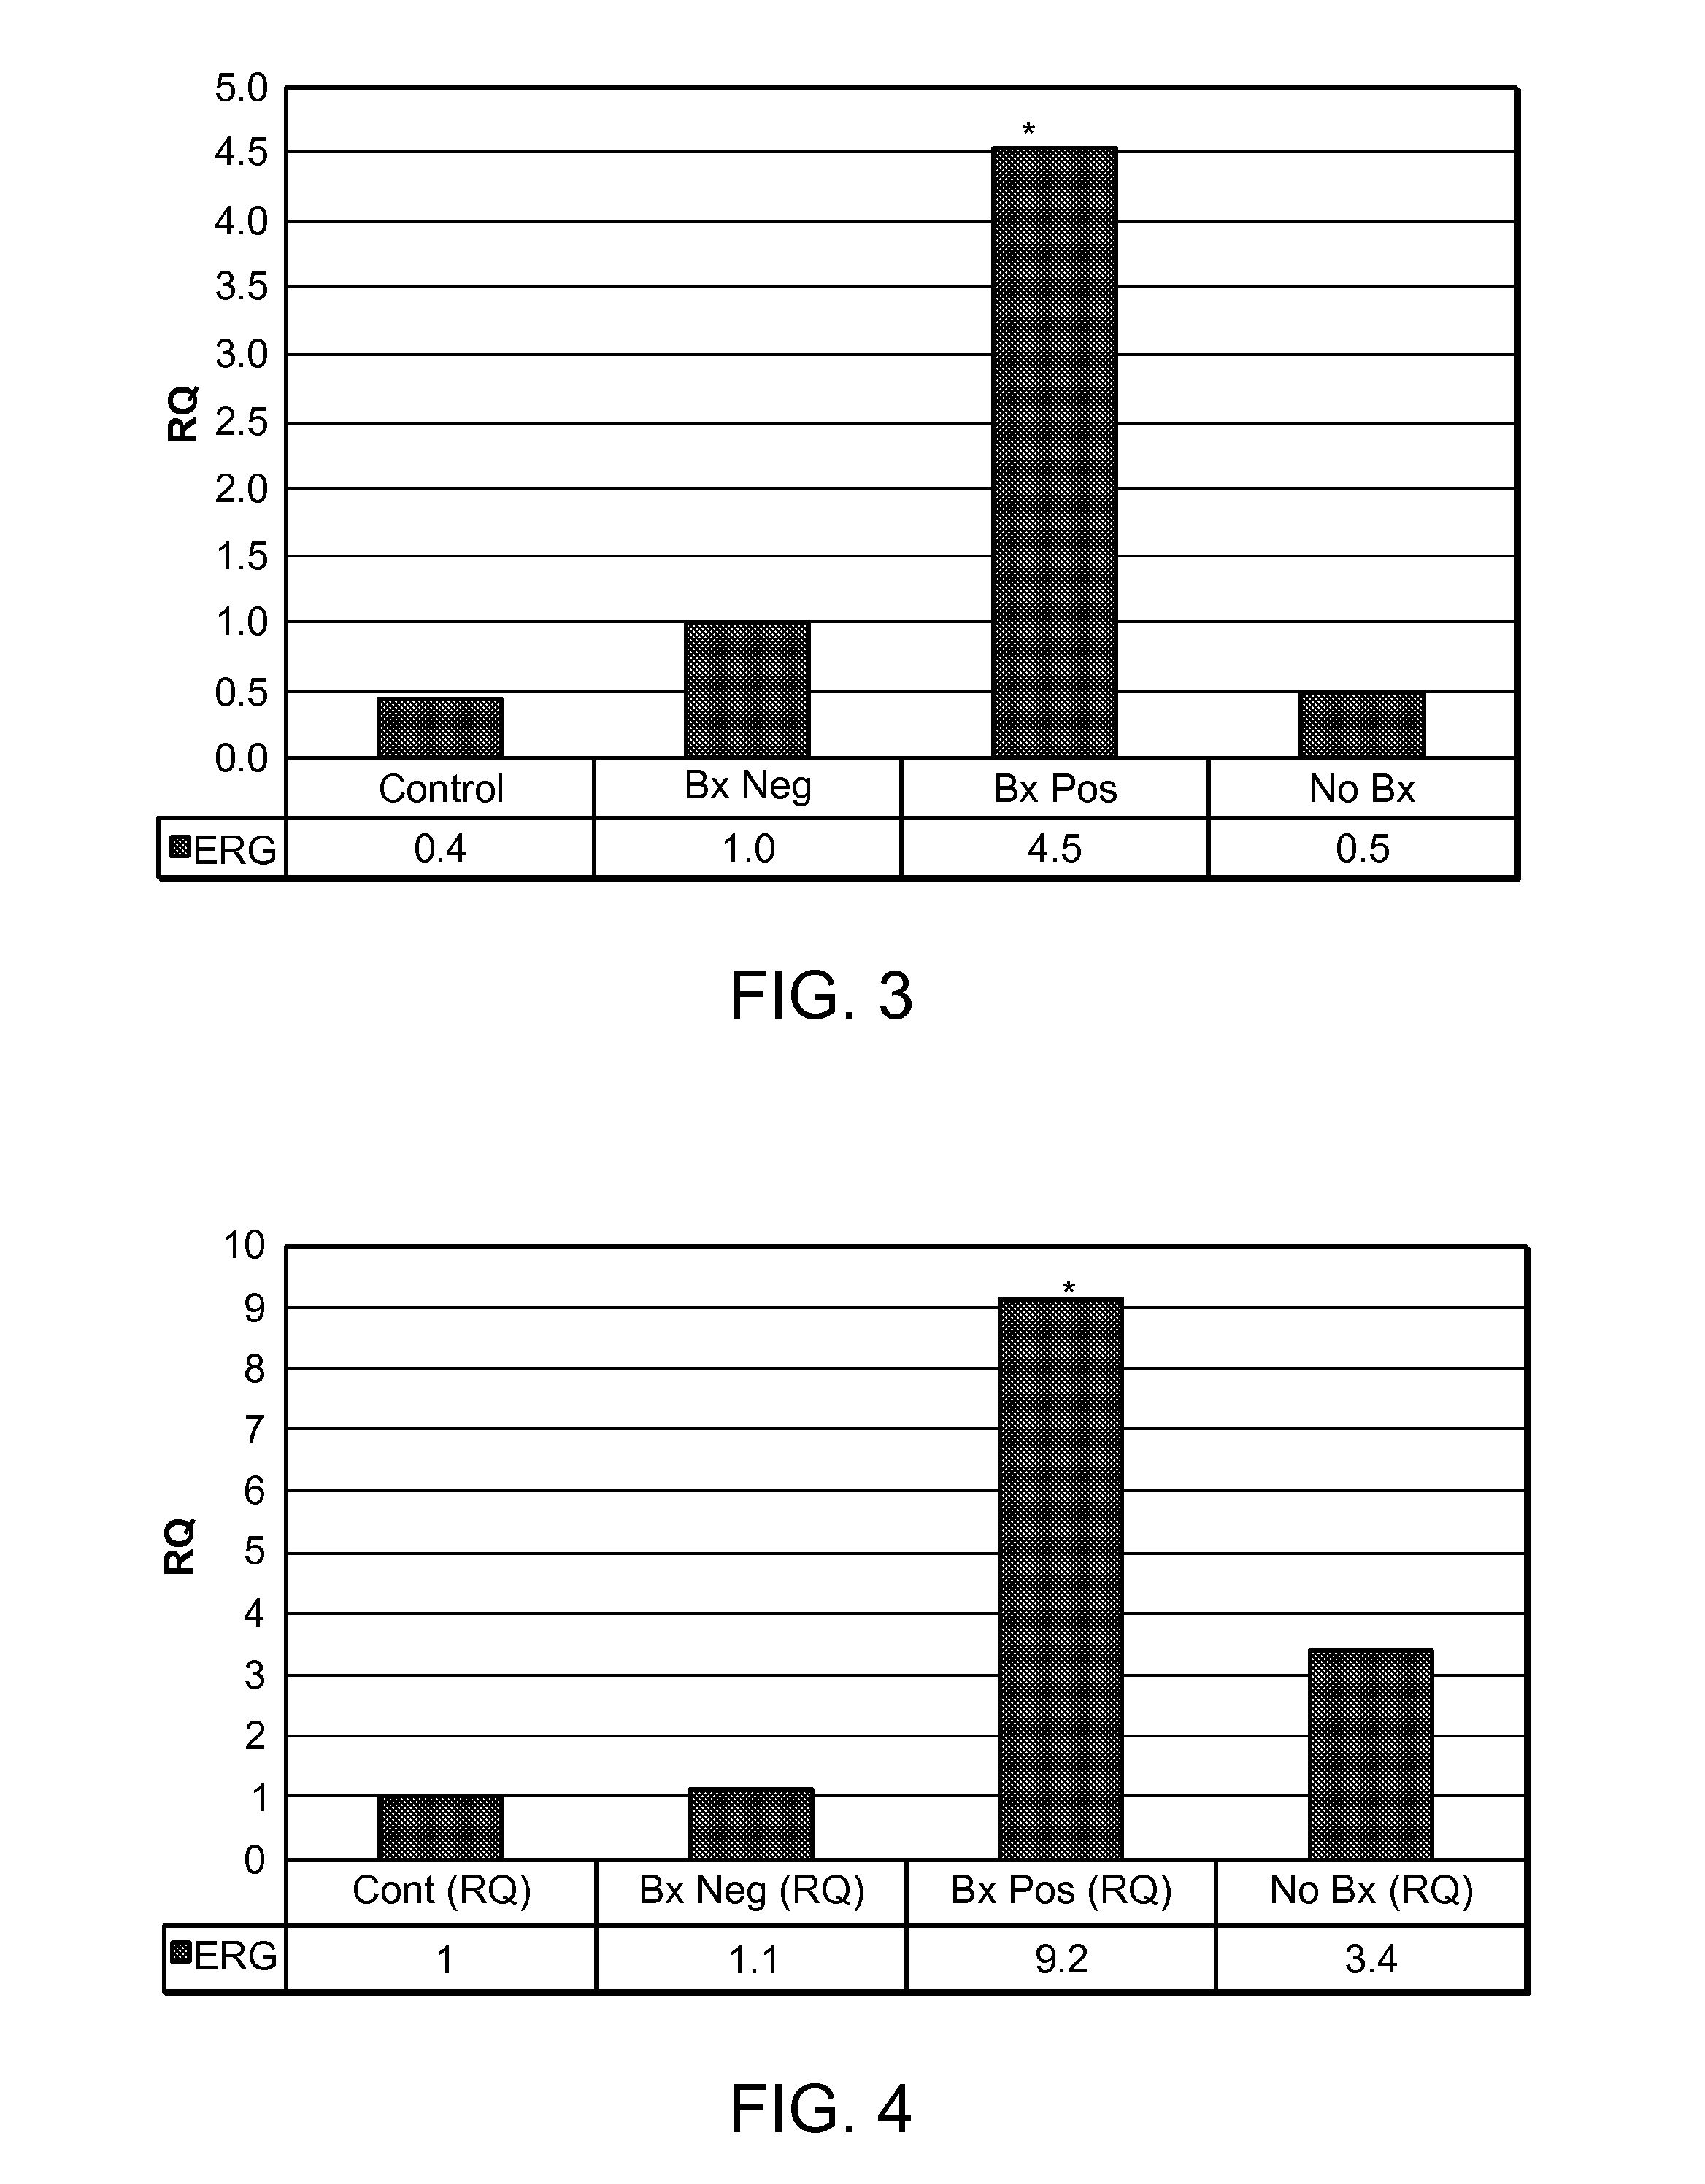
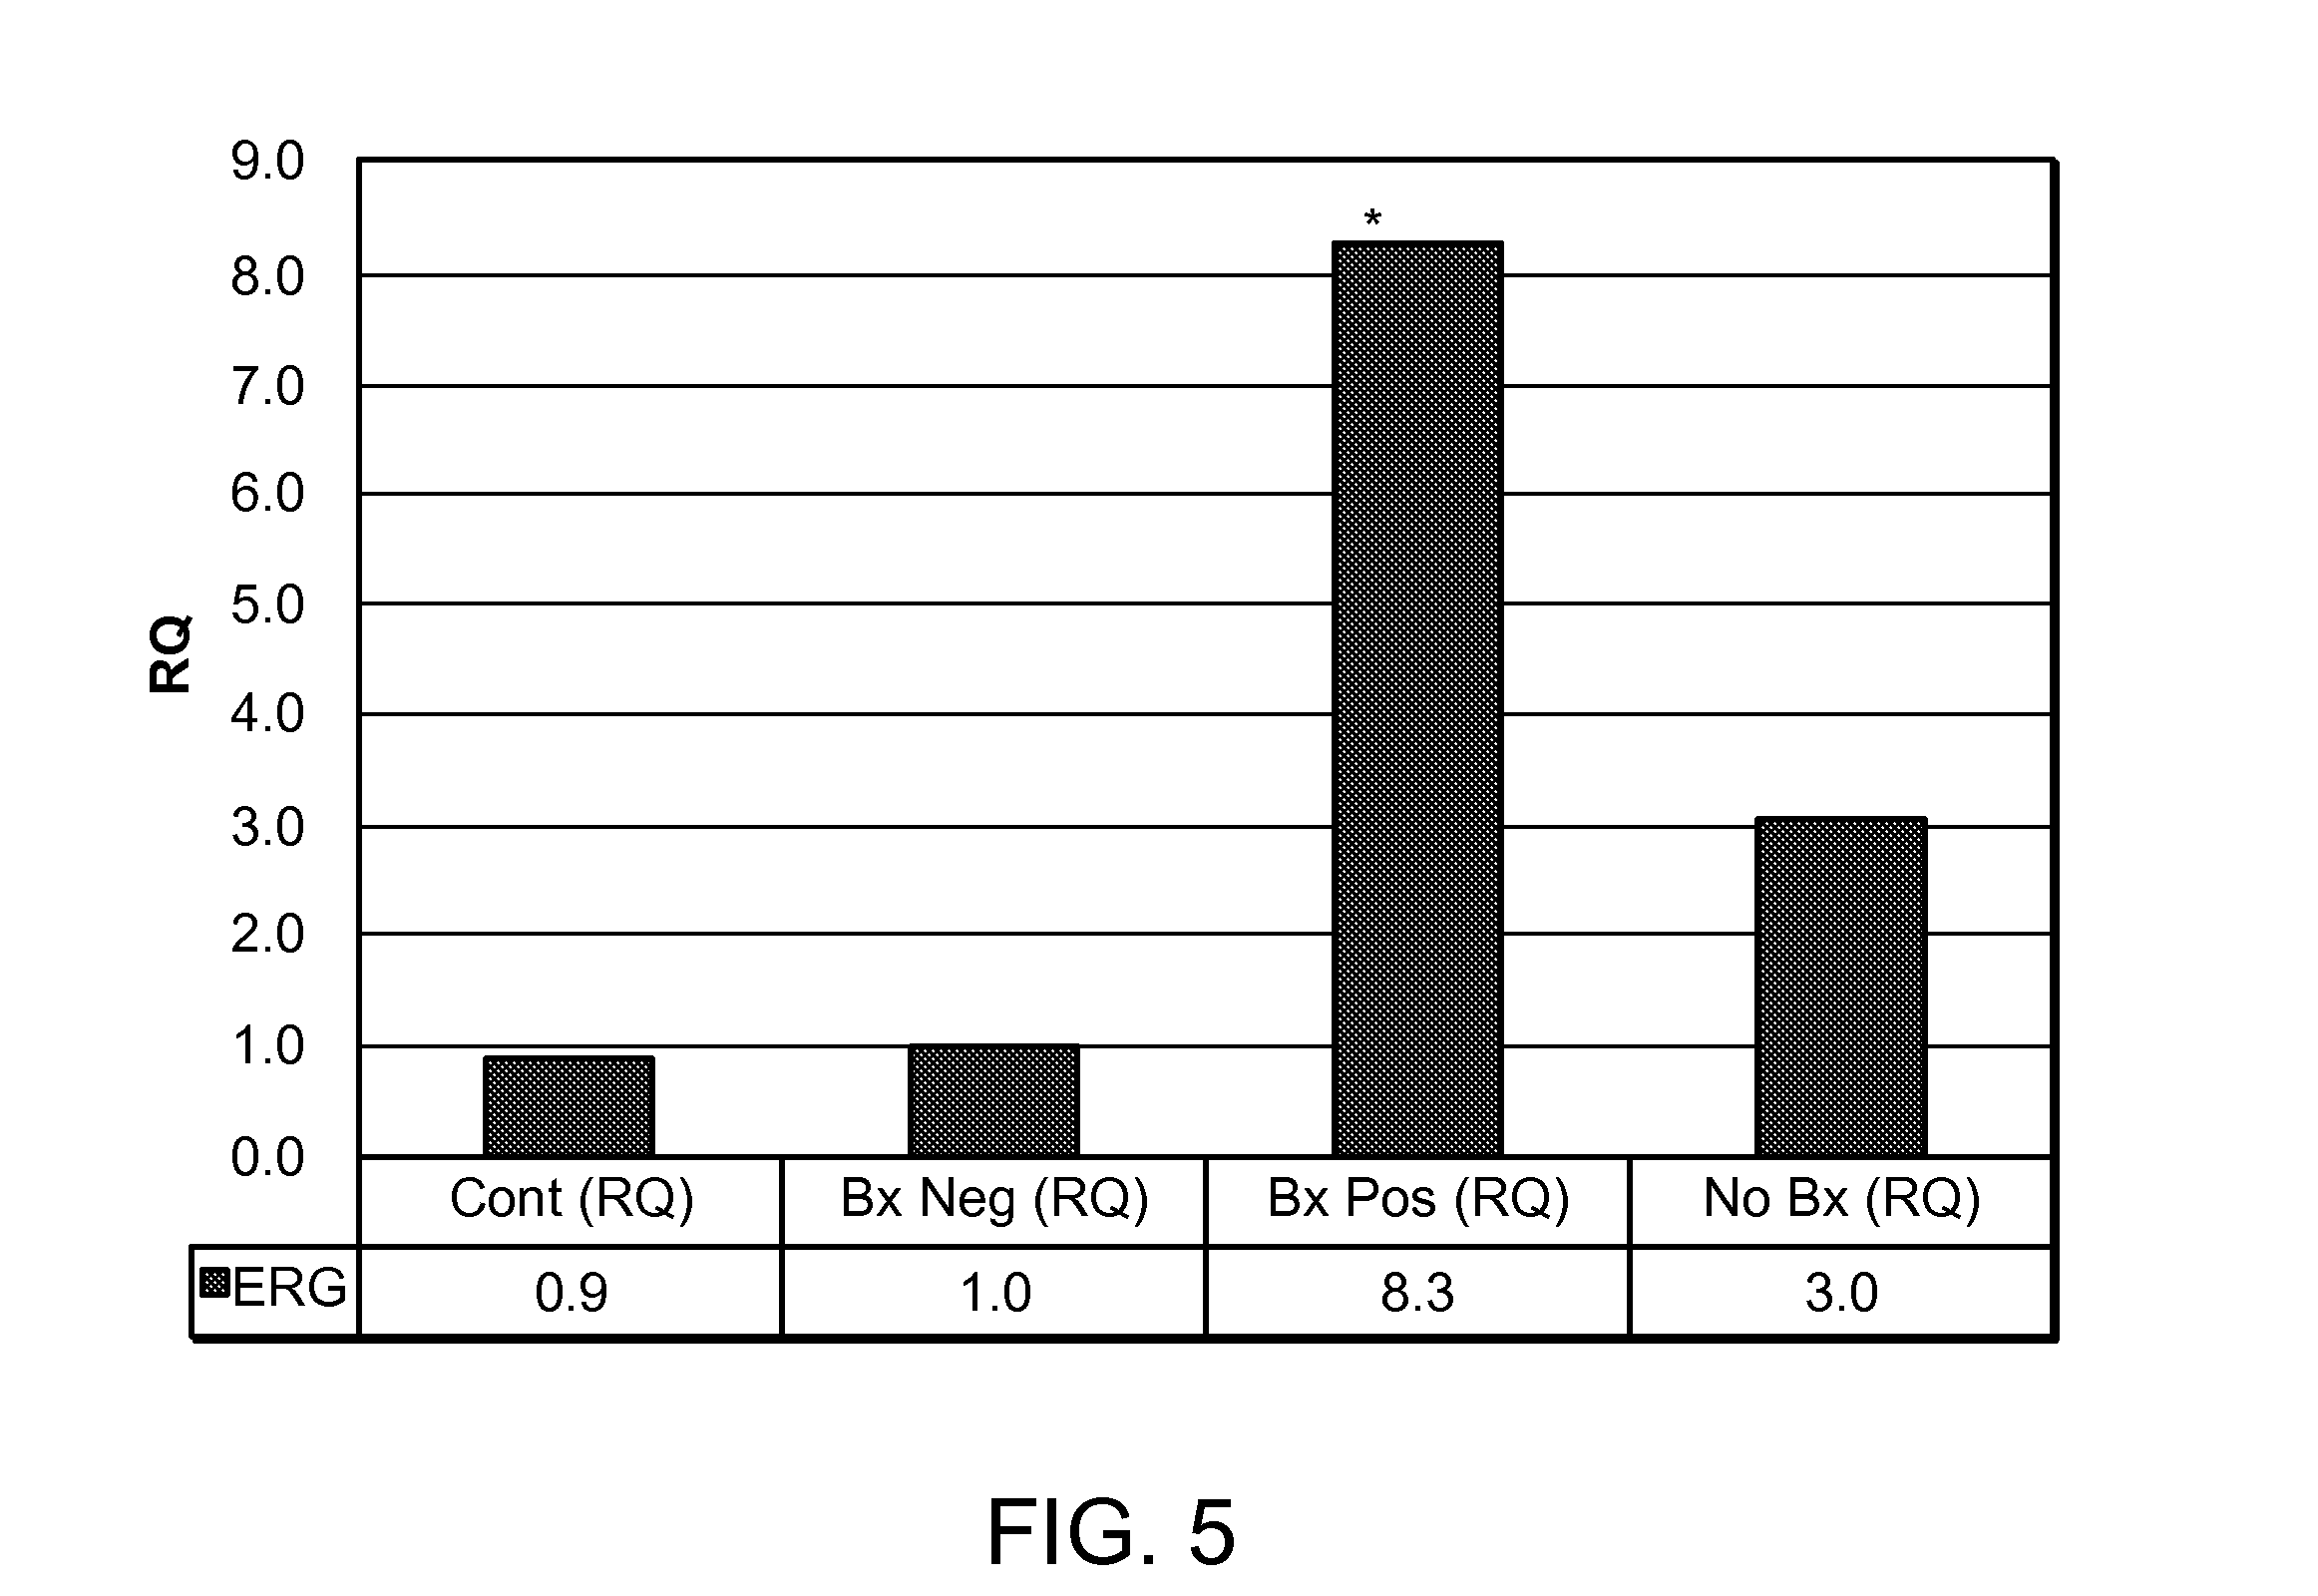
[0133]Different combinations of the reference genes (GAPDH and PSA) and the calibrator group (Control and Bx Neg) were used for the RQ analysis of human ERG gene expression.
[0134]In the first combination, GAPDH was used as the reference gene, and the Control groups were used as the calibrator group. As shown in FIG. 2, the expression levels of ERG in urine microvesicles from the Bx Pos, Bx Neg, and No Bx group were about 10.3, 2.3, and 1.1 times the expression levels of ERG in the Control group, respectively. The P values of the Bx Pos group versus the Control, Bx Neg, and No Bx groups were 0.0017, 0.0093, and 0.002, respectively. The difference of ERG expression levels between Bx Pos and Control, Bx Pos and Bx Neg, and Bx Pos and No Bx, were statistically significant because all numbers (0.0017, 0.0093, and 0.002, respectively) were smaller than 0.01.
[0135]In the second combination, GAPDH was used...
example 3
Comparison of the Relative Expression Levels of Various Biomarkers and Reference Nucleic Acids
[0139]Based on the RT PCR results, RQ analysis was further performed on all the ten genes: androgen receptor (AR), BIRC5 (survivin), ERG, GAPDH, KLK3 (PSA), NCOA2, PCA3, RAD21, TMPRSS2:ERG, and TMPRSS2.
[0140]In one occasion, GAPDH was used as the reference gene and Bx Pos was used as the calibrator group. As shown in FIG. 13, the expression of the ten genes varied in Bx Pos and Bx Neg groups. The RQ value for each gene in the five groups was calculated, and P value for between Bx Pos and each of the other four groups was also obtained. As shown in Table 2, the average RQ value varied and the P value also varied for different genes in different groups. For example, between Bx Pos and Bx Neg groups, the expression level difference for the ten genes was not statistically significant except for ERG (P=0.0093).
TABLE 2Differential expression of genes in the five patient groups (GAPDH as the refer...
PUM
| Property | Measurement | Unit |
|---|---|---|
| Atomic weight | aaaaa | aaaaa |
| Concentration | aaaaa | aaaaa |
| Molecular weight | aaaaa | aaaaa |
Abstract
Description
Claims
Application Information