
Methods to determine candidate biomarker panels for a phenotypic condition of interest

a phenotypic condition and biomarker technology, applied in the field of compounds, can solve the problems of further complicated phenomena, difficult to identify single biomarkers or panels of biomarkers specific to a disorder of interest, and disappointment in the development and identification of biomarkers for clinical use, and achieve the effect of reducing the exposure of a subj

Inactive Publication Date: 2015-04-30
MEDEOLINX
View PDF0 Cites 22 Cited by
  • Summary
  • Abstract
  • Description
  • Claims
  • Application Information

AI Technical Summary

Benefits of technology

This patent provides methods for diagnosing lymphoma and leukemia using a combination of biomarkers, including TNFRSF8, FSCN1, BCL6, and PIM1. By measuring the expression levels of these biomarkers, a person can be accurately diagnosed as either at risk for lymphoma or leukemia, allowing for more targeted treatment options and reducing side effects.

Problems solved by technology

Despite the surge in molecular knowledge and the completion of the human genome project, development and identification of biomarkers for clinical use has been a disappointment.
This phenomenon may be further complicated by uncertain environmental risks, genetic risks, diet, and lifestyle choices of individuals.
Thus identifying single biomarkers or panels of biomarkers specific to a disorder of interest has been considered difficult to achieve.
However, several problems have long hampered graph and network visualization.
First, the viewing platform and performance pose constraints on the scale of the graphs.
Second, visual usability and clarity become unacceptable as the density of the graph grows significantly, even though a system can layout and display this large graph.
Nodes and edges occlude each other and are often indiscernible, owing to congestion of color, metaphors, and labels.
Inappropriate modeling does not only aggravate the congestions in large scale networks, but is also likely to miss the knowledge inherently due to the correlations among different categories.
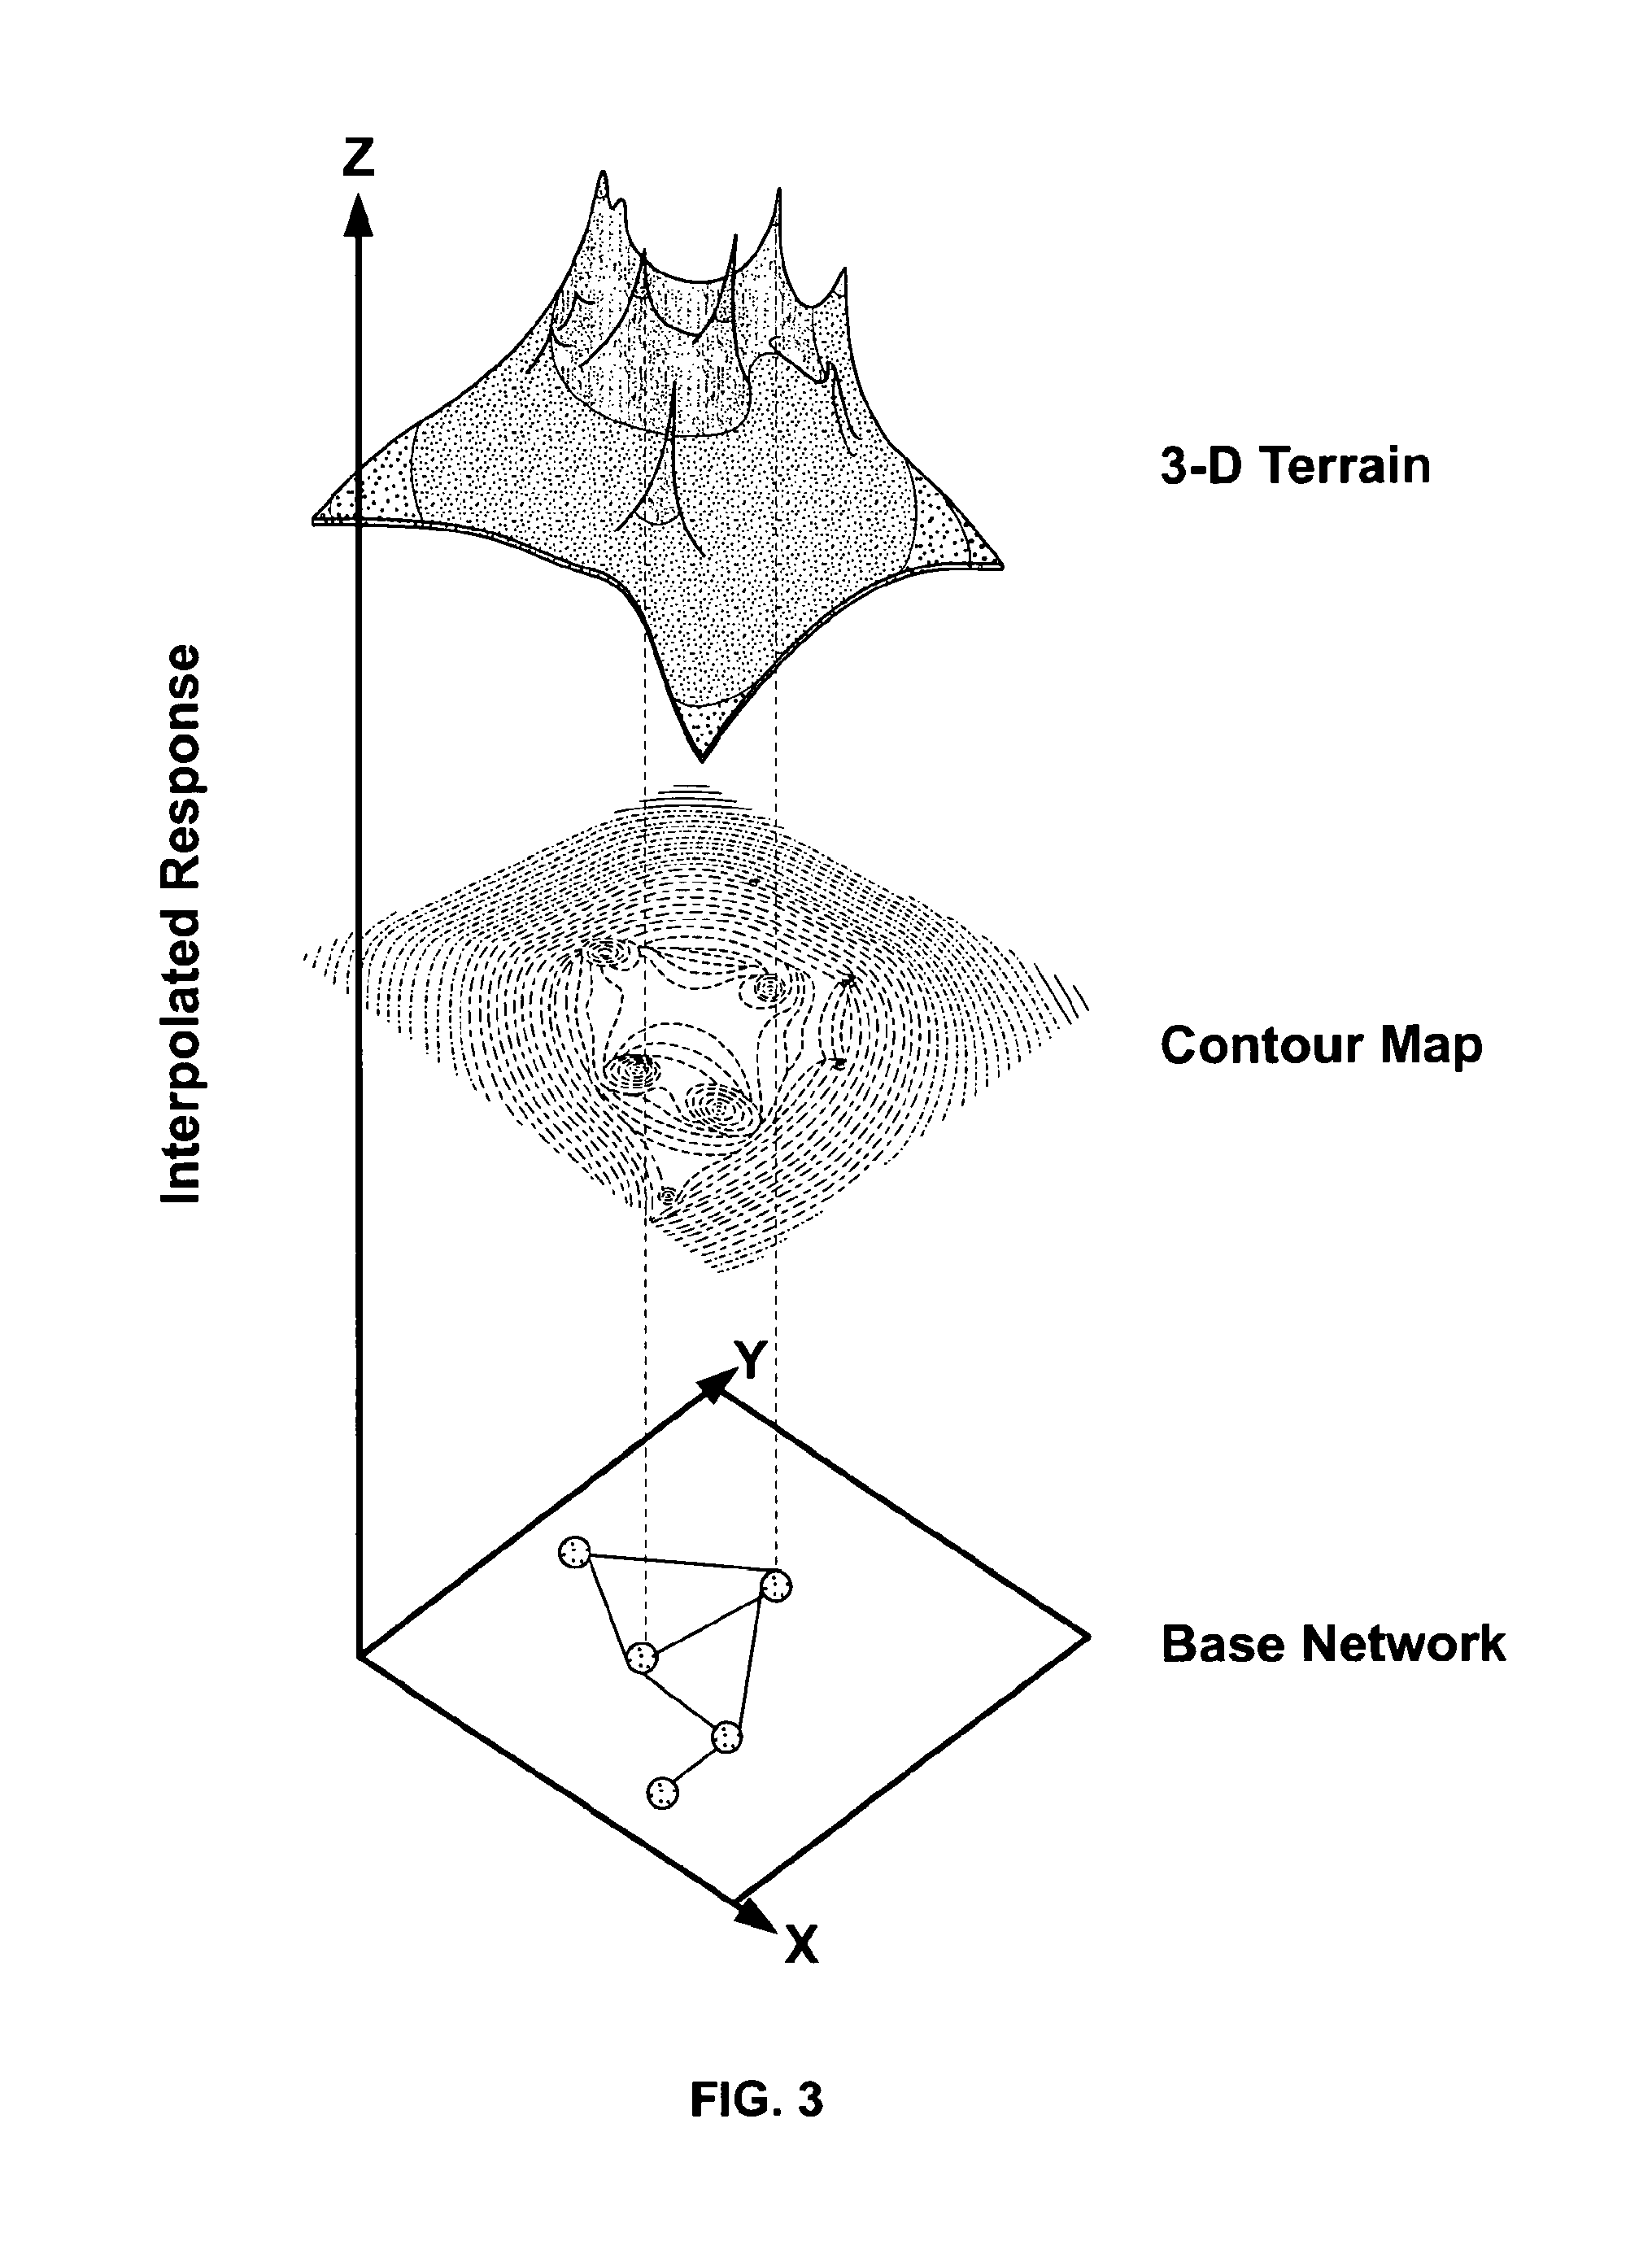
While using the graph metaphor for visualizing biomolecular networks is appropriate for understanding the basic topological structure of biomolecular networks, or in some cases, high-level protein categorical interconnections in a network, the metaphor is inadequate in addressing biological determinations in which correlated functional changes of genes, proteins, and metabolites have to be investigated in the same network context.
Conventional graph-based network visualization methods are often Insufficient in addressing these post-genome biological knowledge discovery determinations.

Method used


Image

  • Methods to determine candidate biomarker panels for a phenotypic condition of interest
  • Methods to determine candidate biomarker panels for a phenotypic condition of interest
  • Methods to determine candidate biomarker panels for a phenotypic condition of interest

Examples


example 1

Biomarker Panel Development

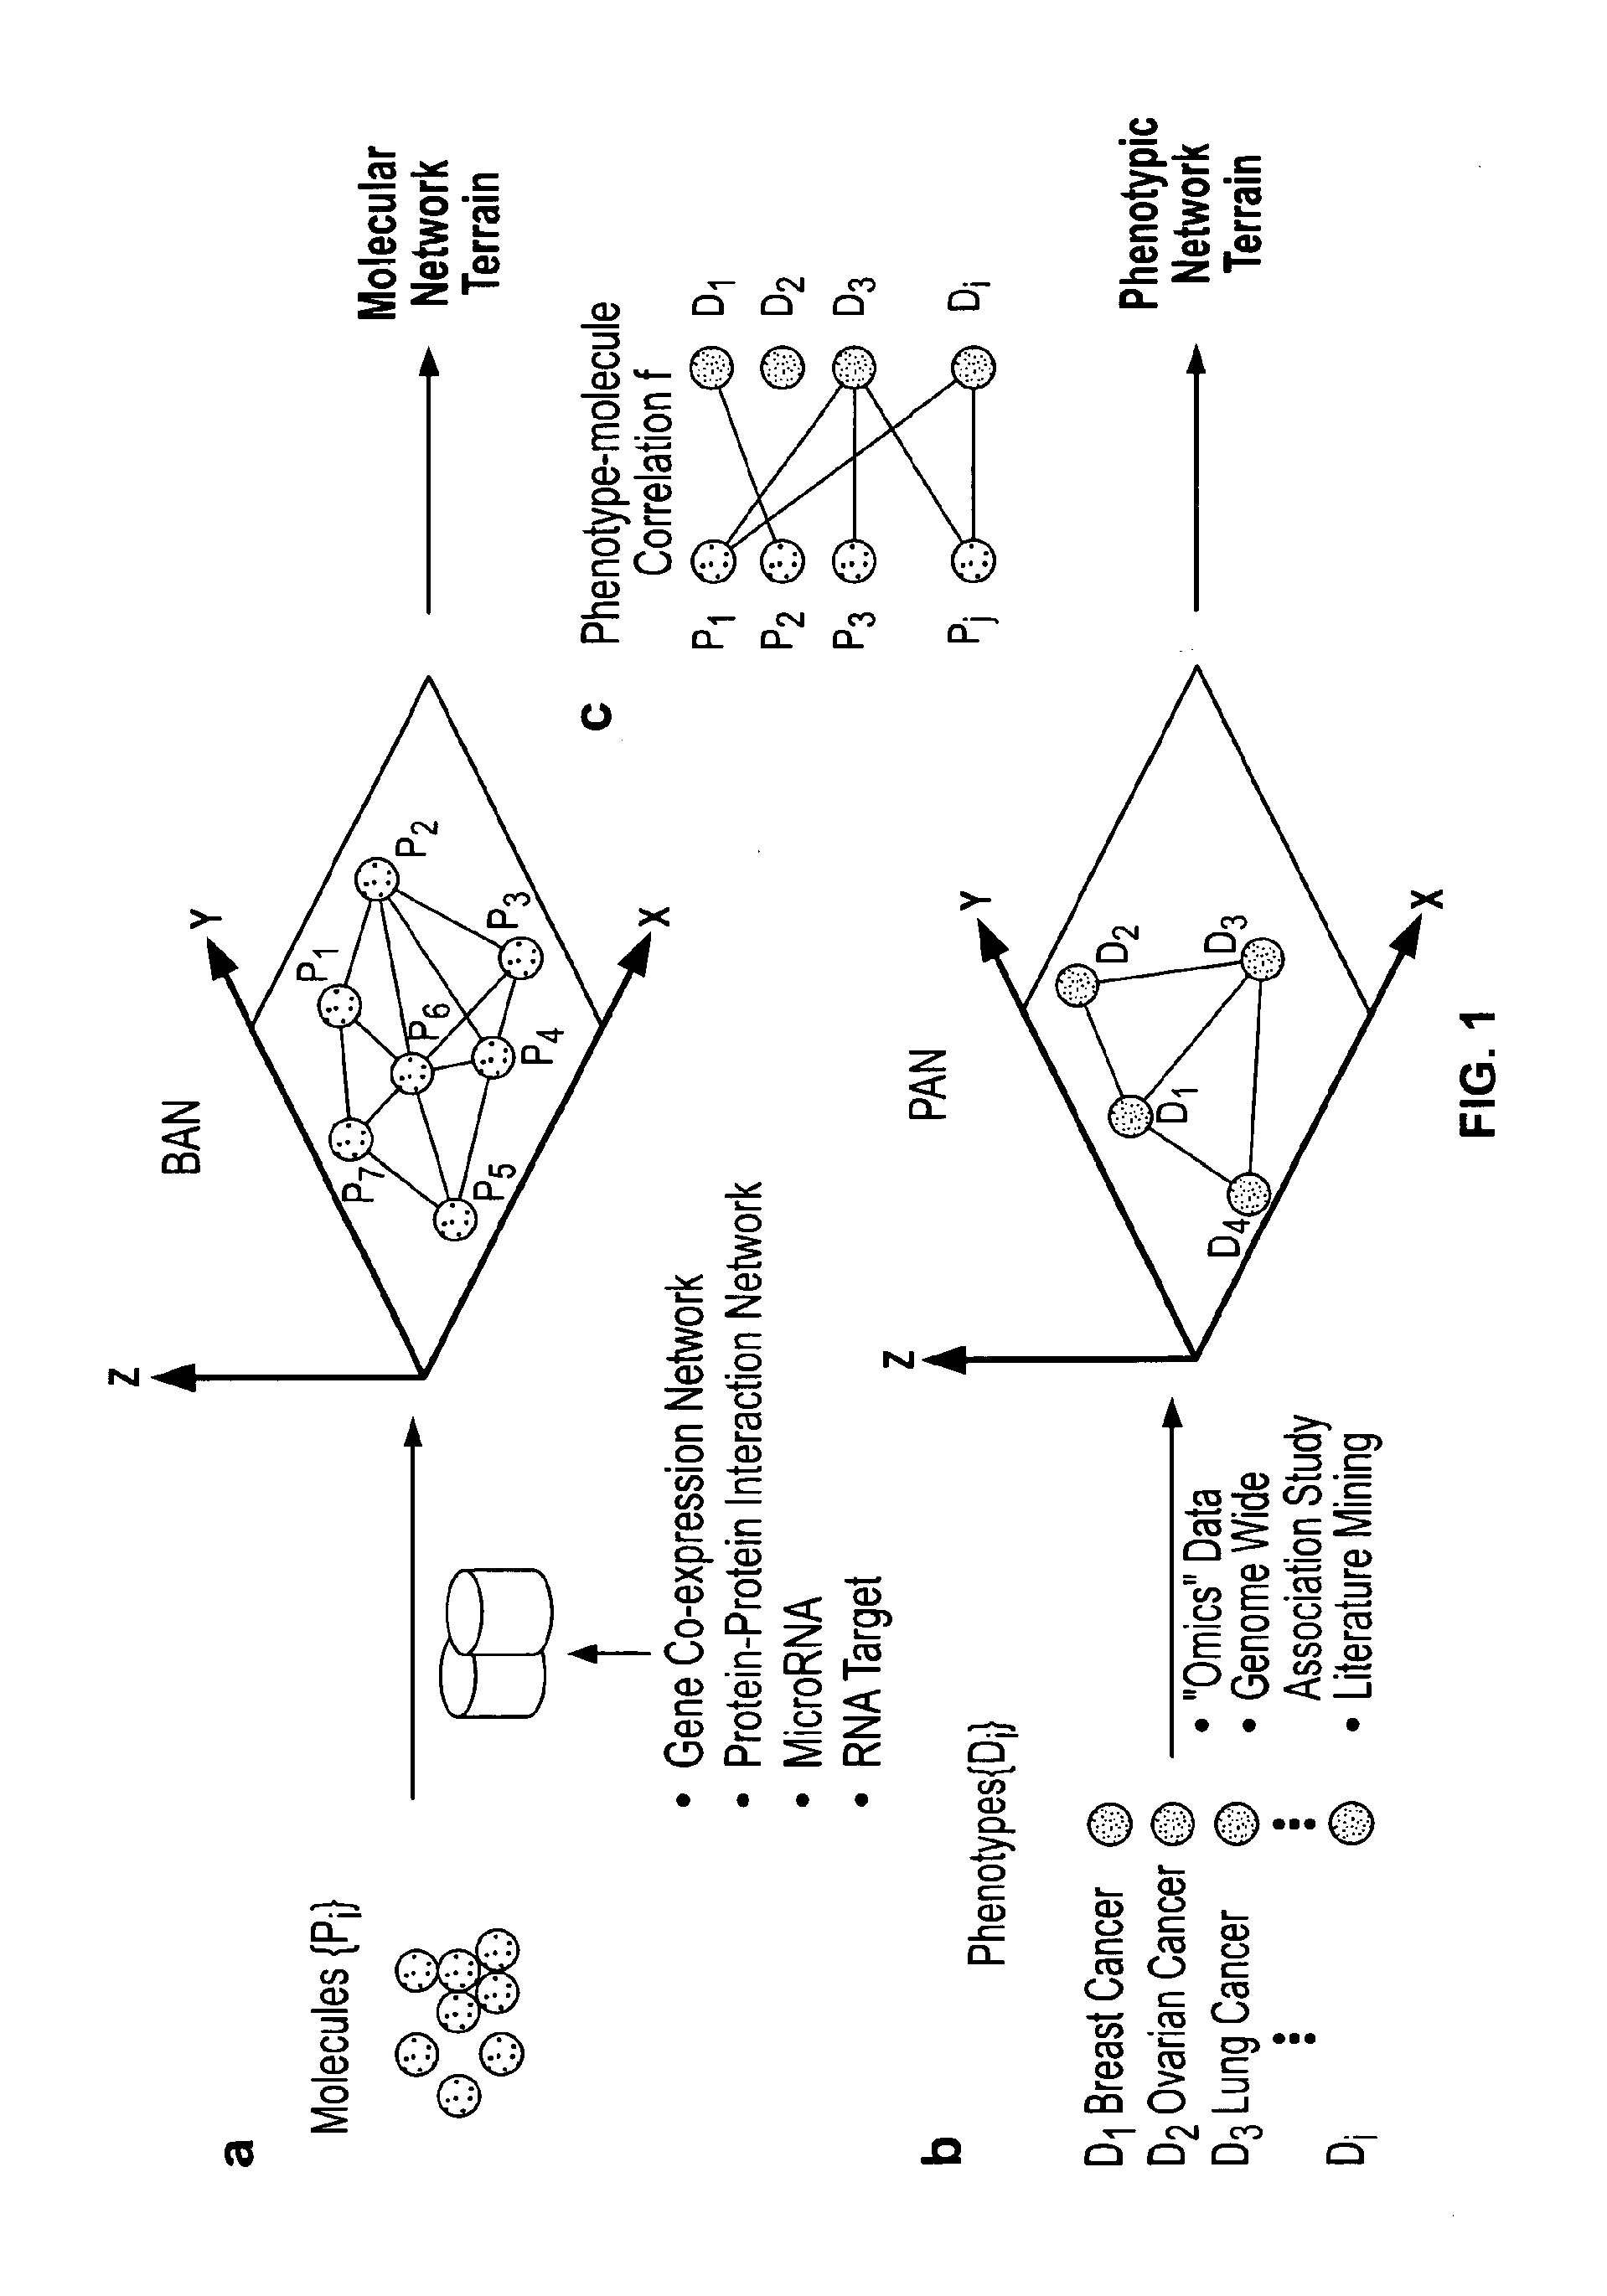
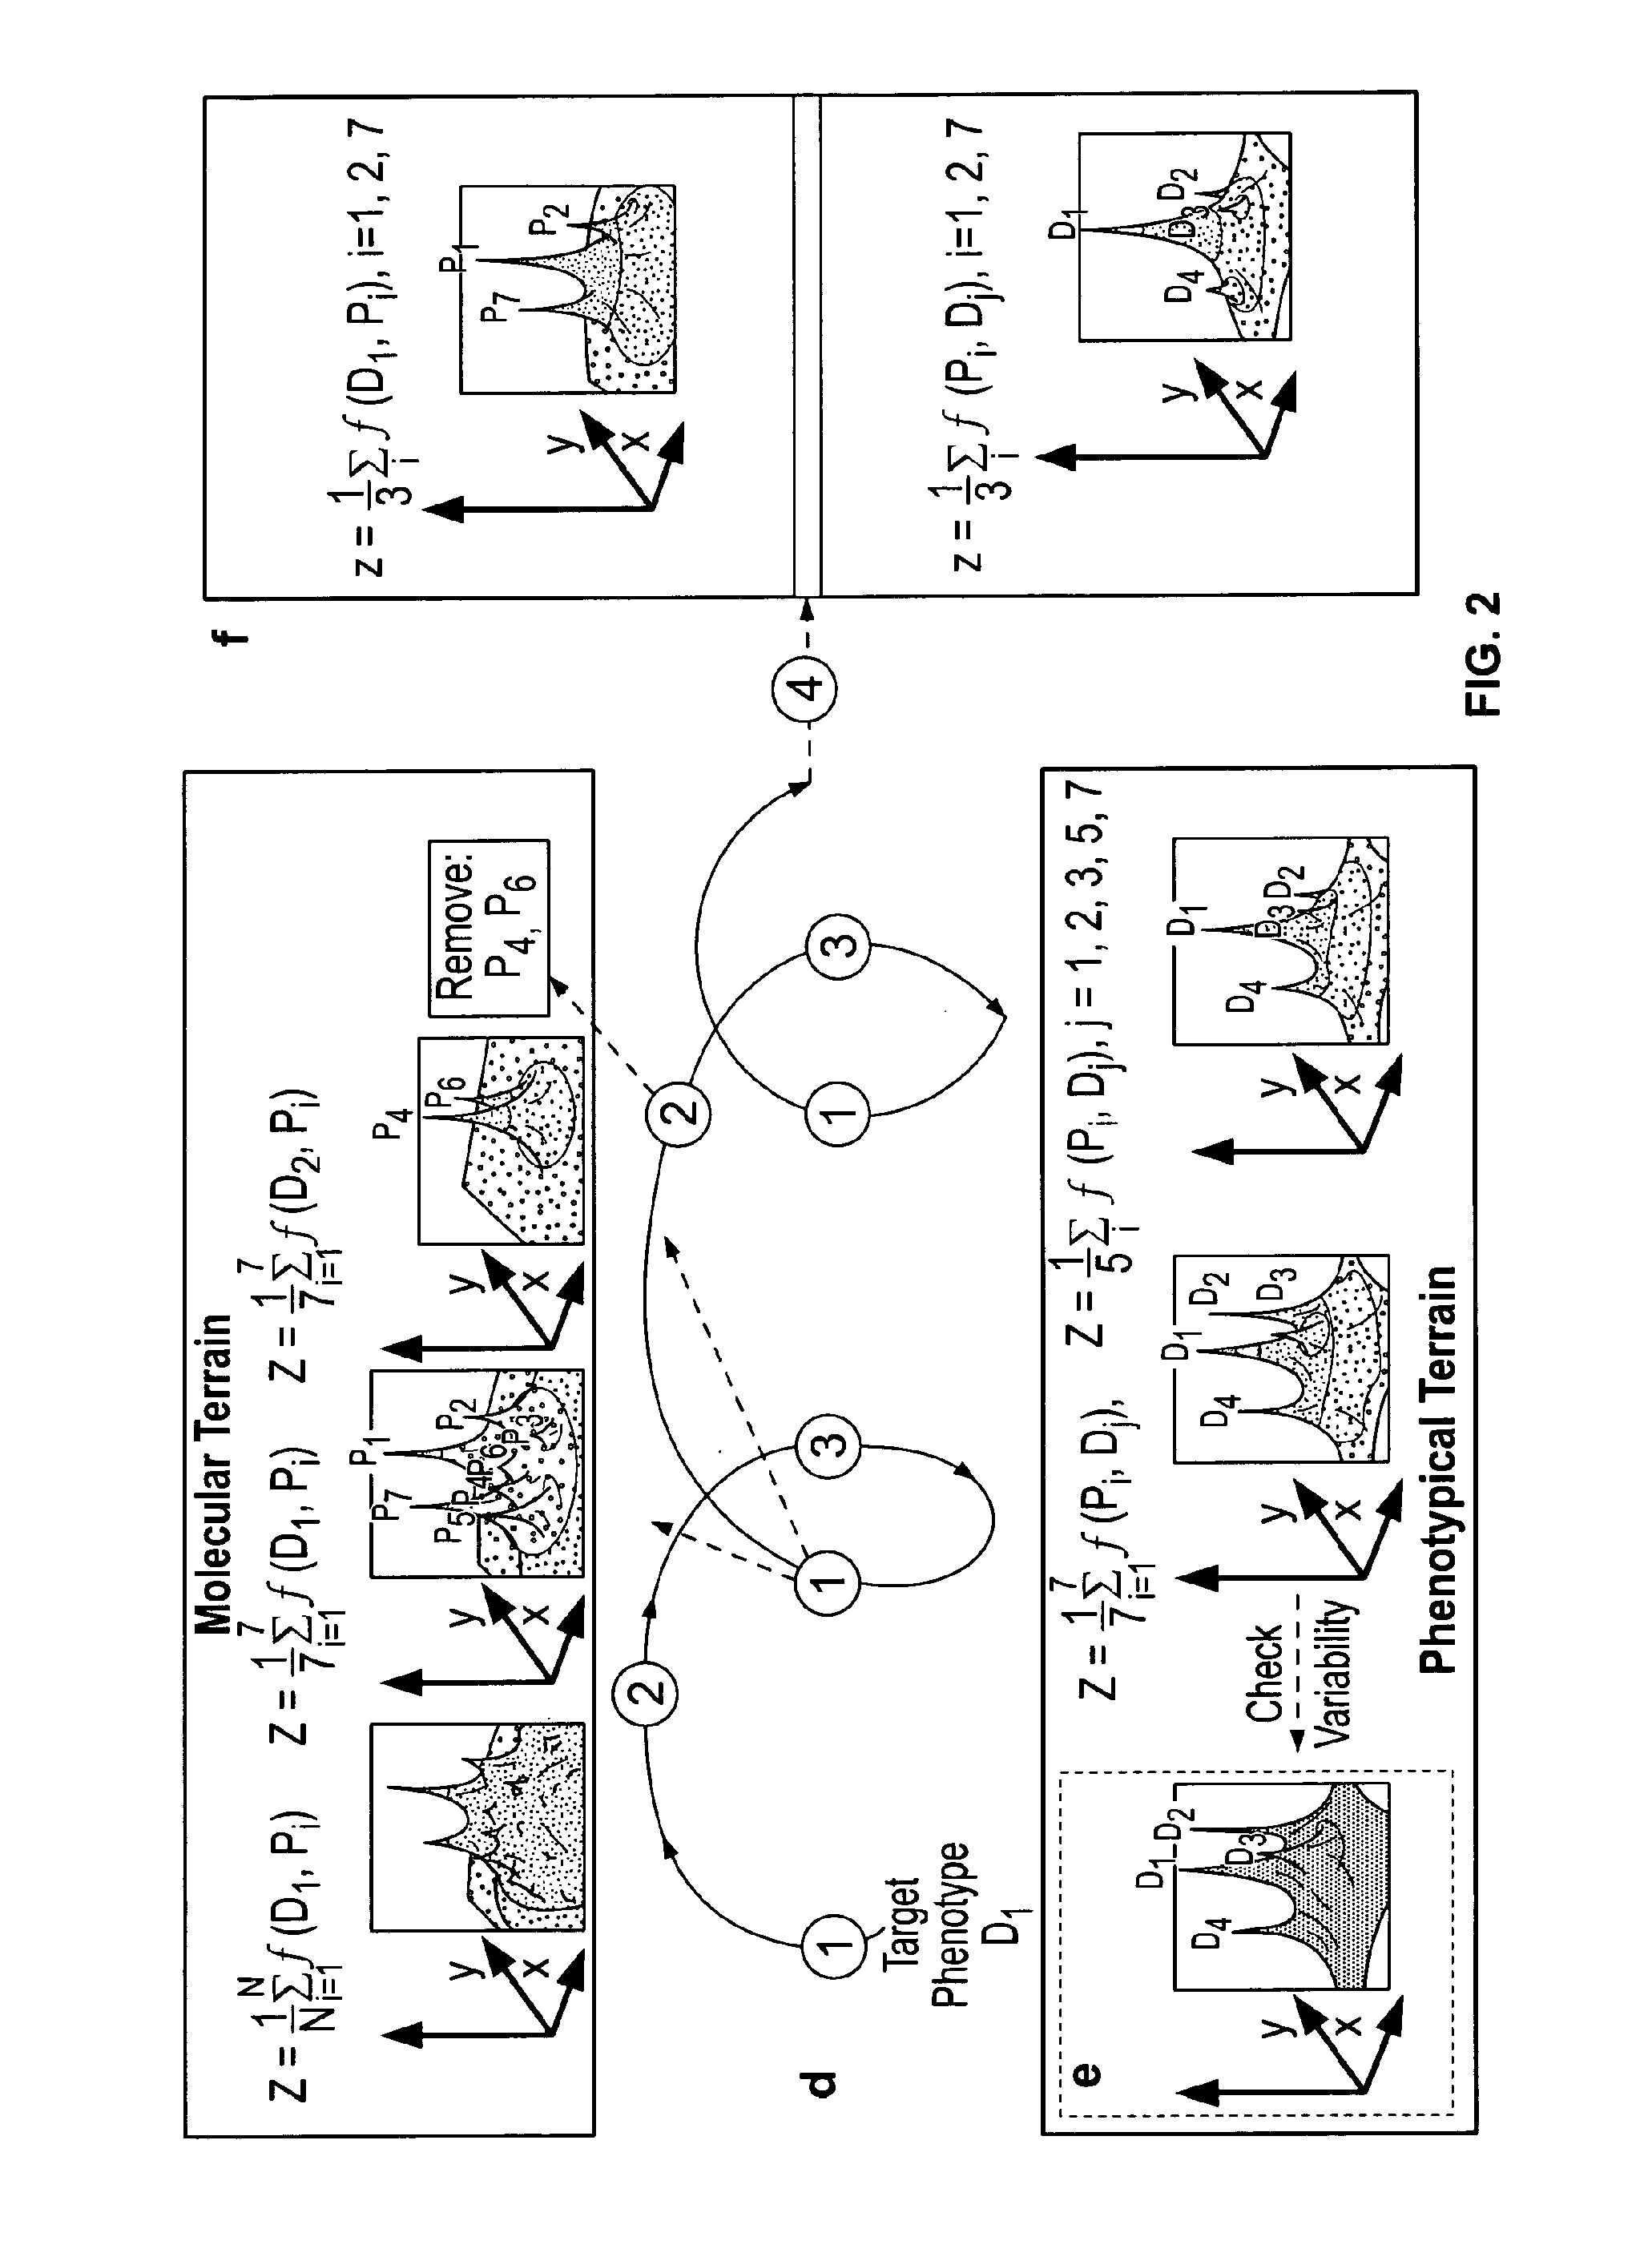
[0177]The lack of specific single biomarker for many disease biomarker applications is a challenge for biomarker development today. An approach shown in FIG. 18 was used to iteratively design a biomarker panel. The approach includes four steps: a construction step where a protein terrain is built with a disease of Interest as the response factor, a filtering step where clusters of proteins within major peaks and other regions of interest are identified on the protein terrain; an evaluation step where a disease terrain is built with clusters of proteins enriched for the disease of interest to evaluate their disease specificity; and a rendering step where a consensus disease terrain is built with optimized composite proteins (panel biomarkers) as response factors showing a high degree of specificity. This can be an iterative process where other regions on the protein terrain can be selected and filtered genes can be removed.

[0178]Lymphoma was used as a case ...

example 2

Validation of a Lymphoma Related Biomarker Panel

[0184]A four member lymphoma related biomarker panel comprising TNFRSF8, FSCN1, BCL6 and PIM1 and candidate biomarkers were assessed for sensitivity and specificity in a prospective manner. The performance of a newly found biomarker panel can be validated by measuring their disease sensitivity and disease specificity. For this exemplary experiment, the disease sensitivity is defined by the results of bi-classification on microarray expression samples, where the case is lymphoma samples and the control is normal samples. For this exemplary experiment, the disease specificity is defined by the results of bi-classification on microarray expression samples where the case is leukemia samples and the control is lymphoma samples.

[0185]Microarray results derived from 25 normal blood samples, 29 lymphoblastoid lymphoma cell line tissue samples and 34 B-cell chronic lymphocytic leukemia cell lines were obtained from a functional genomics study b...

example 3

Normalization and Pre-Processing of Microarray Expression Data

[0189]Microarray results derived from 25 normal blood samples, 29 lymphoblastoid lymphoma cell line tissue samples and 34 B-cell chronic lymphocytic leukemia cell lines were obtained from a functional genomics study by the National Center for Biotechnology Information (NCBI). All of the eighty-eight samples were aligned. The microarray results from each sample each had 12533 probes. The data were normalized by the expression level of identified “house keeping” probes. Two steps were used in performing “house keeping” probe normalization.

[0190]The first step of “house keeping” probe normalization was a quantile normalization check. The data set was checked to see if it needed any routine normalization, e.g. quantile normalization. For each of the 88 samples, the top 5% percentile and bottom 5% percentile expressed probes were excluded, and the mean and standard deviation of the expression for the remaining probes were calc...


PUM

PropertyMeasurementUnit
heightaaaaaaaaaa
strengthaaaaaaaaaa
inherent structuresaaaaaaaaaa

Abstract

A panel of lymphoma related biomarkers are provided. The panel allows the identification of a subject at risk for a lymphoma. Further provided are methods of optimizing therapeutic efficacy associated with treatment of a lymphoma related disorder. Methods of identifying biomarkers affiliated with a condition of interest are provided.

Description

PRIORITY AND CROSS-REFERENCE TO RELATED APPLICATIONS[0001]This application is related to, claims the priority benefit of, and is a U.S. continuation patent application of, U.S. Nonprovisional application Ser. No. 13 / 576,877, filed Oct. 24, 2012, which is related to, claims the priority benefit of, and is a U.S. national stage application of, International App. Ser. No. PCT / US2011 / 023742, filed Feb. 4, 2011, which is related to, and claims the priority benefit of, U.S. Provisional App. Ser. Nos. 61 / 301,509 and 61 / 301,520, each filed on Feb. 4, 2010.INCORPORATION BY REFERENCE OF SEQUENCE LISTING[0002]The sequence listings in text format submitted herewith as “SEQLIST.txt” and and the sequence listing submitted with PCT / US2011 / 023742 as “SEQLIST.txt” created Feb. 4, 2011 are herein incorporated by reference in their entirety.FIELD OF THE INVENTION[0003]The present invention relates to the field of evaluating compounds indicative of lymphoma related disorders, classifying lymphoma relat...

Claims


Application Information

Patent Timeline
Patent Type & Authority Applications(United States)
IPC IPC(8): G06F19/12G06F19/28G06F19/26C40B30/02G16B5/00G16B20/00G16B20/20G16B35/00G16B45/00
CPCG06F19/12G06F19/26G06F19/28C40B30/02G16B20/00G16B5/00G16B35/00G16B45/00G16C20/60G16B20/20
Inventor CHEN, JAKE YUEFANG, SHIAOFEN
Owner MEDEOLINX
Learn More