Generating an at Least Three-Dimensional Display Data Sheet

a technology of display data and data sheets, applied in image data processing, diagnostics, applications, etc., can solve the problem that the method does not provide for back-projecting x-ray images to a (blurred) three-dimensional image data s

Active Publication Date: 2015-06-25
SIEMENS HEALTHCARE GMBH
View PDF7 Cites 20 Cited by
  • Summary
  • Abstract
  • Description
  • Claims
  • Application Information

AI Technical Summary

Benefits of technology

[0019]An embodiment provides that the three-dimensional image data set is represented together (e.g., overlaid) with the display data set. In this way, improved orientation of the user in the display data set may be provided.
[0023]The time parameter assigned to the three-dimensional position is determined by a combination of individual parameters determined from the time-intensity curves. This provides that the information actually contained in the display data set, the time parameter, at a three-dimensional position is formed by combination of the individual time parameters from the two projection directions, for example. Various possibilities may be provided. It is thus possible for the combination to be made, for example, as a weighted average formation. In this way, a simple linear combination of the individual parameters from the projection directions exists. The use of weightings and possibly other reconstruction methods may enable a further improvement in the determination of the time parameter, where, for example, for the combination of the individual parameters, the time-intensity curves are taken into account. A classic example of this is that it is checked whether an artery or a vein should be observed. For arteries, the time-intensity curve is characterized by a steeper rise and a narrower curve overall, which essentially corresponds to the bolus length. The venous time-intensity curve is more elongated. By comparisons, for example, with curve forms stored in a database, the quality, for example, of the selection of the correspondence point may be assessed, and then, a weighting of both combinations may be determined. Depending on the frame rate, a fit quality for the time-intensity curve may also be used as a weighting in the combination of the individual time parameters. Time window creation and therefore a restriction of the portion of the time-intensity curve that is to be evaluated may also be carried out for at least one projection direction for determination of the time parameter. A process of this type may be provided, for example, if the time-intensity curve for one of the projection directions shows an overlapping of vessels that reach a maximum contrast medium concentration at distinctly different time points (e.g., TTPs). A classic example of such a configuration exists if the projection for one correspondence point that is intended to relate to an artery also records a vein, while the other does not. Then, in order to enable a tidier evaluation of the time-intensity curve, a restriction of the time region under observation may take place such that interfering portions of the vein are kept as slight as possible. Therefore, a time region, in which fewer overlaps are to be found, and only the relevant vessels or regions are observed, is selected. In general terms, therefore, it may be provided that, in order to determine the individual time parameter for at least one projection direction, only one time-limited portion of the time-intensity curve is observed.
[0027]As previously mentioned, with the procedure according to one or more of the present embodiments, apart from averaging the time parameters by evaluating the time-intensity curves, a four-dimensional display data set may be generated by defining a time-intensity curve in three-dimensional space for the three-dimensional positions. Its reliability, however, may be relatively low. The method according to one or more of the present embodiments makes it possible, by other ways, to generate at least pseudo-four-dimensional display data sets.

Problems solved by technology

In other words, the method does not provide for back-projecting the x-ray images to a (blurred) three-dimensional image data set, but rather, information derived from the chronological sequence (and thus from many x-ray images) is analyzed in the three-dimensional space.

Method used


Image

  • Generating an at Least Three-Dimensional Display Data Sheet
  • Generating an at Least Three-Dimensional Display Data Sheet
  • Generating an at Least Three-Dimensional Display Data Sheet

Examples


Embodiment Construction

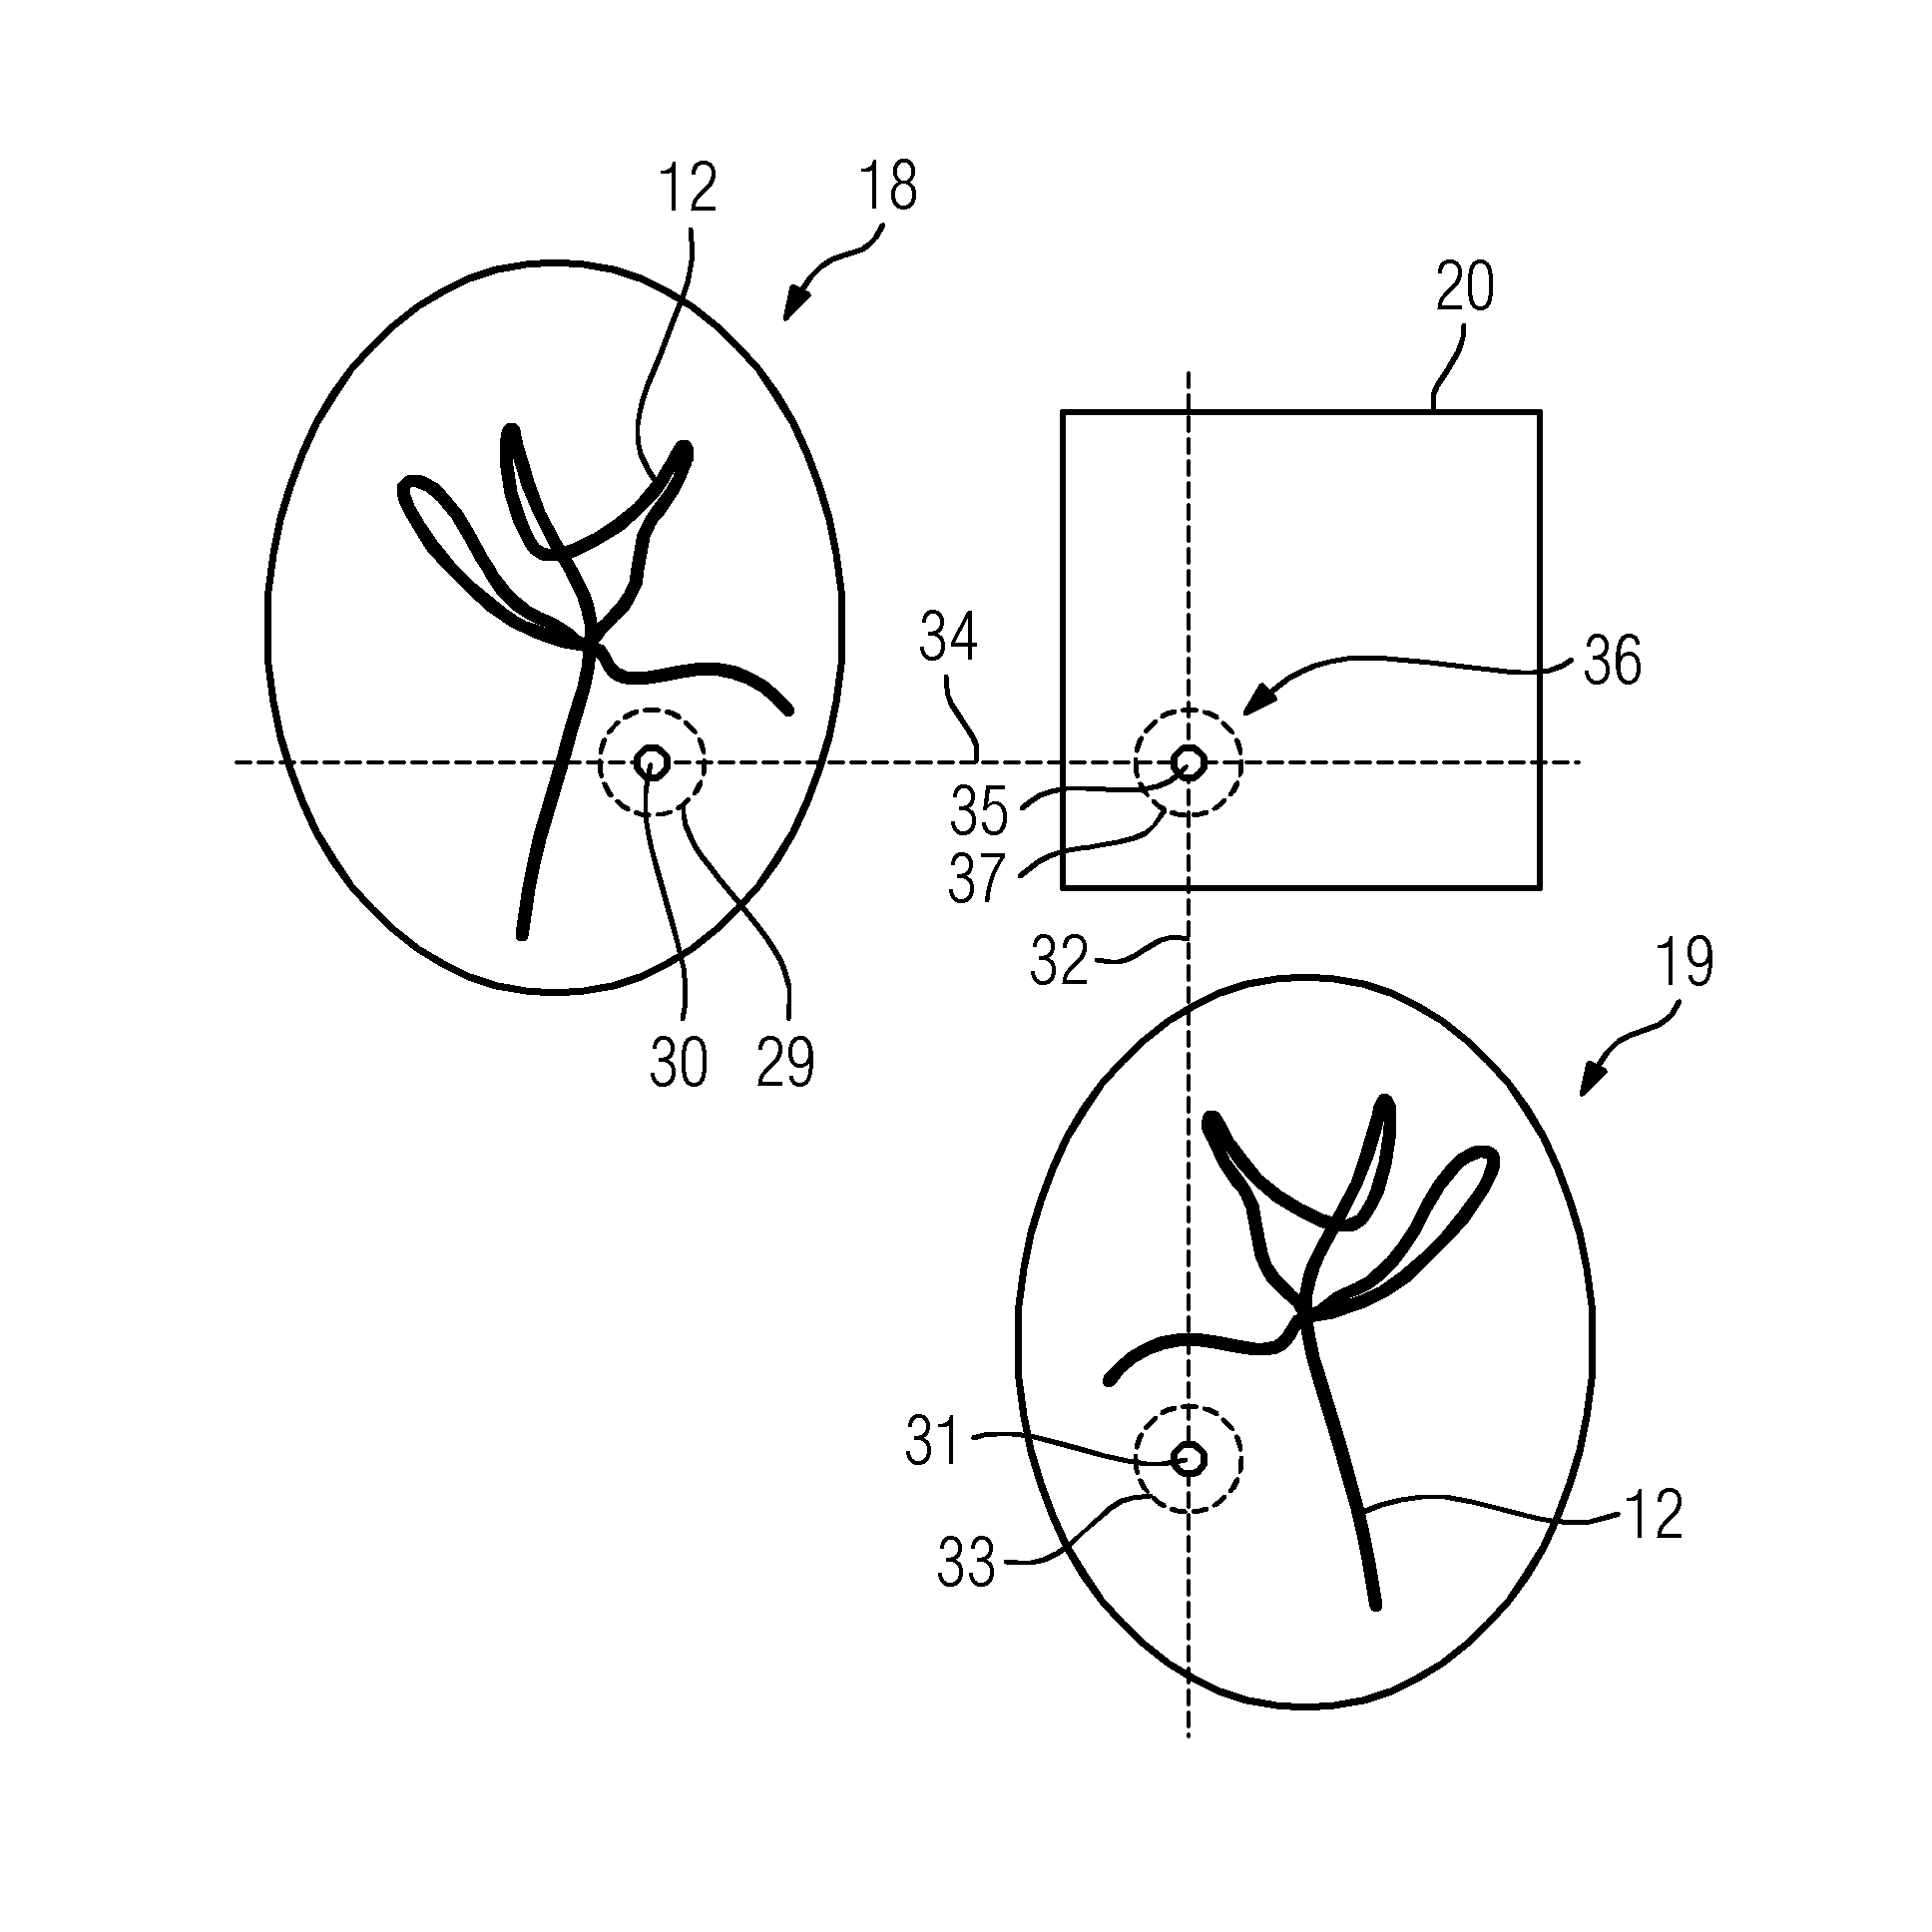
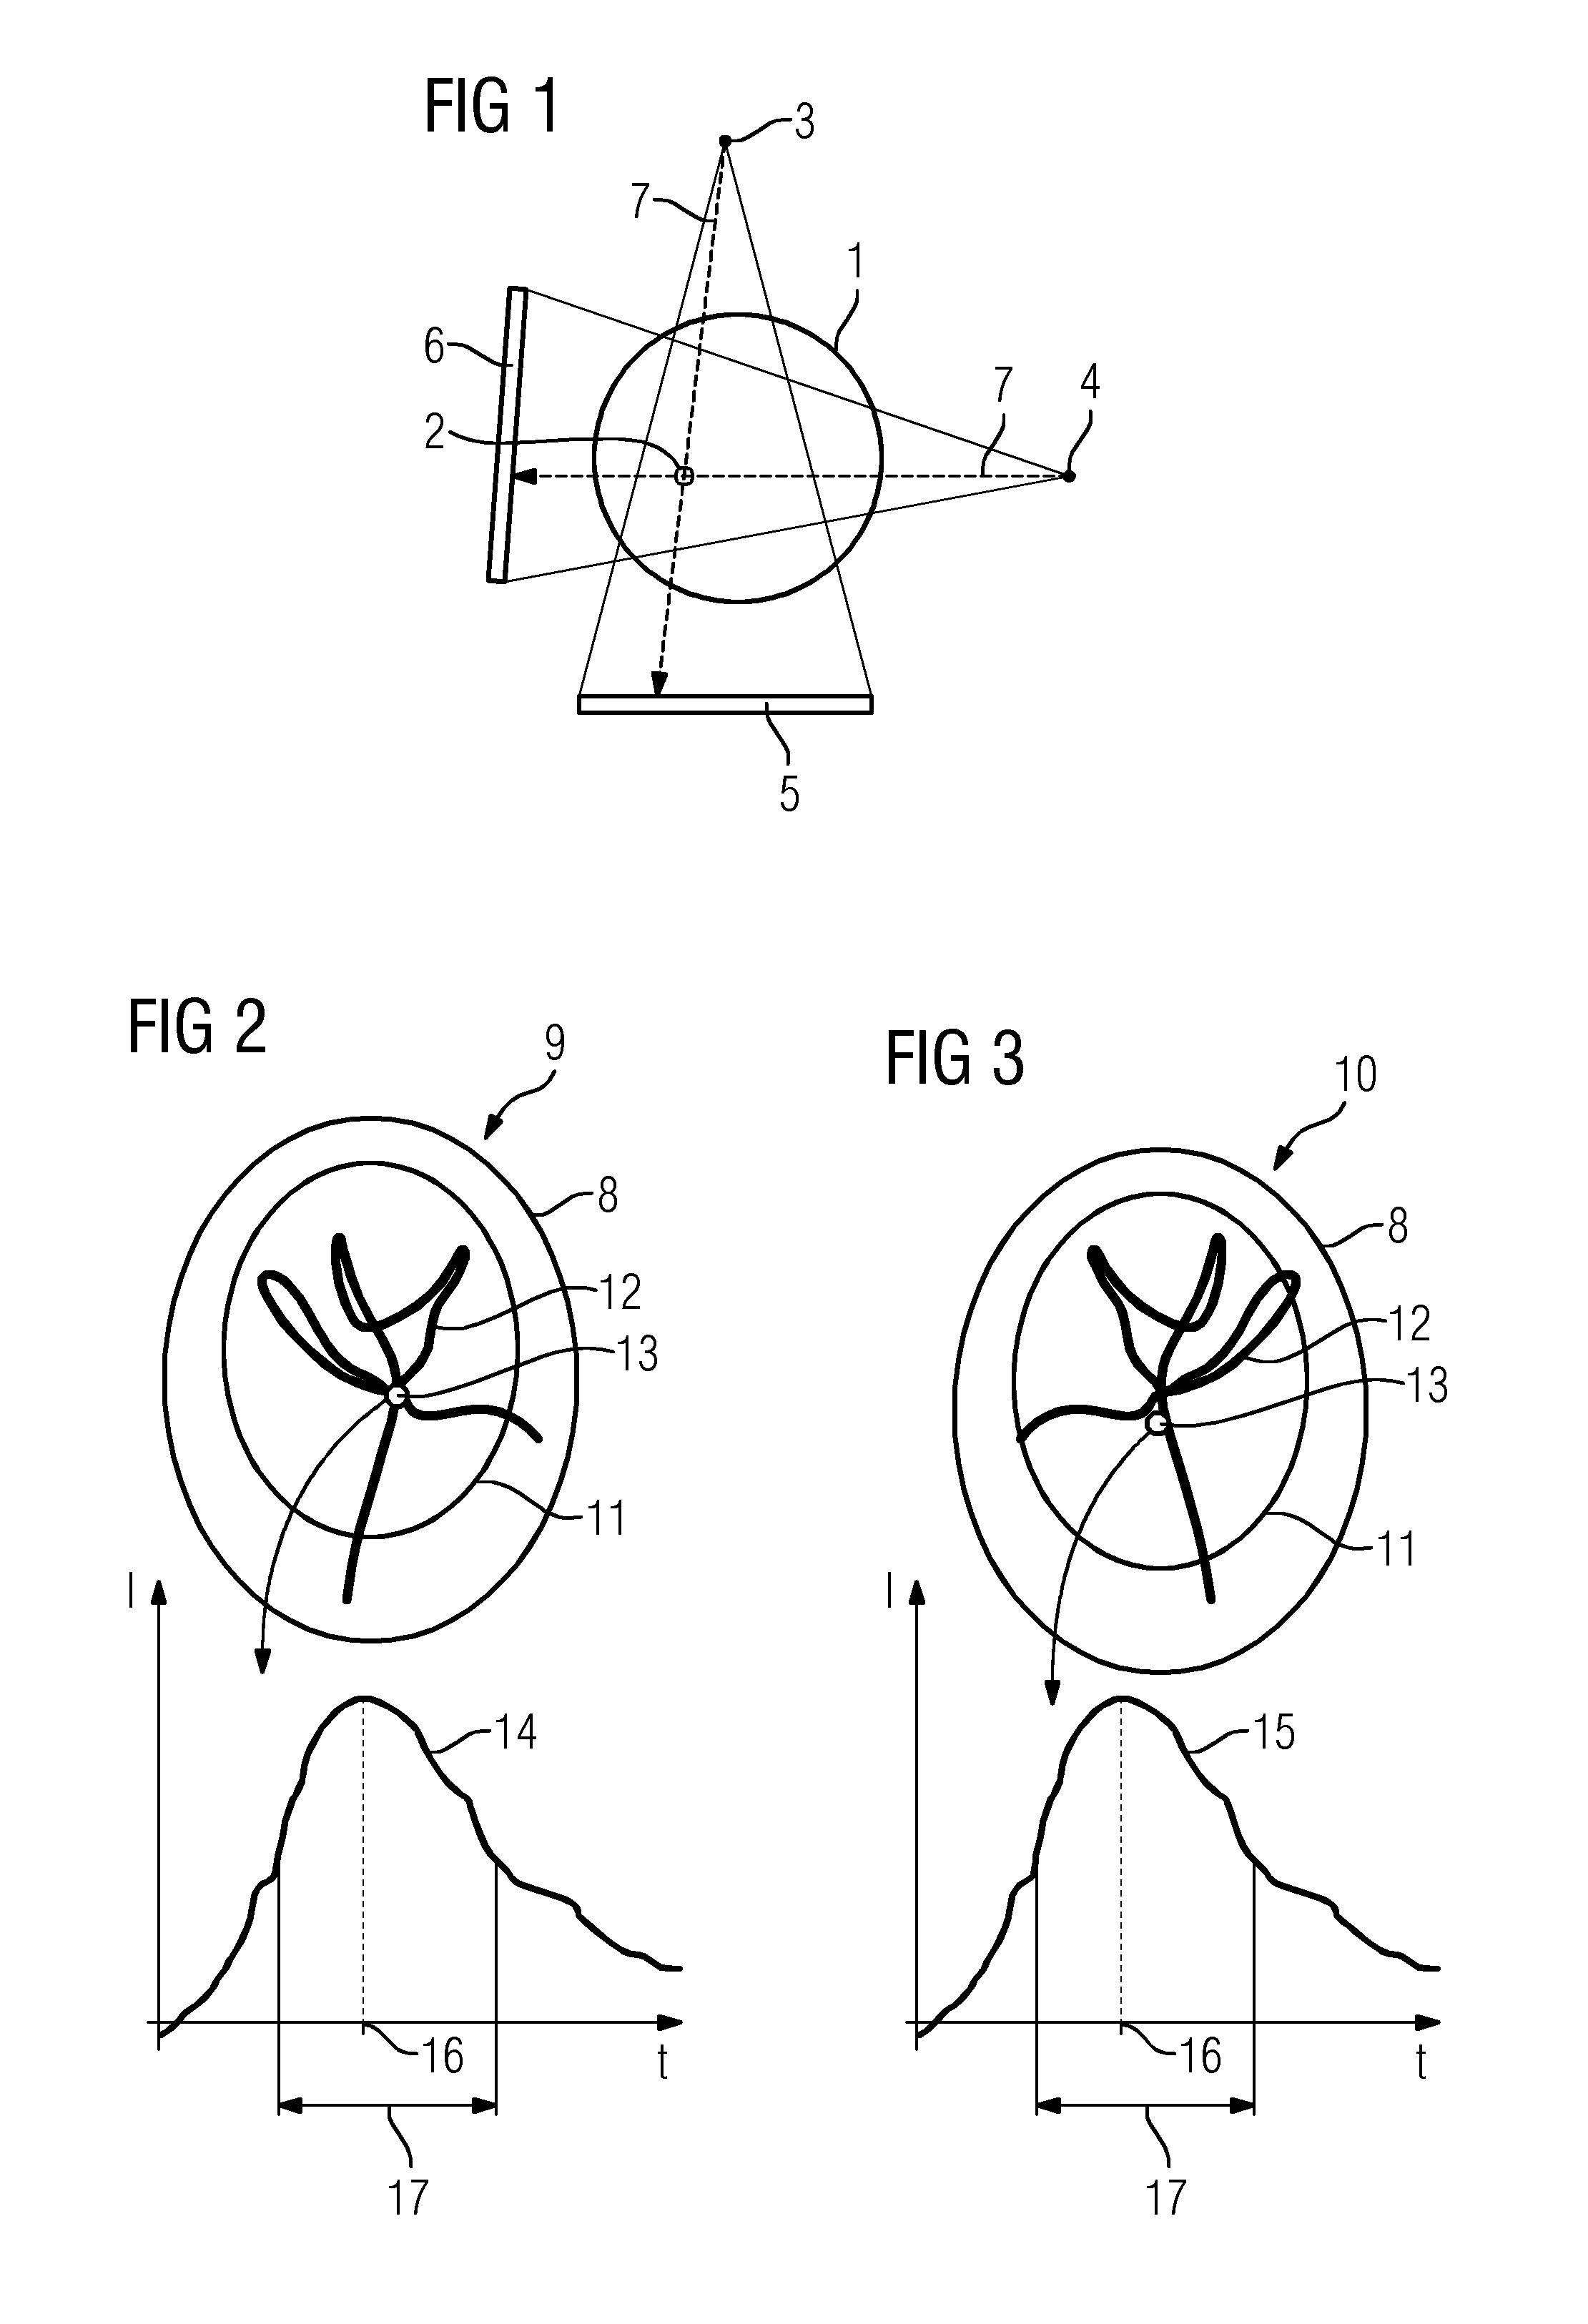
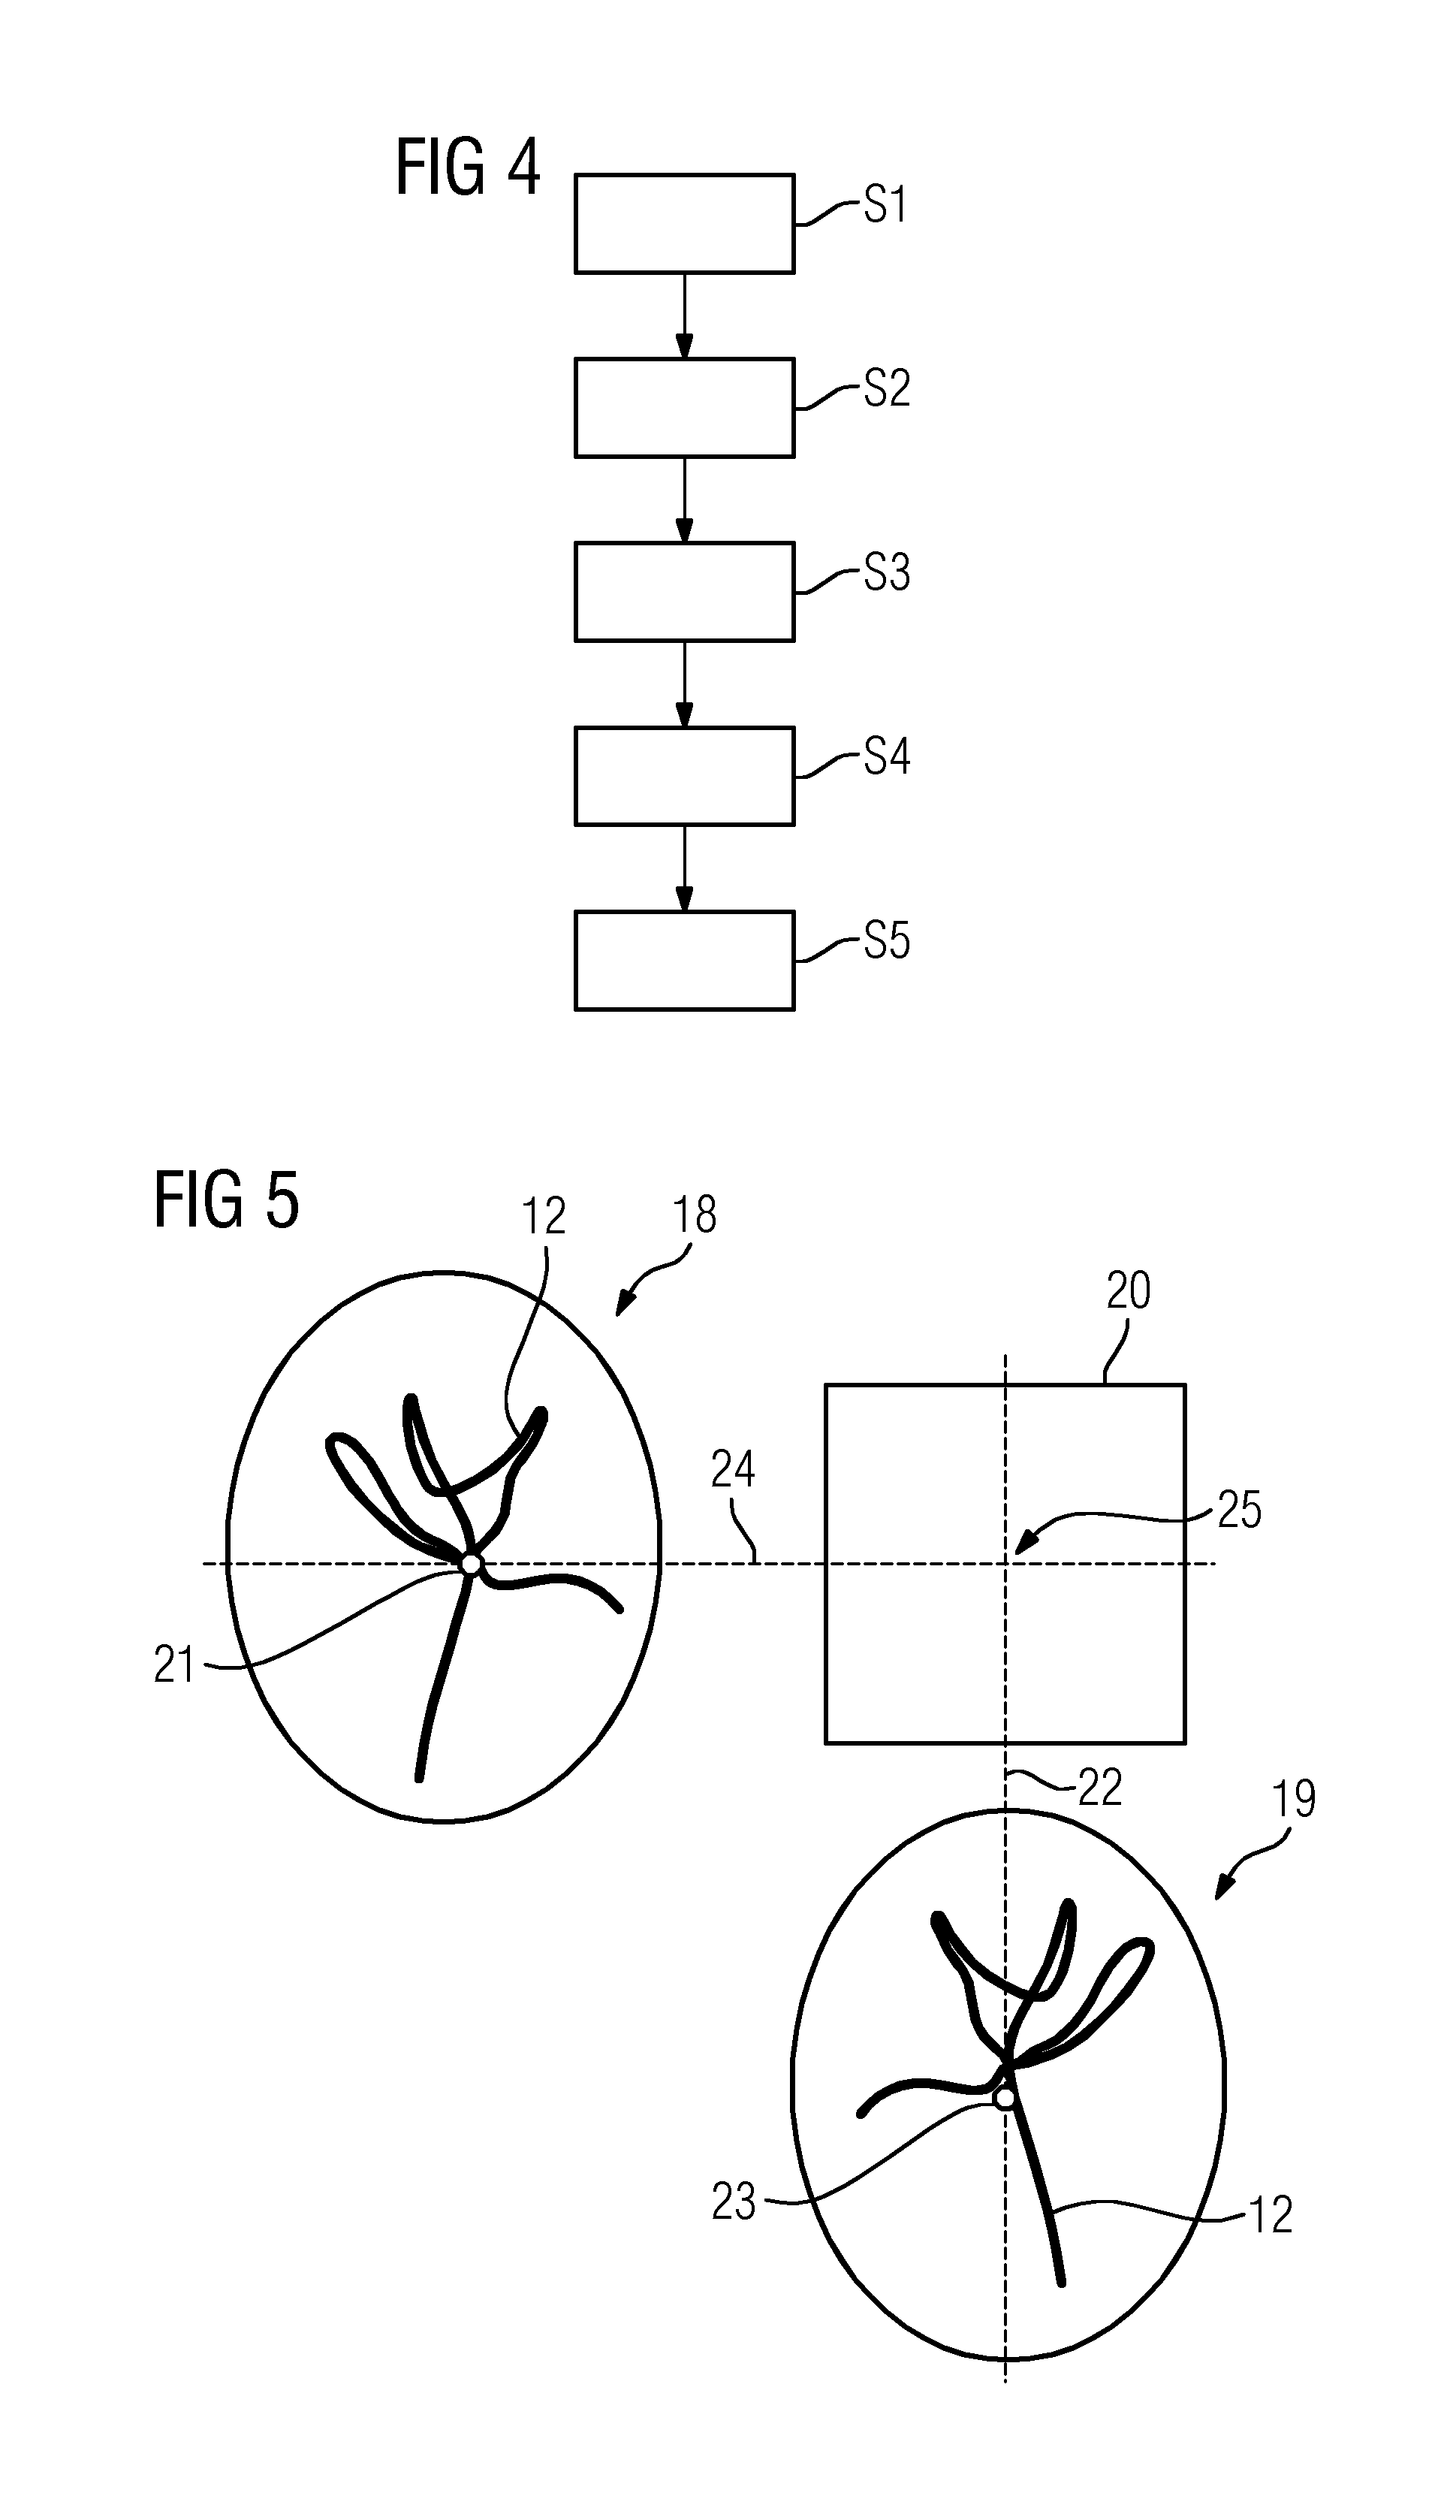
[0042]The exemplary embodiment of the method described below relates to the creation of a three-dimensional display data set that contains time parameters relating to spread of a contrast medium in a vascular system or derived therefrom. The time parameters are assigned to positions in the three-dimensional space. In the present case, an examination of the head of a patient is considered, where the target of the examination may be either arteries and veins or parenchyma, as will be shown in greater detail below. Where the determination of three-dimensional positions is of interest, in the practical implementation, this corresponds to the marking of particular image elements / voxels of the three-dimensional display data set. This provides that if a three-dimensional position is determined for correspondence points defined in two different projection directions, a voxel is assigned to the correspondence points in the display data set. If a three-dimensional position is determined for c...


PUM


Abstract

A method for generating an at least three-dimensional display data set of a time parameter relating to the chronological spreading of a contrast medium introduced into a vessel system is provided. A series of chronologically successive x-ray images of digital subtraction angiography from at least two different projection directions showing the chronological spreading of the contrast medium is used. The method includes determining a three-dimensional position for at least one correspondence point and / or correspondence region defined, in each case, in at least one x-ray image of a projection direction. For each three-dimensional position, a time parameter assigned to the three-dimensional position is determined by evaluation of time-intensity curves assigned to the correspondence points or correspondence regions over the series. The display data set formed from the three-dimensional positions is displayed with the assigned time parameters.

Description

[0001]This application claims the benefit of DE 10 2013 226 858.0, filed on Dec. 20, 2013, which is hereby incorporated by reference in its entirety.BACKGROUND[0002]The present embodiments relate to generating an at least three-dimensional display data set of a time parameter relating to chronological spreading of a contrast medium introduced into a vessel system.[0003]It is known in the field of angiography to administer contrast medium that may be clearly recognized in image recordings (e.g., x-ray recordings) and thus permits an assessment of the blood flow and the blood perfusion in the vascular system of a patient and also in the tissue. A classic technique for following the spread of the contrast medium is digital subtraction angiography. In this process, a mask image without contrast medium is recorded. After this, raw images are recorded, often as a chronological series in a time range in which the contrast medium passes through the target region or vascular system of intere...

Claims


Application Information

Patent Timeline
Patent Type & Authority Applications(United States)
IPC IPC(8): A61B6/00
CPCA61B6/466A61B6/481A61B6/504A61B6/469A61B6/4014A61B6/4441A61B6/501A61B6/507A61B6/5235G06T7/0012G06T7/593G06T2207/10021G06T2207/10116G06T2207/30101
Inventor KYRIAKOU, YIANNIS
Owner SIEMENS HEALTHCARE GMBH
Why Eureka
Try Eureka