Method of monitoring the condition of a wind turbine
a technology of wind turbine and condition monitoring, which is applied in the direction of motors, machine parts testing, programme control, etc., can solve the problems of abnormally high vibration, wear and attrition of mechanical elements of wind turbines, and increase (and damage) vibration, so as to increase reduce the use of said method, and improve the overall sensitivity of the monitoring system
- Summary
- Abstract
- Description
- Claims
- Application Information
AI Technical Summary
Benefits of technology
Problems solved by technology
Method used
Image
Examples
example 1
[0069]The measures can be taken with the wind turbine operating under any condition or under certain pre-determined conditions. In the latter case, identification of potential correlations is facilitated by limiting the range of available values for both the measured variable and the parameter(s). Said pre-determined conditions will of course vary as a function of the technical specifications of the monitored wind turbine (power, rotational speed, size). In any case, the definition of these pre-determined conditions is not a requirement and the disclosed method can be also carried out when measurements are taken over the complete operating range.
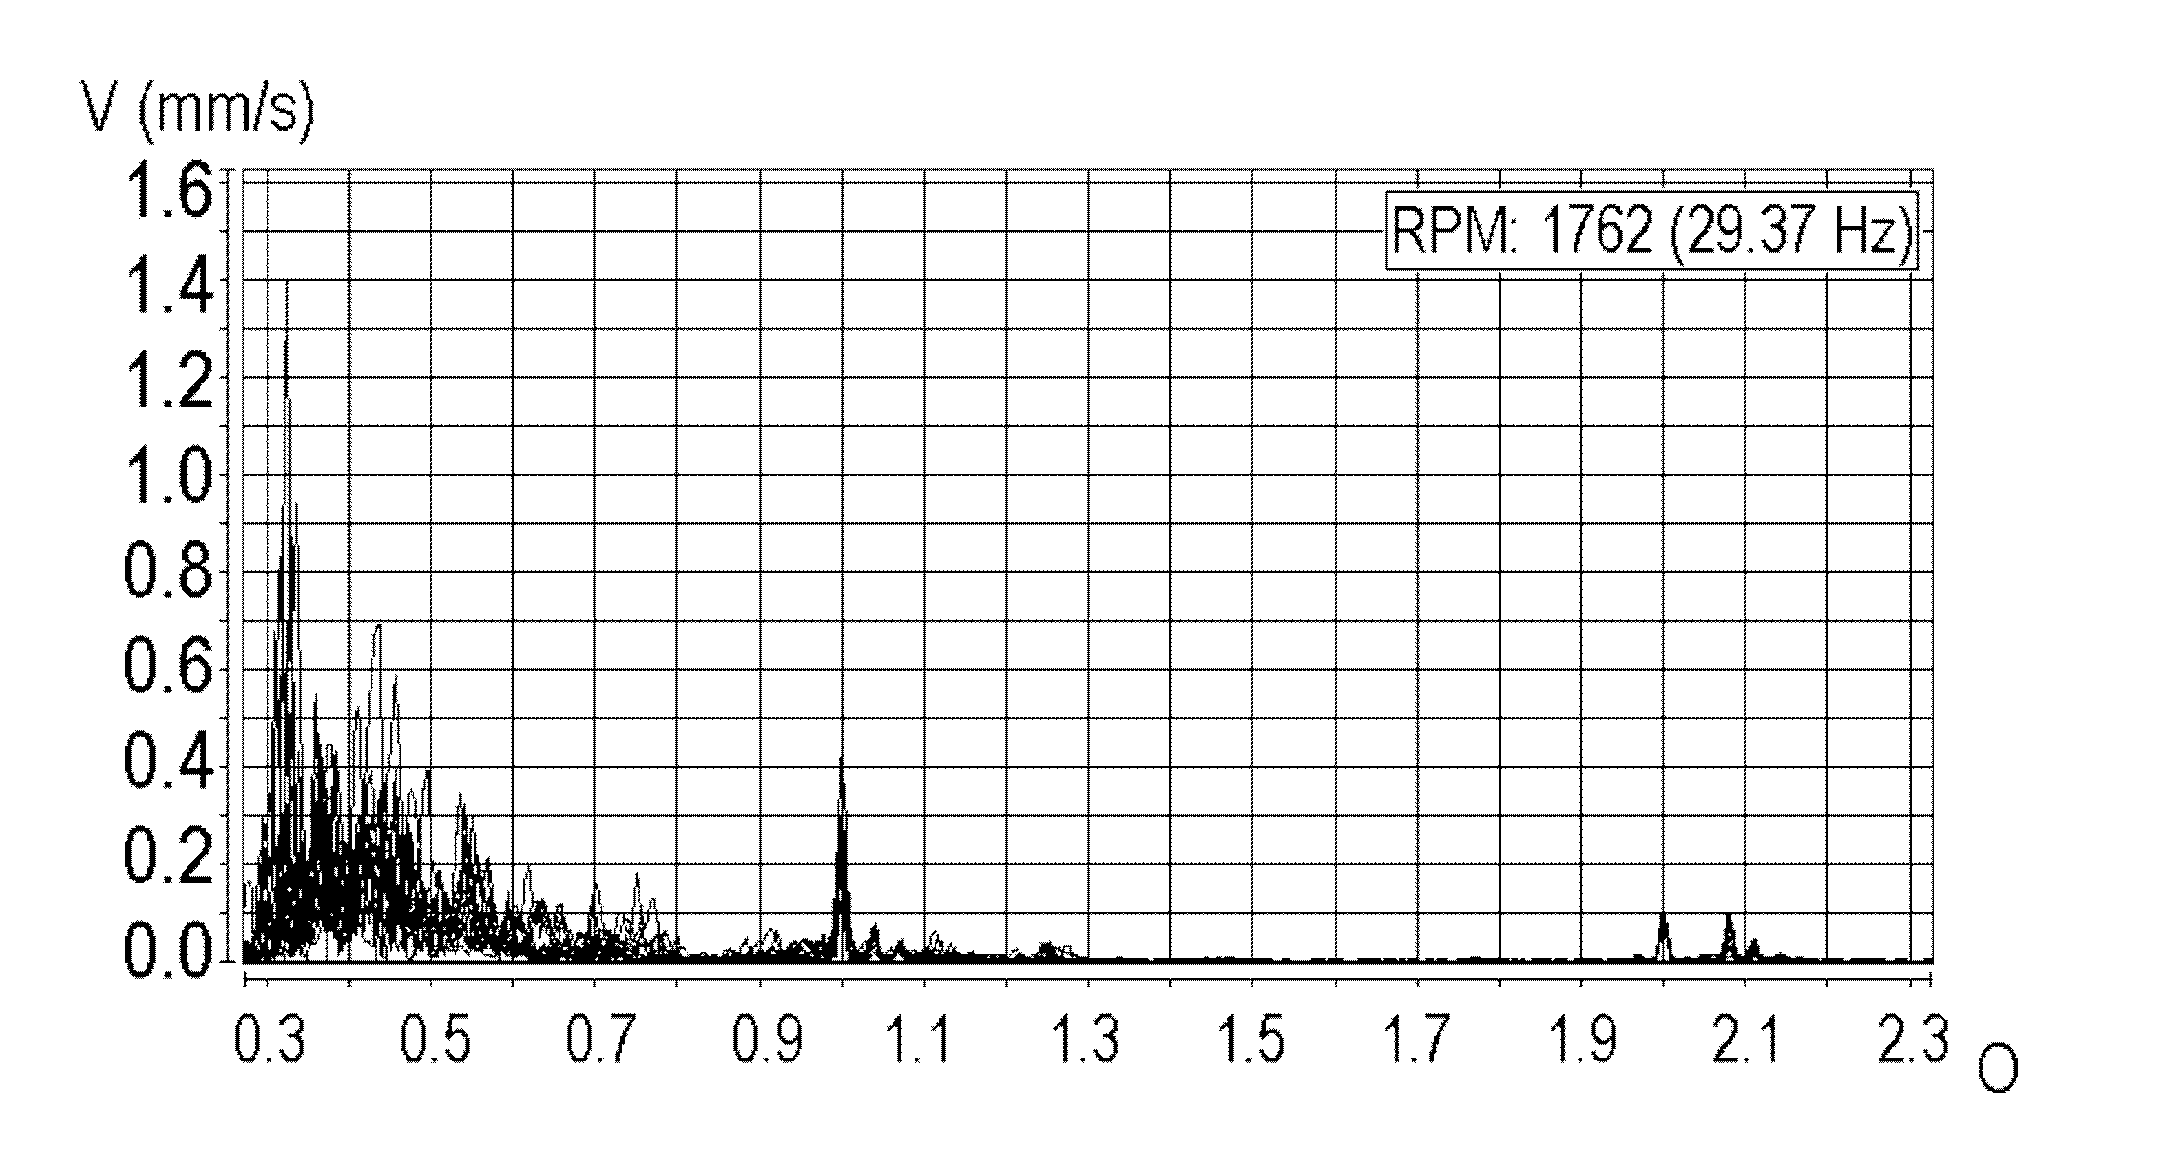
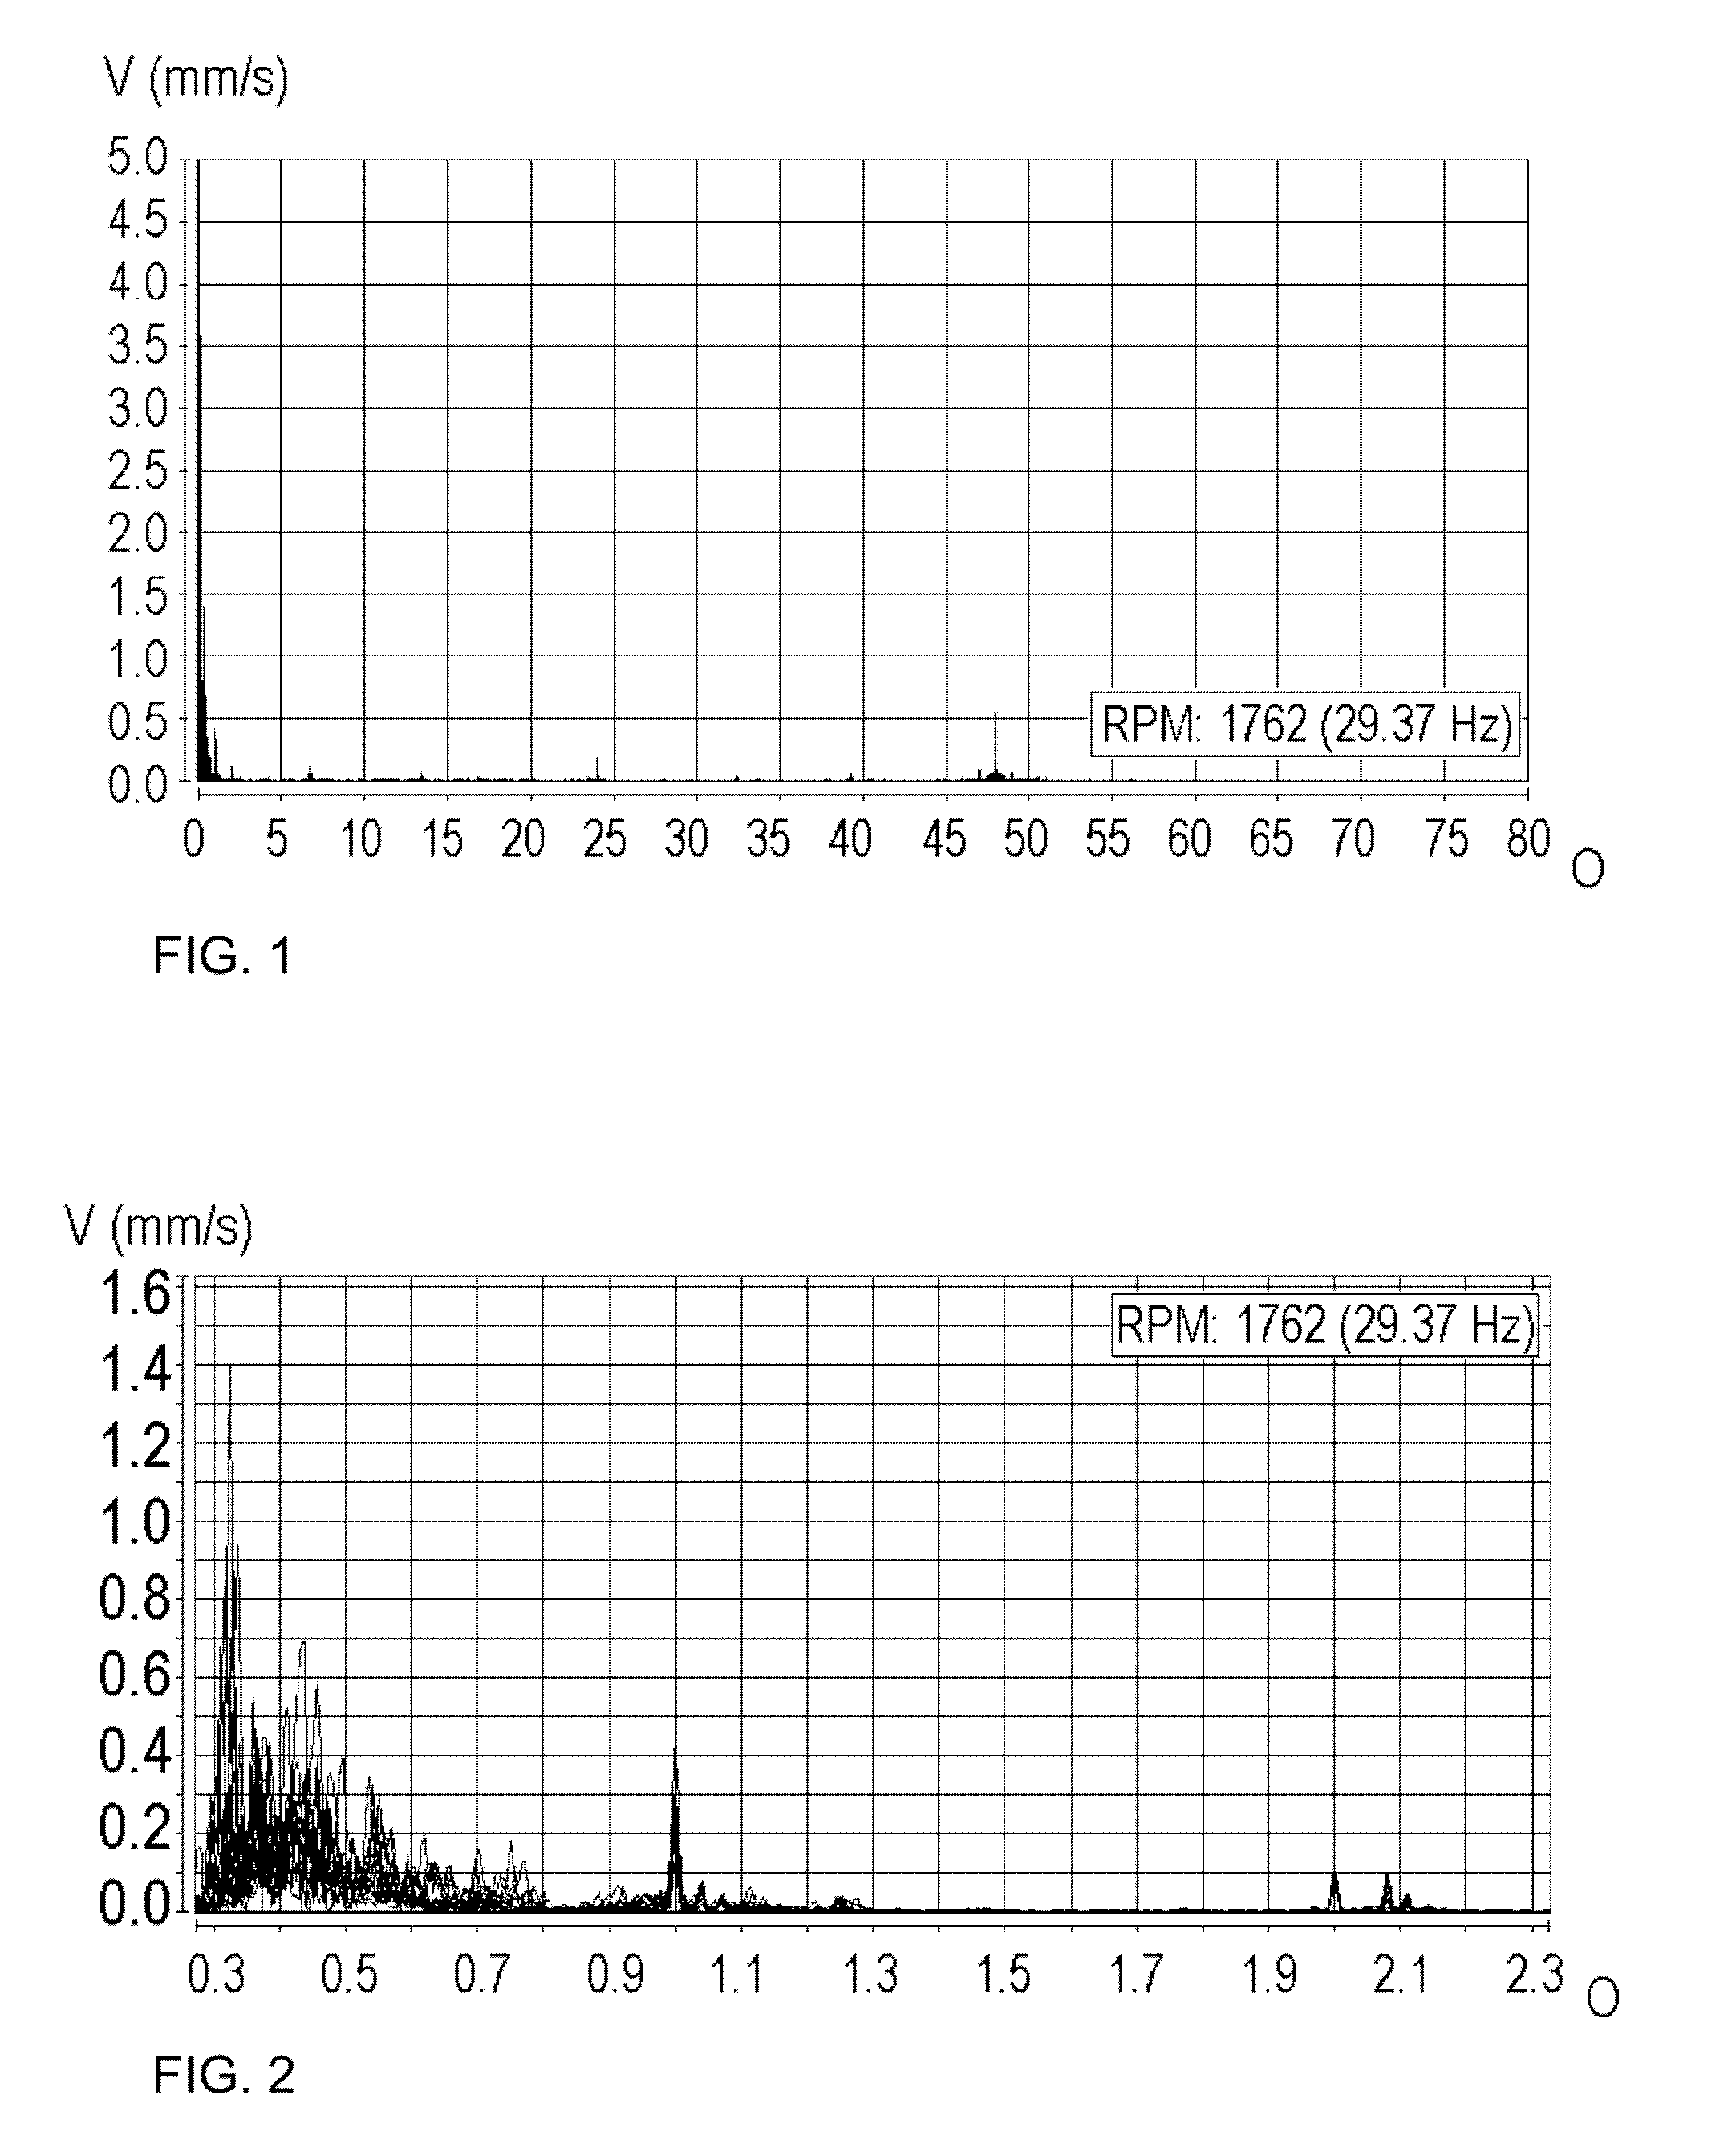
[0070]In this example, the use of certain pre-determined conditions was preferred. In particular, the following ranges were selected:[0071]a rotational speed P of the high-speed shaft between 1000 and 2000 rpm;[0072]an electrical power in the range of 180 to 600 KW.
[0073]Acquired data must be processed, so that a characteristic quantity “CQ”...
example 2
[0090]Again, the measures are taken within a certain operating range. In this case, the wind turbine operates within the following conditions:[0091]a rotational speed P of the high-speed shaft between 600 and 1800 rpm;[0092]an electrical power in the range of 200 to 600 KW.
[0093]The same variable, V, is used (i.e. vertical acceleration of the high speed shaft) and an equivalent process is used to determine the characteristic quantity, CQ. In this case, a spectral band between 1.8 and 2.2 orders, which is characteristic of, among others, possible faults at the bearing of the high-speed shaft, is selected.
[0094]As before, a known procedure will be described first.
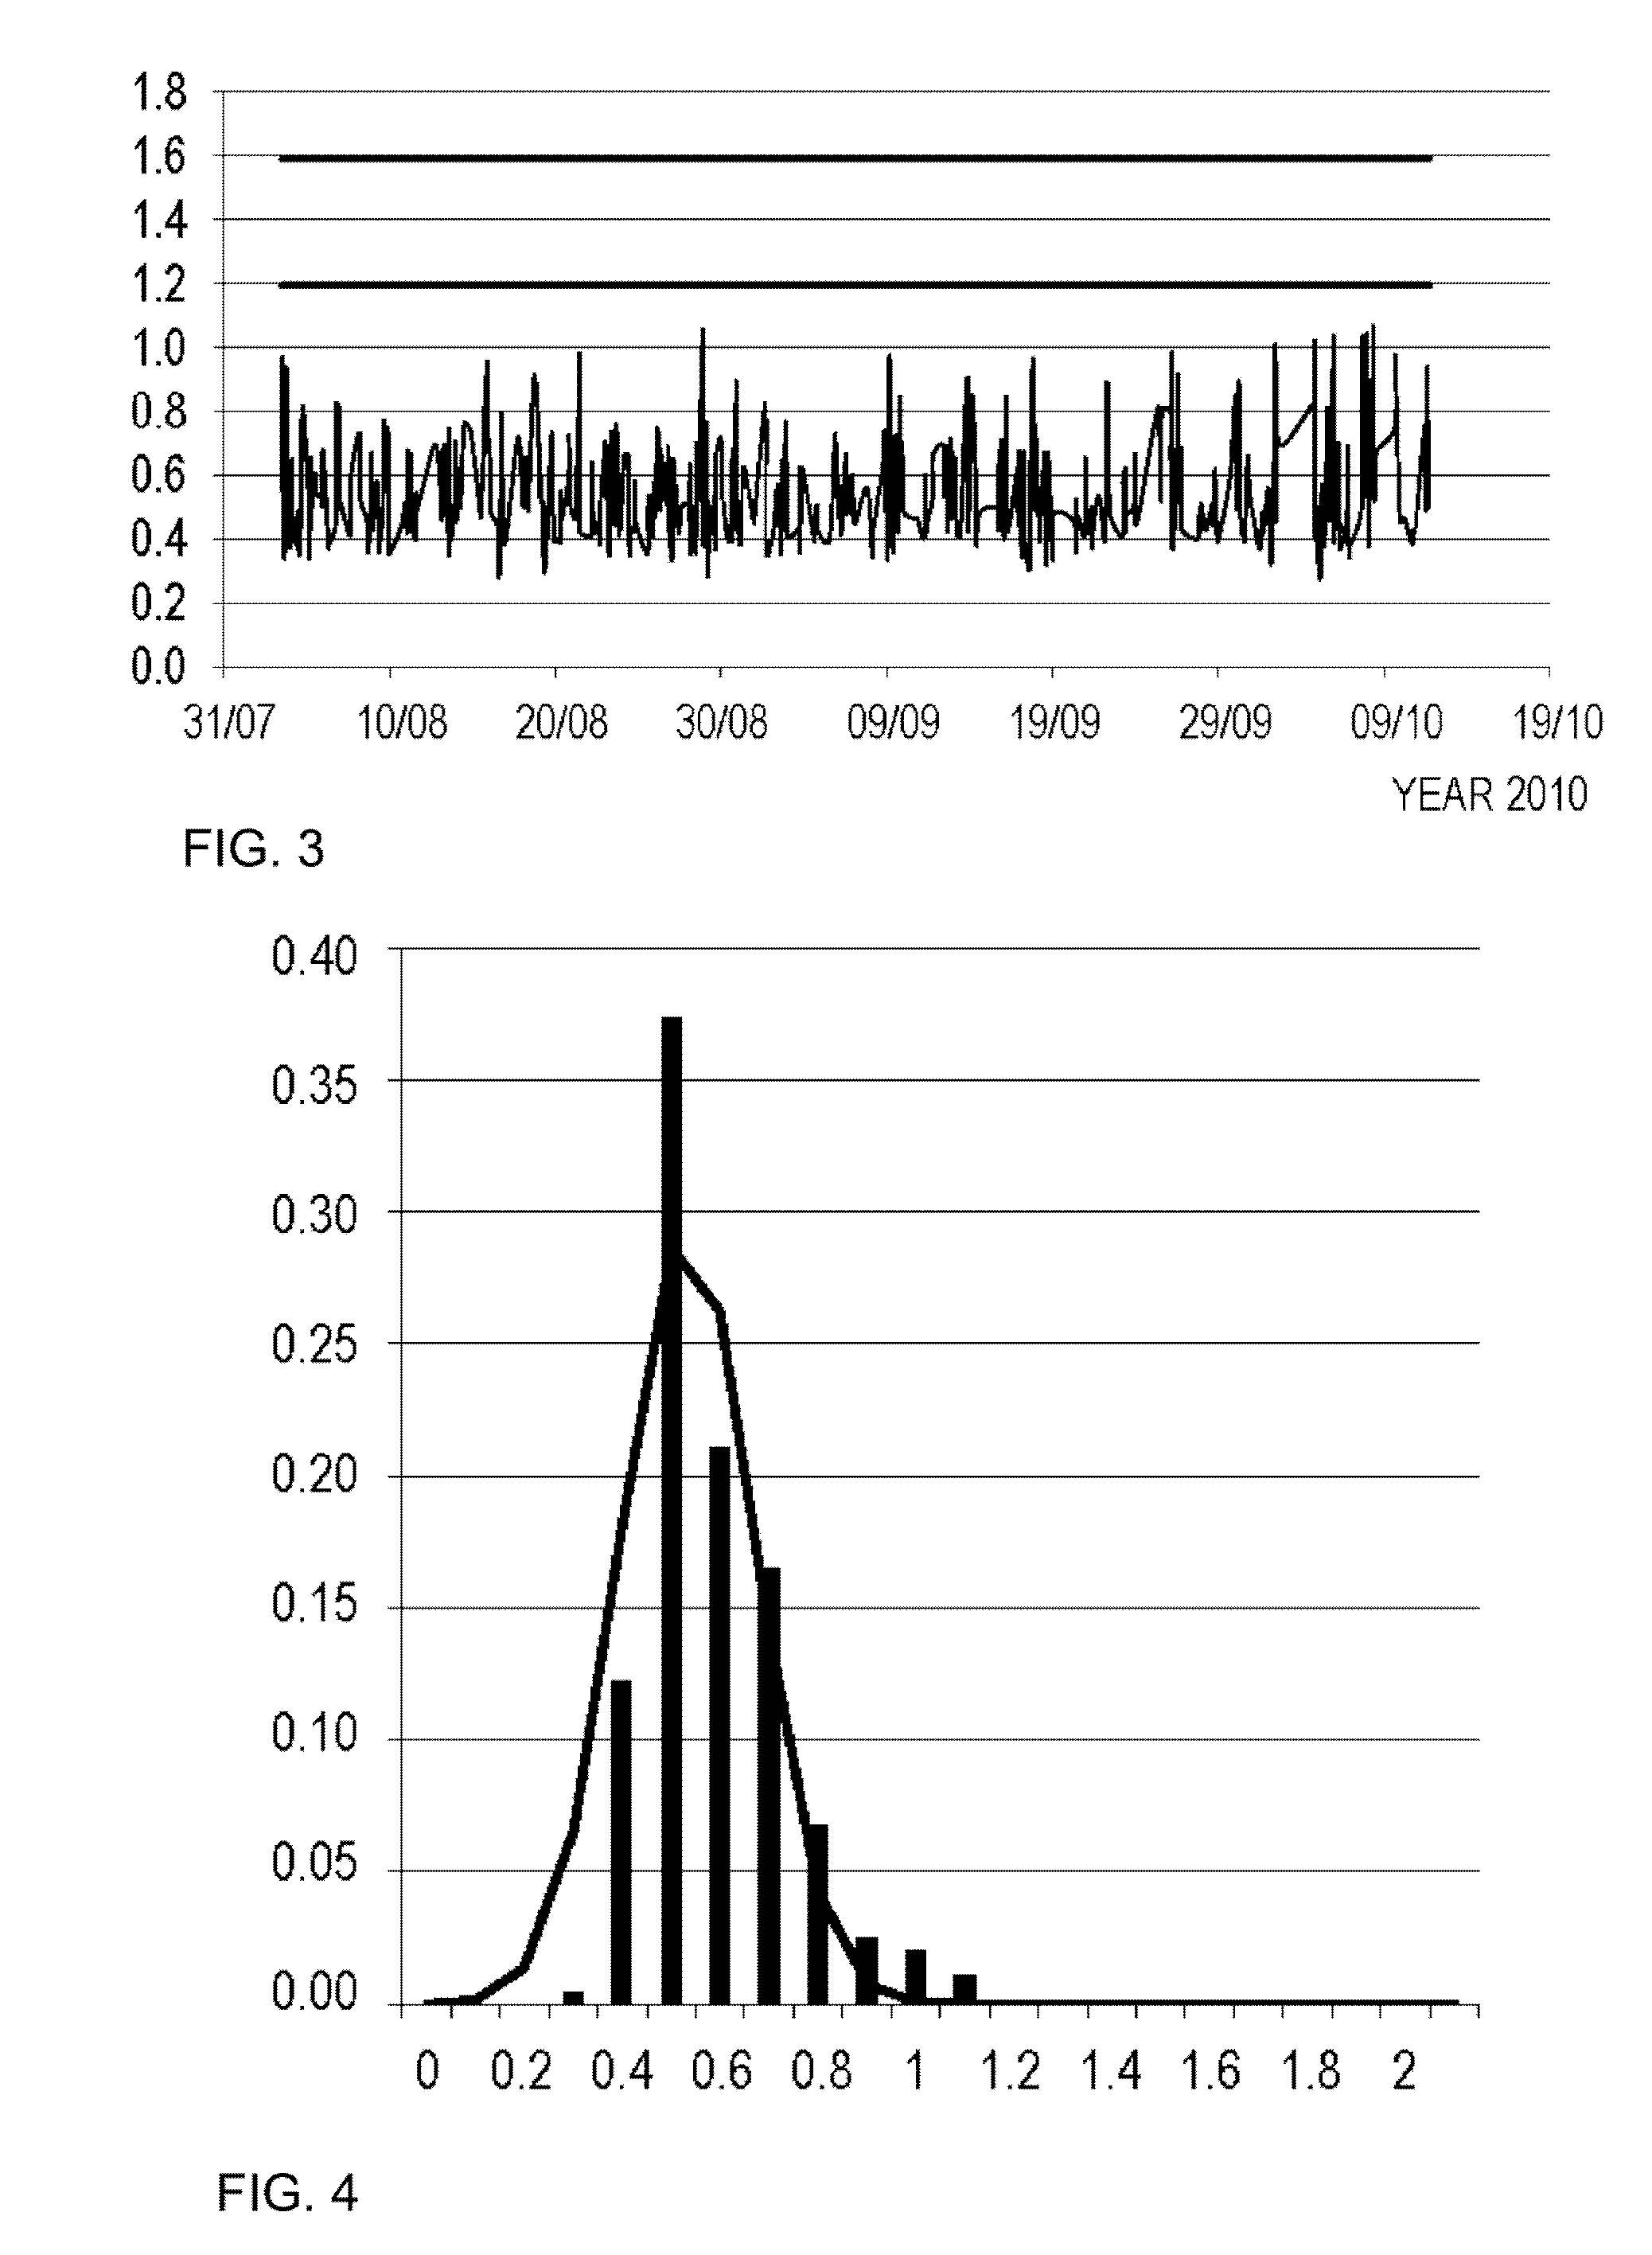
[0095]FIG. 9 represents a time series of CQ over two months, and FIG. 10 shows a histogram made from the data of FIG. 9 and a normal probability distribution that approximates said histogram. The abscissa axis of FIG. 10 corresponds to the ordinate axis of FIG. 9. It can be seen that the mean value of CQ in the time series is...
PUM
 Abstract
Description
Claims
Application Information
 - R&D
- Intellectual Property
- Life Sciences
- Materials
- Tech Scout
- Unparalleled Data Quality
- Higher Quality Content
- 60% Fewer Hallucinations
Browse by: Latest US Patents, China's latest patents, Technical Efficacy Thesaurus, Application Domain, Technology Topic, Popular Technical Reports.
© 2025 PatSnap. All rights reserved.Legal|Privacy policy|Modern Slavery Act Transparency Statement|Sitemap|About US| Contact US: help@patsnap.com


